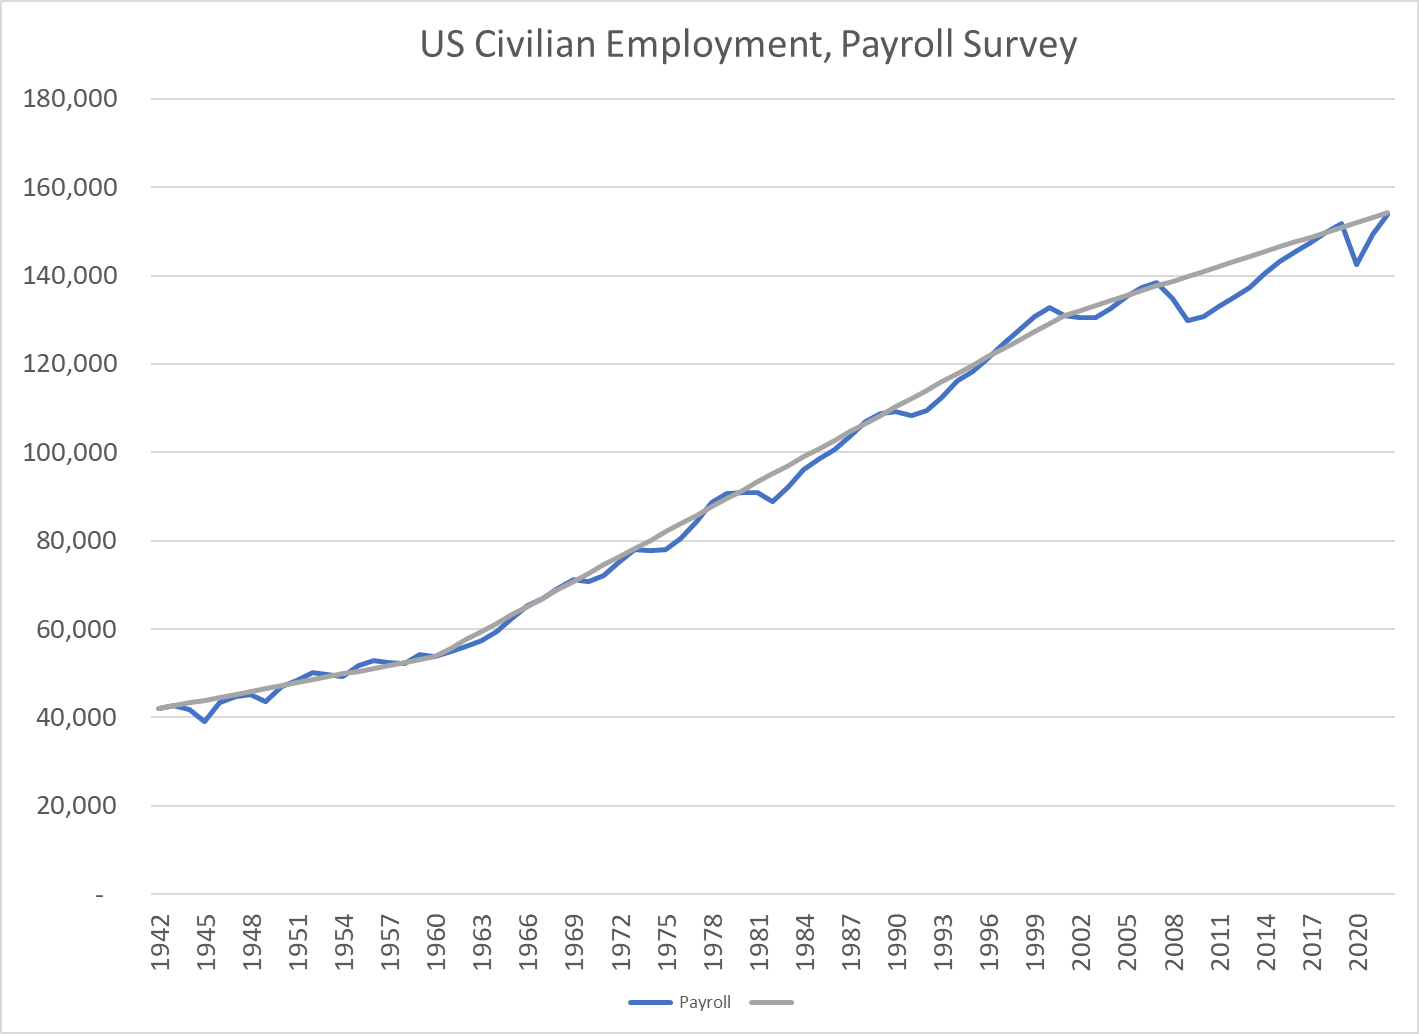
In 1942, the US economy employed 41.9 million people in firms. At the end of 2022, the number will be 153.8 million, an increase of 267%. Yes, for very 3 jobs in 1942, we have 11 today. Yes again, almost 4 times as many in 2022 versus 1942, despite the 9 million jobs lost in 2008-9 and the 9 million jobs lost in 2020.
The US economy added 12 million jobs between 1942 and 1960, growing from 42 to 54 million positions. Job growth averaged nearly 700,000 per year or 1.4% annually. This was a period of solid growth, despite the 4 recessions.
The period from 1960 through 2001 showed truly remarkable job growth. The economy added 78 million jobs, almost 1.9 million each year or 2.2% annually. STOP and think about this. The Greatest Generation, WW II saving the planet team was just 40 million employees in the US. The immediate post-war boom increased employment to 55 million when the US was the only advanced economy running at full speed. But employment growth accelerated from 1960 to 200. These 4 decades essentially tripled the size of the US economy.
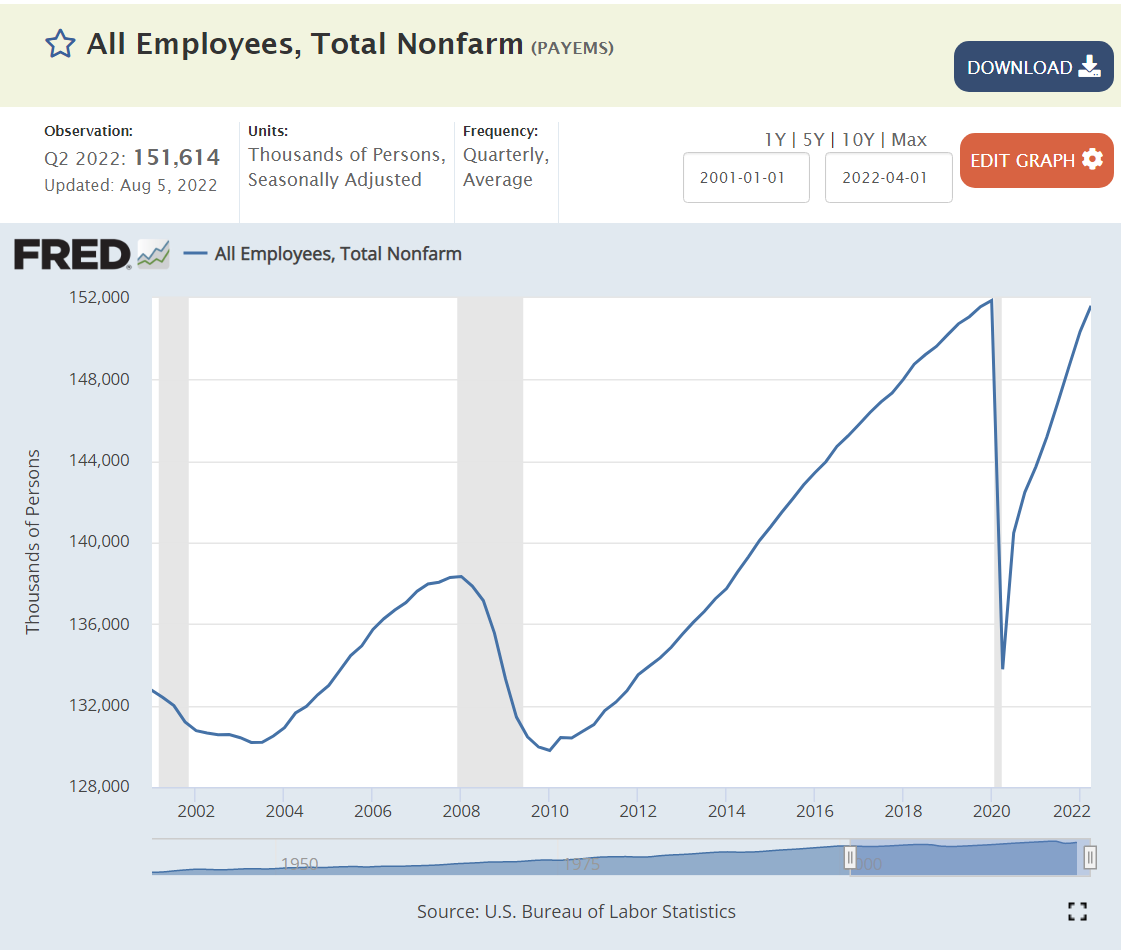
Overall, the last two decades have delivered much slower job growth. Using 2019 as an ending measure, the economy grew by 21 million jobs, from 131 to 152 million since 2001. This is just 1.1 million per year, or a growth rate of 0.8%, far below the 2% plus rate of 1960-2000. Or, the 21 million added jobs is one-half of the jobs in 1942 in the heart of WW II.
But, these two decades experienced the post-millennium downturn, the great recession and the covid pandemic.
The economic recovery from the millennium (Y2K) was quite slow. The recovery from the Great Recession was slow but strong and extended, allowing unemployment rates to eventually reach 3.5%. The recovery from the pandemic situation was much faster than expected, reaching pre-pandemic levels of GDP and employment within 2 years.
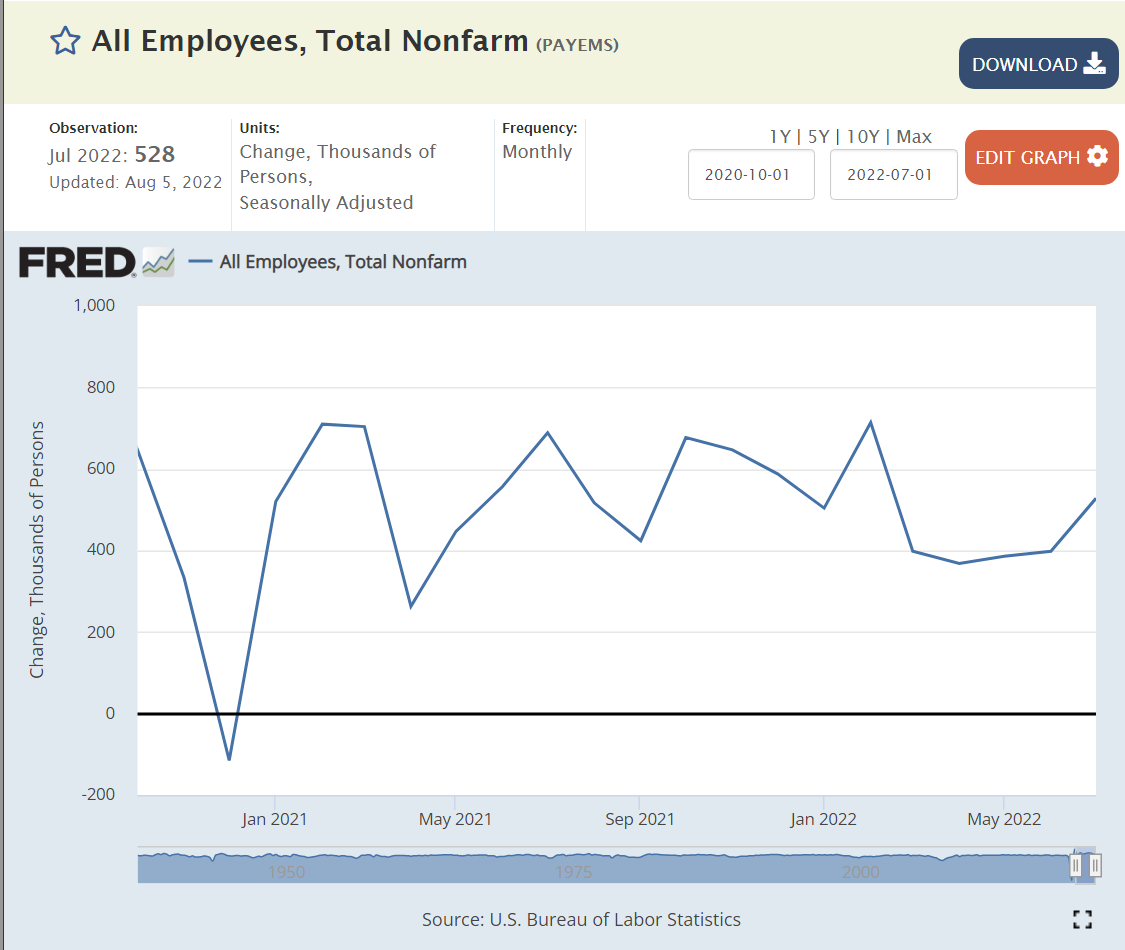
The economy has been adding 400,000 jobs each month since the beginning of 2021, almost an amazing 5 million jobs annually.
Million Jobs Added Per Year in Economic Recovery Periods
1948: 2.0
1952: 2.2
1956: 1.8
1959: 2.0
1969: 1.9
1973: 2.4
1980: 2.2
1990: 2.5
2000: 2.7
2007: 1.6
2019: 2.2
The US economy adds 2 million jobs each year when the economy is expanding. The percentage growth rate is slower through time, but the 2 million jobs added each year remains a solid capacity or capability.
Summary
The US economy added 1.4% new jobs annually from 1942-1960. The jobs growth rate averaged a very strong 2.2% from 1960-2021. It then slowed to just 0.8% annually while digesting the Great Recession and the COVID pandemic. The economy added more than 2 million jobs each year after the Great Recession, pushing unemployment to a very low 3.5%. The economy rebounded from the pandemic much faster than the consensus view,
declining shares for agriculture, mining and manufacturing
greater outsourcing of corporate functions
greater share of contracting, non-traditional employment, part-time employment
lower rates of geographic mobility
lower rates of economic upward mobility
greatly increased political polarization at the state and local level
decreased labor force participation rates
increased opioid and drug damage rates
lower community service participation rates
lower church attendance and membership rates
lower male college attendance and graduation rates
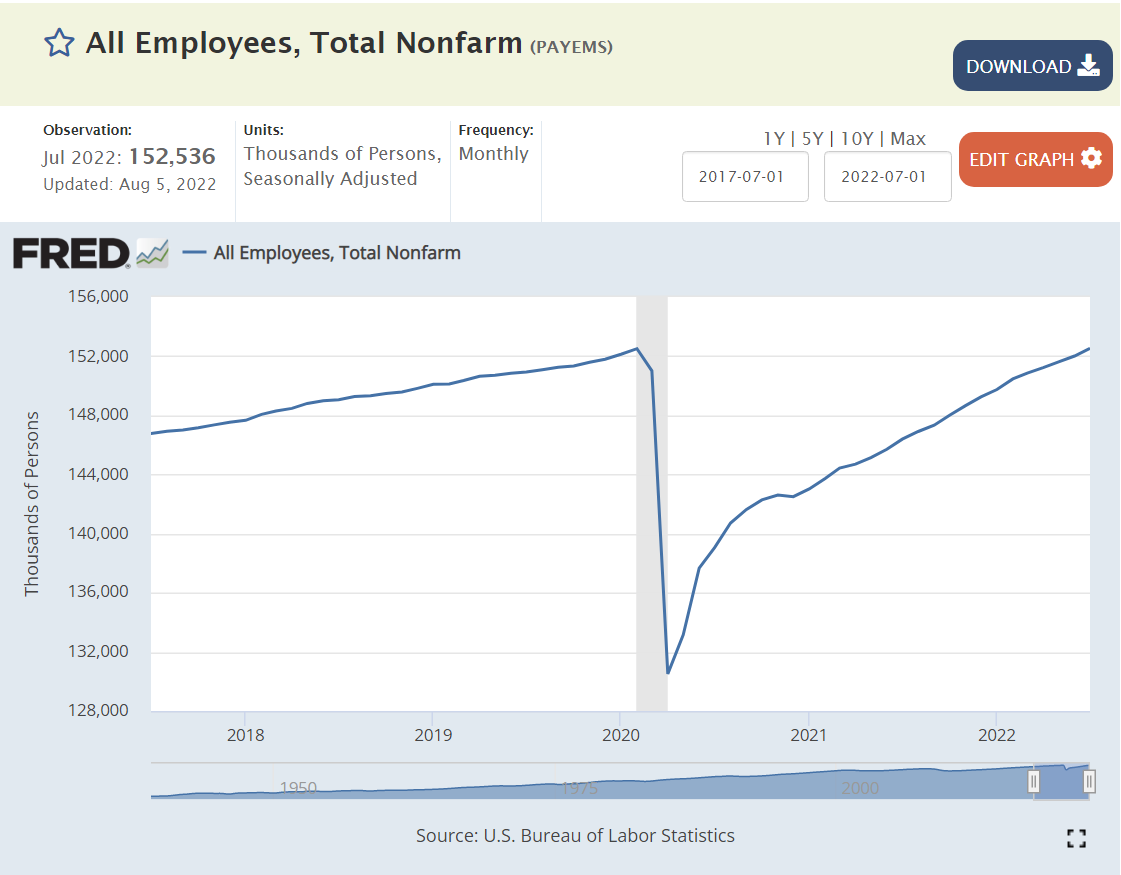
Despite the very many headwinds, the US economy is still able to add 2 million jobs annually during economic recovery periods. It added 9 million positions in 2021 and looks to add almost 5 million positions in 2022 despite the weakening business cycle. Even with a slowing economy, the US is likely to add 2 million new positions in 2023 and 2024.
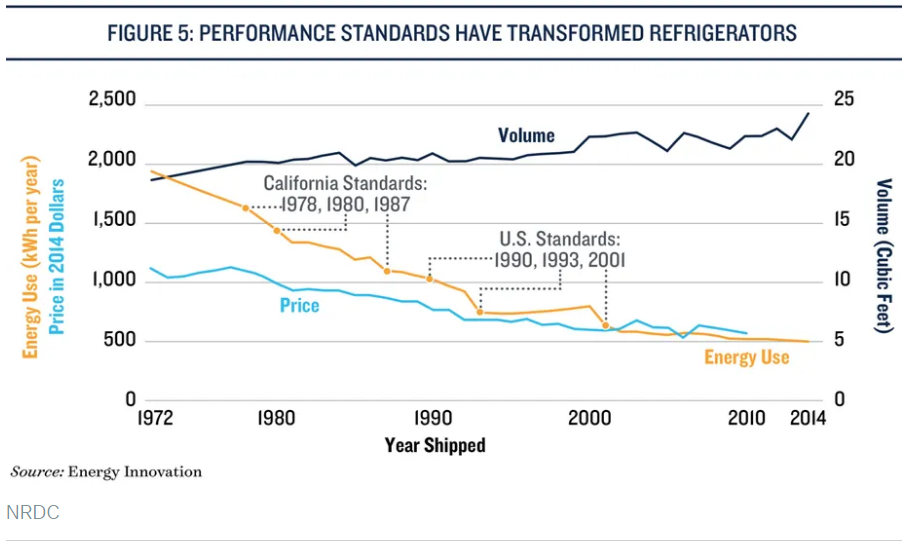
The US Dept of Labor does not publish a consumer price index specifically for refrigerators, but the category it belongs in showed essentially zero nominal inflation between 1994 and 2018. The real price decline shown in the first chart probably continued through 2018.
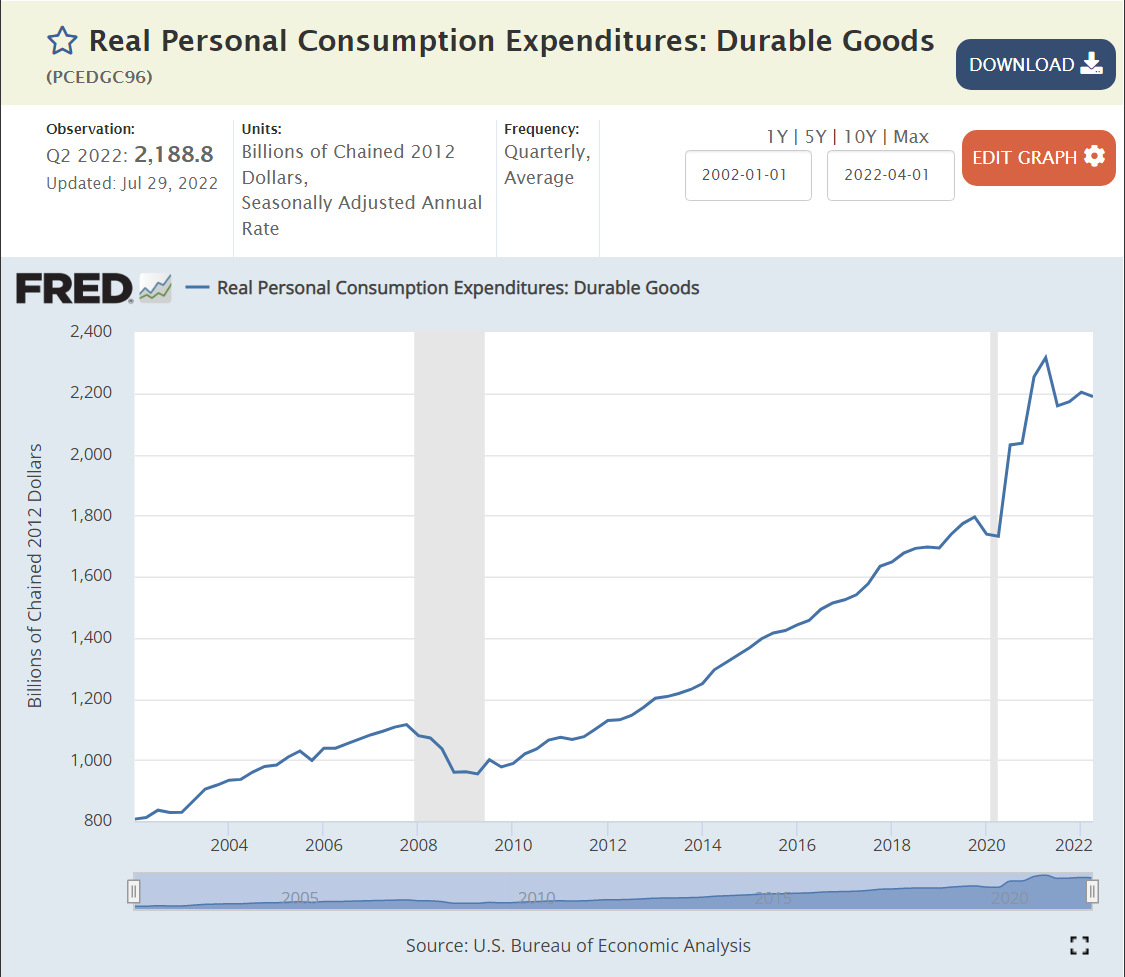
Refrigerators and appliance prices spiked by more than 10% in 2021 as consumer demand for durable goods grew 20% during the pandemic, supported by government transfer payments.
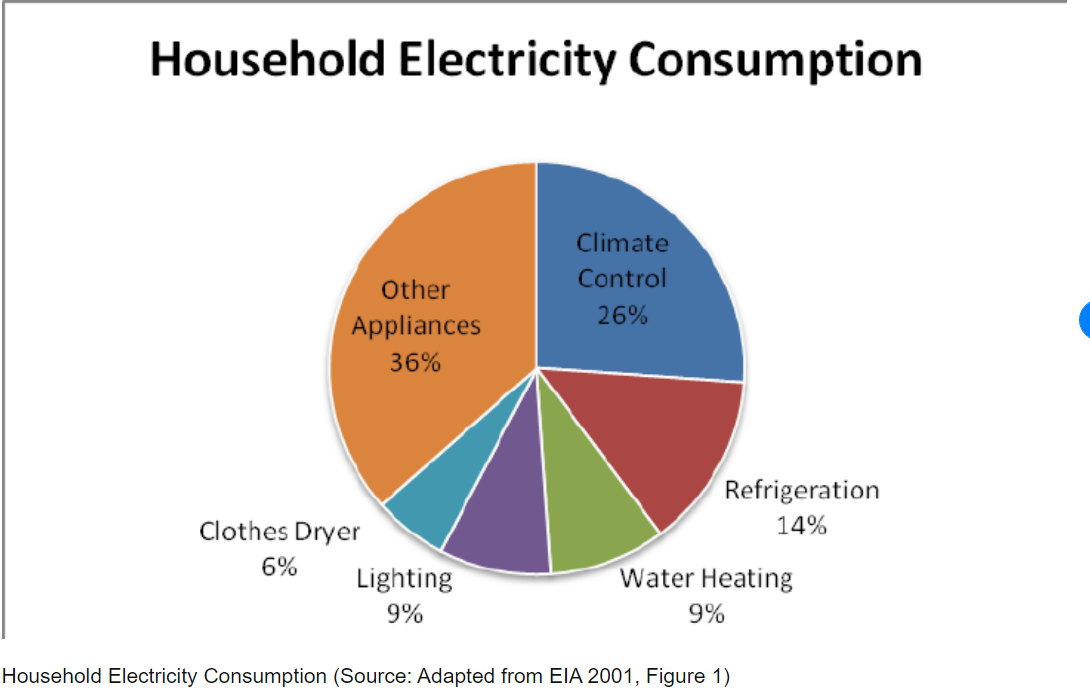
Refrigerators now account for just 7% of home electricity consumption, down from 14% in 2001.
Opinion writers differ on who gets credit for the improved price/performance results for refrigerators, but it seems clear that both energy standards and inventive firms share credit.
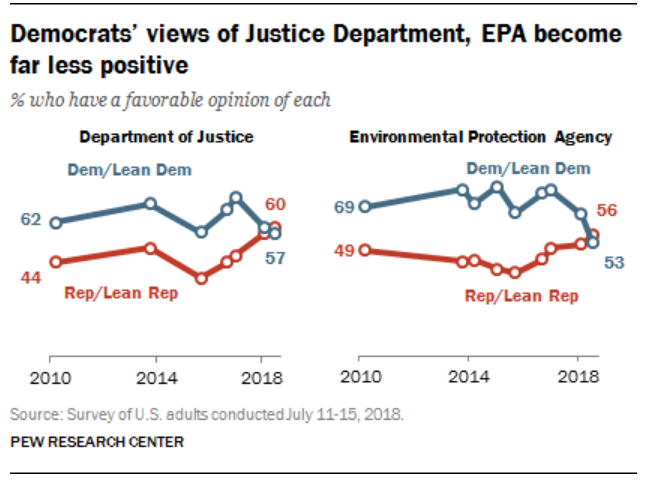
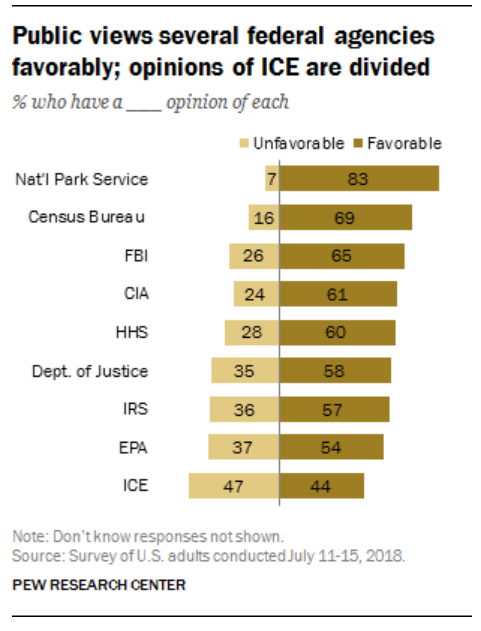
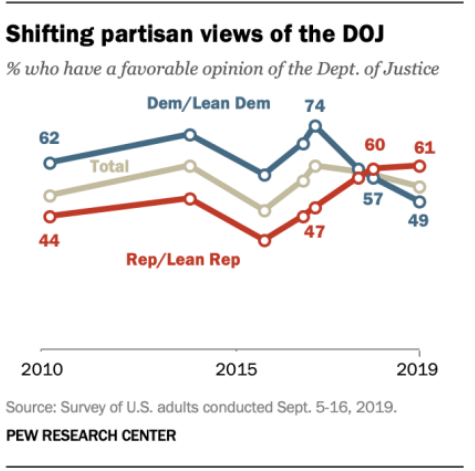
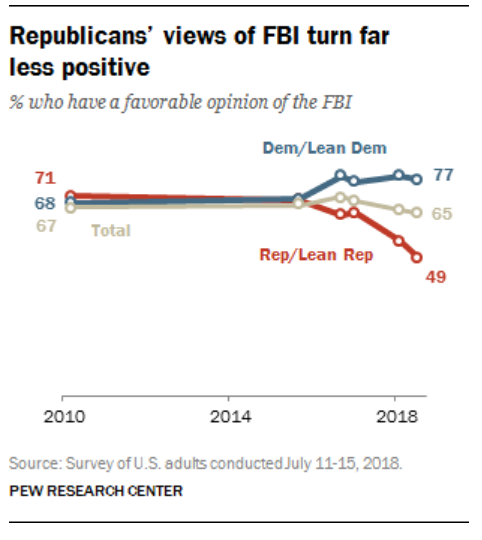
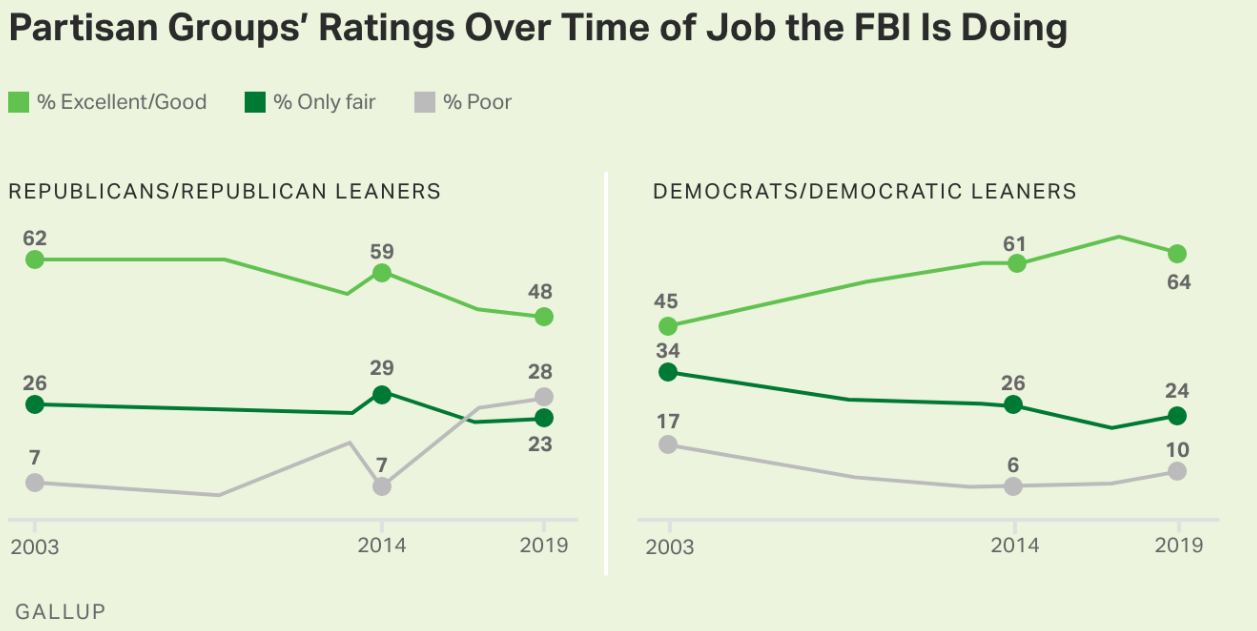
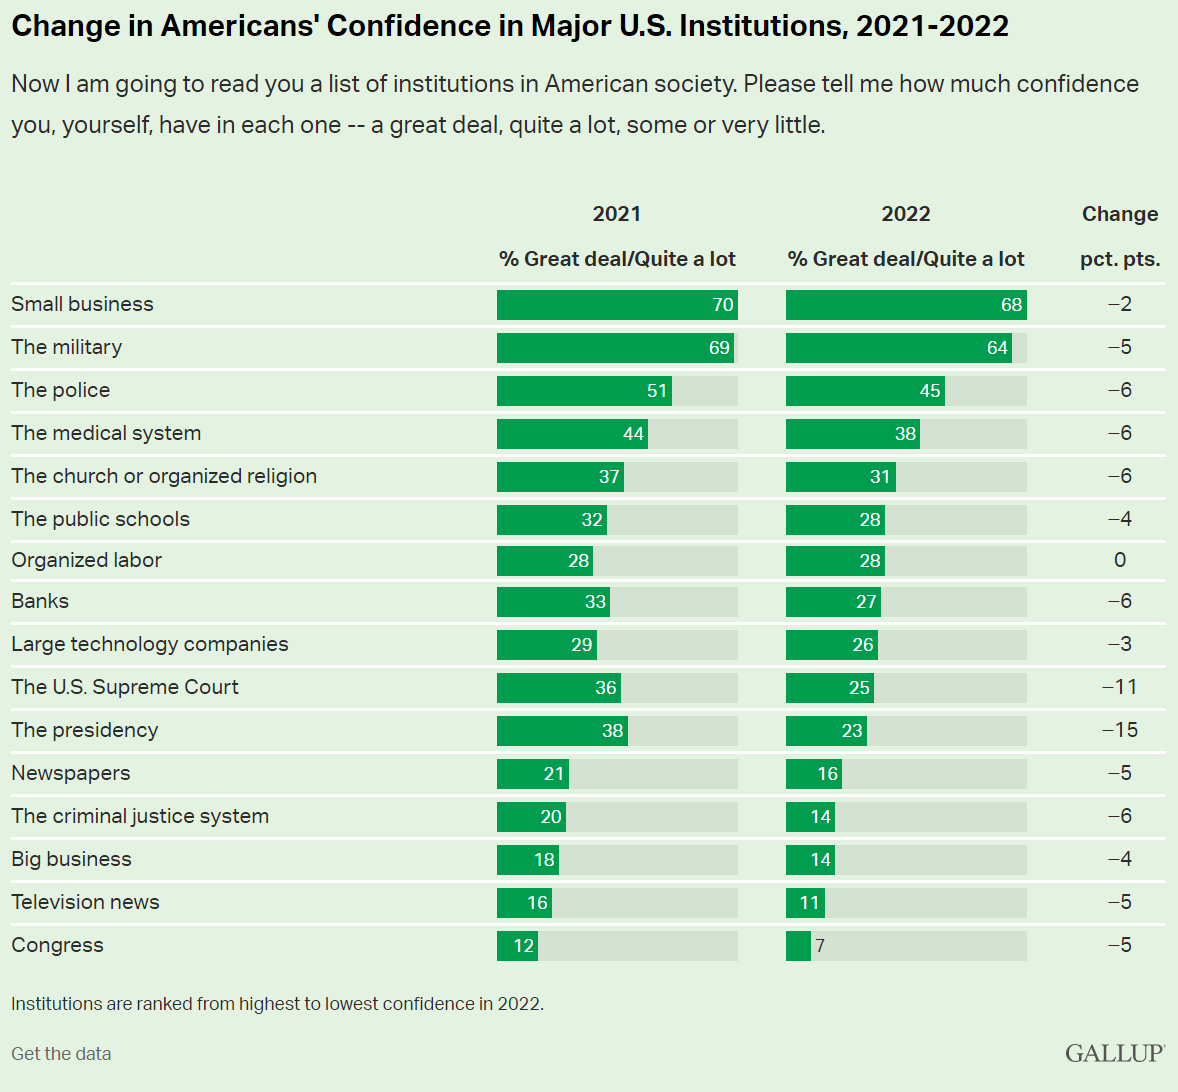
Historically, Republicans have been conservative, supporting the police, military, FBI, defense, “law and order”, criminal justice and “black and white” law enforcement. While the DOJ and some other federal agencies have been staffed by left-leaning coastal elites, the FBI has been staffed by more conservative leaning individuals.
538 has a similar article but refuses to link directly. Worth your time to query and copy.
“What Happens When Americans Don’t Trust Institutions?”
If only one-quarter of Americans trust in its basic institutions, how can we have democracy and capitalism and “western civilization”? If “everything is broken”, then we need a dictator or a revolution. Really? Really? Really?
I have to blame the 16 year-old me for some of this. In 1972, we were all opposed to “the man”, “the organization man”, “the establishment”, etc. We were children of the hard-won victory of democracy and capitalism against fascism and imperialism and communism. We believed in progress, science, growth and possibilities. We were skeptical about the Vietnam war, the military, McNamara and his whiz kids, General Curtis LeMay, big corporations, compromises, limitations, bureaucracy, bigness (small is beautiful), population growth, technology, etc. Many of us deeply believed in a romantic idealism or utopianism, making stodgy historical institutions so irrelevant.
Fast forward 50 years and I (we) possess a fundamentally conservative view, embracing the need/value of institutions and channeling our inner Edmund Burke to emphasize the value of the accumulated wisdom of society.
So, the overall decline in trust of American institutions is a real challenge. The decline in trust in the FBI is clearly (IMHO) a Trump driven result. This, too, is a real challenge to our democracy. Do we (I) really believe that the leadership and staff of the FBI have abandoned their democratic principles which we have lived and supported for almost 250 years? I don’t think so. But the decline in trust/belief in all institutions combined with the increasingly politically polarized view of individual institutions makes this a reasonable view for many of our fellow citizens. We have much, much work to do in order to preserve our institutions, government and society.
Presidential candidate Ronald Reagan skewered the incumbent Jimmy Carter in the 1980 presidential debate with this question and framing of economic issues.
We are economically better off today than we were in 2019, 2016, 2012 or 2008. As a nation, we need to recognize the strong economy that has been built across several 4-year periods.
Let’s focus on just 2 measures: unemployment and real gross domestic product (GDP).
The US encountered its worst or “tied for worst” economic downturn in almost a century in 2008-9 with the Great Recession.
The economic recovery was relatively slow, but the economic expansion continued for a RECORD 10 years! This was followed by the pandemic recession which drove unemployment up to 15% in a mere 3 months!! In 2 years, with a never before encountered global pandemic raging and evolving, the US unemployment rate dropped from 15% back to 3.6%!!! It has since levelled off at 3.6%, just shy of the 3.5% rate before the pandemic. This is an AMAZING outcome for the economy and our citizens
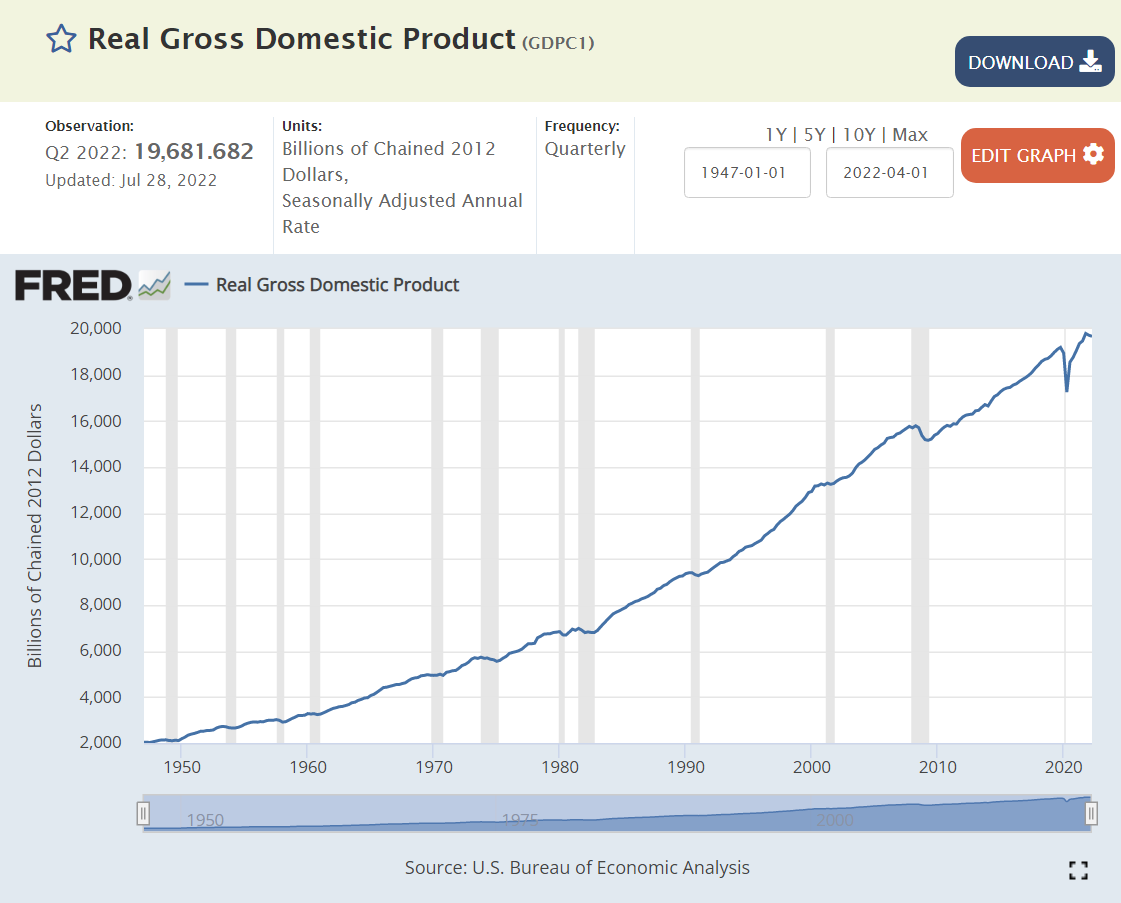
Since WWII (1947), the real, inflation adjusted, “no fooling”, GDP of the US has increased TEN-FOLD! We can honor the “greatest generation” and the country’s sacrifices to win WWII, but the economy in the 1940’s was less than 10% of the size that it is today. This is a true “order of magnitude” change. The economy has rotated from agriculture to manufacturing to services and trade.
The real economy is THREE TIMES as large as it was when Reagan was debating Carter in 1980.
It is 25% higher in 2022 than it was in 2008, despite two major recessions.
Unemployment measures the available labor capacity that is unused. The Depression saw extended periods of 20% unemployment. The post-war period enjoyed low 4% level unemployment through 1957. The next 7 years were above 5%, setting a new expectation of what the reasonable, long-term, natural, non-accelerating inflation rate of unemployment (NAIRU) was. The next 6 years of Vietnam and social welfare spending drove a 4% average unemployment rate which most economists believed was unsustainable and which eventually drove significant increases in inflation. The 1970 recession drove unemployment above 5% where it stayed for nearly 30 years, before finally starting with a 4 in 1997. Unemployment remained below 5% for 3 years, touching a 4% low before the millennium recession. Unemployment then averaged a sustainable 5%+ for the next 6 years, reaching a low of 4.5%.
So, when unemployment rocketed up to 10% in the Great Recession, no mainstream economist expected it to return to less than 4% soon, maybe never. Unemployment eventually reached 5.0% by the end of 2015. Professional economists were sure that it had reached its bottom. But Mr. Market, Dr. Copper and Senor Economy had news for the pundits. Consistently through the next 4 years, unemployment declined another 30% from 5.0% to 3.5% without triggering increased inflation.
The subsequent reduction of unemployment from 15% to 3.6% in 2 years is an incredible result reflecting a robust economy.
Next, let’s turn to a set of global comparisons to gauge if we are “better off”.
Just 12 Countries Account for 70% of Global GDP
US, China, Japan, Germany, UK, India, France, Italy, Canada, S Korea, Russia and Brazil provide the framework for evaluating global economic results today.
India, France, Italy and Brazil are saddled with 7% unemployment rates, double the US level. Canada and China encounter 5% unemployment. The UK, South Korea and Russia enjoy below 4% unemployment rates with the US. Japan and Germany glory in sub-3% rates. The 12 country average is 5.3%, almost 2 points above the US 3.6% rate.
The most recent 9.1% annualized US inflation rate is above the 7.7% average. Russia and Brazil are struggling with 10%+ inflation. Canada, Italy, India, UK and Germany face 6-7% inflation. France and South Korea encounter 5% inflation. Japan and China see just 2% inflation.
Combining the unemployment rate and inflation rates to create a “misery index”, the US scores 12.7%, just above the 12.2% average.
The US Remains the “Big Dog” in the Global Economy
At 24% of global GDP, it is first. China and Japan together add up to 24%. The remaining 9 large countries add up to just less than 24%. Being large provides the advantage of a larger domestic market that attracts investors, entrepreneurs, researchers, supplier, labor, traders, etc. On the other hand, continuing to grow in the same percentage terms through history or compared with smaller countries as the largest economy is a handicap. (This is a great graphic worth exploring for a few minutes)
US reports $63,200 per year. Germany, Canada, UK, Japan and France range from $39K – $46K, roughly two-thirds of the US level. Italy and South Korea check-in at $32K, about one-half of the US level. China and Russia earn $10K annually, while Brazil ($7K) and India ($2K) lag further behind.
US Gross Domestic Product Increased 8% from 2019 to 2021
GDP figures are not widely available for the first half of 2022 for countries, so we can use the pre-pandemic 2019 compared with the late pandemic 2021 to gauge recent economic performance.
The US GDP in 2021 was 8% higher than in record breaking 2019. It increased by $1.63 trillion in 2 years. Global GDP in 2021 was $90T. US GDP grew from $21.37 to 23.0 trillion.
China (factory to the world), in a period when demand for durable goods increased by 20% and nondurable goods by more than 10%, grew even faster, from $14.3 to 17.7 trillion, an increase of $3.4 trillion. I believe this is overstated somehow, given other data that indicates 6-7% annual growth in China each year, but it’s first place two-year ranking is clear.
The other 10 major economies combined grew from $26.4 to $27.7 trillion, an increase of $1.3 trillion, totaling less than the US $1.6 trillion growth. Their 5% combined growth rate trails the US 8% growth rate.
In percentage terms, the UK, India and Canada grew by 10% or more. Germany, France and South Korea grew by 8-9%. Russia and Italy grew by 5%. Japan and Brazil endured economic declines.
From the end of 2012 through July, 2022, almost 10 years, the US Standard & Poor’s stock index gained 175%. Fast growing India and previously undervalued Japan reported the same kind of amazing 10 year returns, compounding at more than 11% annually. Germany, France and Brazil grew by a decent 75%. Resource based Canadian and previously overvalued Chinese stocks gained a modest 50%. The UK, Italy and South Korea edged up by 25%, while Russia dropped by 25%.
Stock market returns reflect relative initial evaluations, changes in investor preferences, terms of trade and the underlying profitability/sustainability of each country’s economy. By this measure, the US has a very bright future.
US Leads Short-term Stock Market Returns
Comparing July, 2022 with a pre-pandemic base of December 31, 2019 shows a 25% gain for the US, Japan and India, even with the 20%ish stock market declines in the first half of 2022. Canada and South Korean markets are up a respectable 10%. China and France report a modest 5% gain. Germany and the UK show no gain. Italy, Russia and Brazil are in the 10% loss range. Even with strong gains from 2012 through 2019, the US stock market lead the world through the pandemic recovery period.
Summary: Very Solid US Economy
US inflation has returned to threatening levels and consumer confidence has fallen sharply while confidence in the incumbent president has continued to decline. The current “mood” is negative despite many positive economic factors such as the labor market and growth in GDP, housing and stock values. We are having journalistic, academic and partisan debates about hanging the “recession” label on the economy.
Big picture, the US economy is in great shape. It continues to grow, employ labor, increase wages, export, generate profits and build asset values. The economy worked through a “once in 100 years” global pandemic, with limited long-term economic damage.
There is a risk of a recession, even a moderately painful 3-5% downturn. There is a risk that inflation will remain elevated for more than 1 year, reducing the value of wages and assets. But these are normal business cycle issues, not the “end of the world”. The responses of consumers, investors, suppliers, businesses, bankers, central bankers, regulators and … politicians to the last two recessions were constructive and helpful. We have the ability to work through our current economic headwinds if we choose to do so.
I tried to find a “mainstream media” article that objectively and insightfully evaluates the state of the US economy as of the end of the second quarter without success. So, I’ll take a shot at it.
First, I want to highlight that “this time, it’s different”. The US and global economies are recovering from a global pandemic situation last seen more than 100 years ago. The global economy is more integrated than ever. Viruses spread faster than ever. Businesses and governments have more information and ability to change quickly than ever before. The economic contraction was sharp, far more severe than the Great Depression or the Great Recession. The health care experts were unable to immediately evaluate the threat or recommend public policies. Nonetheless, “they persisted” and the medical, travel and economic recovery was far quicker than ANYONE expected in March, 2020 or December, 2020 or September, 2021 or January, 2022.
Second, I apologize for the required details involved to evaluate the simple question, “are we in a recession?”. Unfortunately, there is some judgment involved, as we have to evaluate three factors. Is there a clear downturn versus the trend rate? Is the downturn of significant length? Is this a widespread downturn, effecting most sectors of the economy?
At the aggregate level, we clearly have a peak. Do we have an extended downturn? Not yet, based on the total. The rapid recovery from the second quarter 2020 bottom could not be sustained. A significant slow-down in the growth rate was expected. Typical annual real GDP growth in recent years has been only 2%, so the difference between “extended expansion” and “recession” is thin.
Components
Macroeconomic theory focuses on aggregate demand and aggregate supply. Real, inflation adjusted, gross domestic product (GDP) is a measure of the productive output of a nation. The demand side is split into consumption, investment, government and net exports. I’ll go one level deeper, reviewing 9 components of GDP.
The business cycle is influenced by the relative sizes of the components of GDP and their relative variability from quarter to quarter and typical changes as the business cycle moves from expansion to decline to recovery.
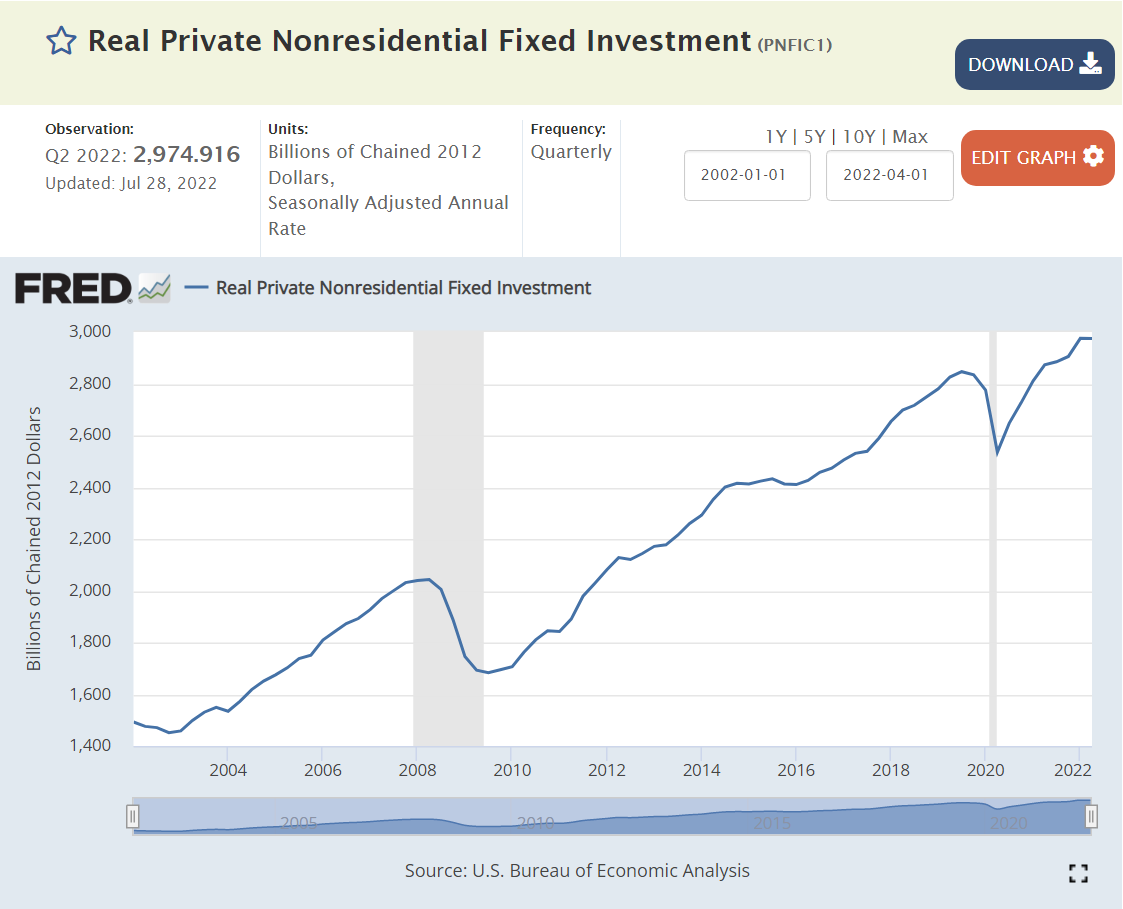
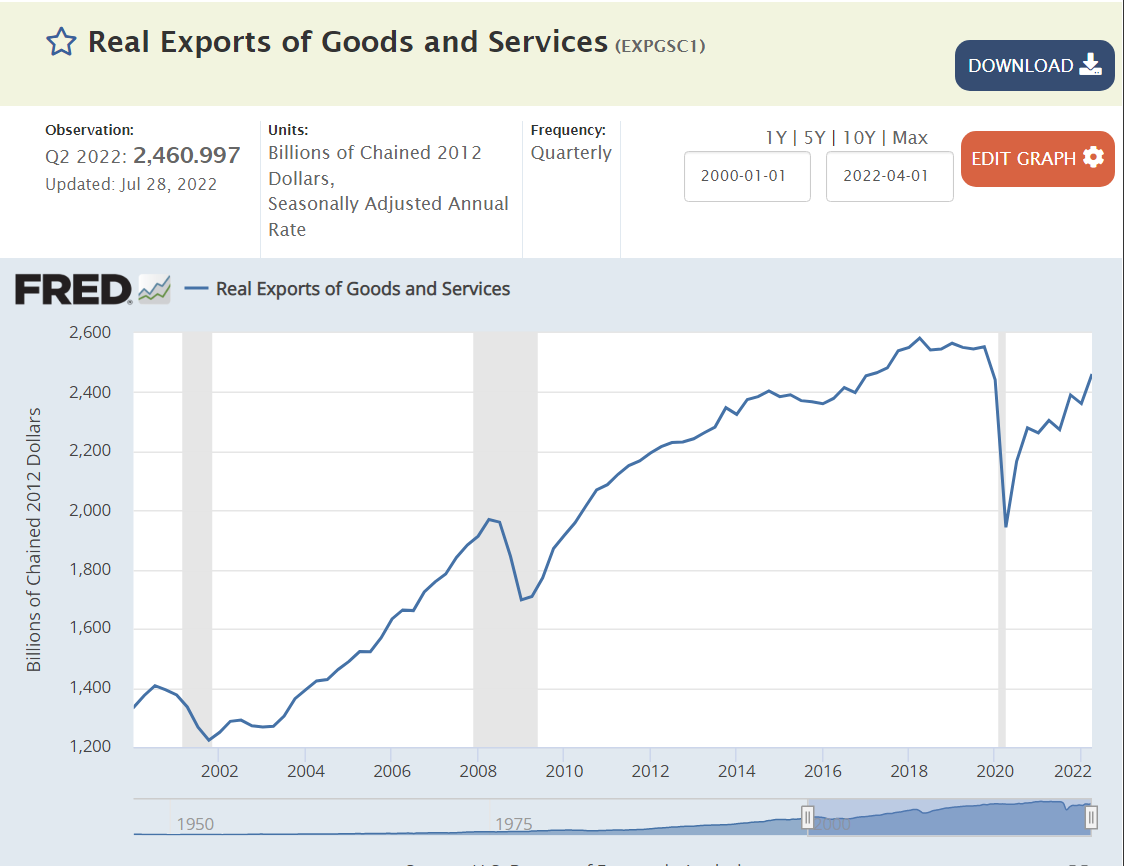
From most to least correlated with the business cycle, with their current percentage share of GDP (sums to more than 100 because imports are a negative factor and changes in private investment can be negative), the 9 components are: Change in private inventories (1%), Residential Investment/Housing (5%), Business Investment (14%), Durable Goods Consumption (9%), Imports (16%), Non-durable Goods (food, energy) (15%), Services (45%) !!!!, Exports (8%) and Government (17%).
Overall, I see 4 sectors as “maybe” trending to a recession and 5 sectors currently at “no”. Unfortunately, the two most sensitive, Housing and Business Inventories, are in the “maybe” category, along with non-durable goods consumption and government consumption.
It is critical to look at the longer-term trends and context to evaluate short-term changes. There is significant month-to-month and quarter-to-quarter variability in the final numbers for GDP and especially for the initial estimates, like those we just saw for the second quarter of 2022. Significant revisions are made for 6 months, which is why the NBER committee which officially declares recessions is typically waiting longer to make a final call than everyone desires. Hence, I won’t usually share a long-term graph, a short-term graph, annual percentage changes and quarterly percentage changes annualized for each component. The media tends to focus on the preliminary quarterly percentage change annualized as the “gospel”. This is unwise. Let us begin to review the 9 main components.
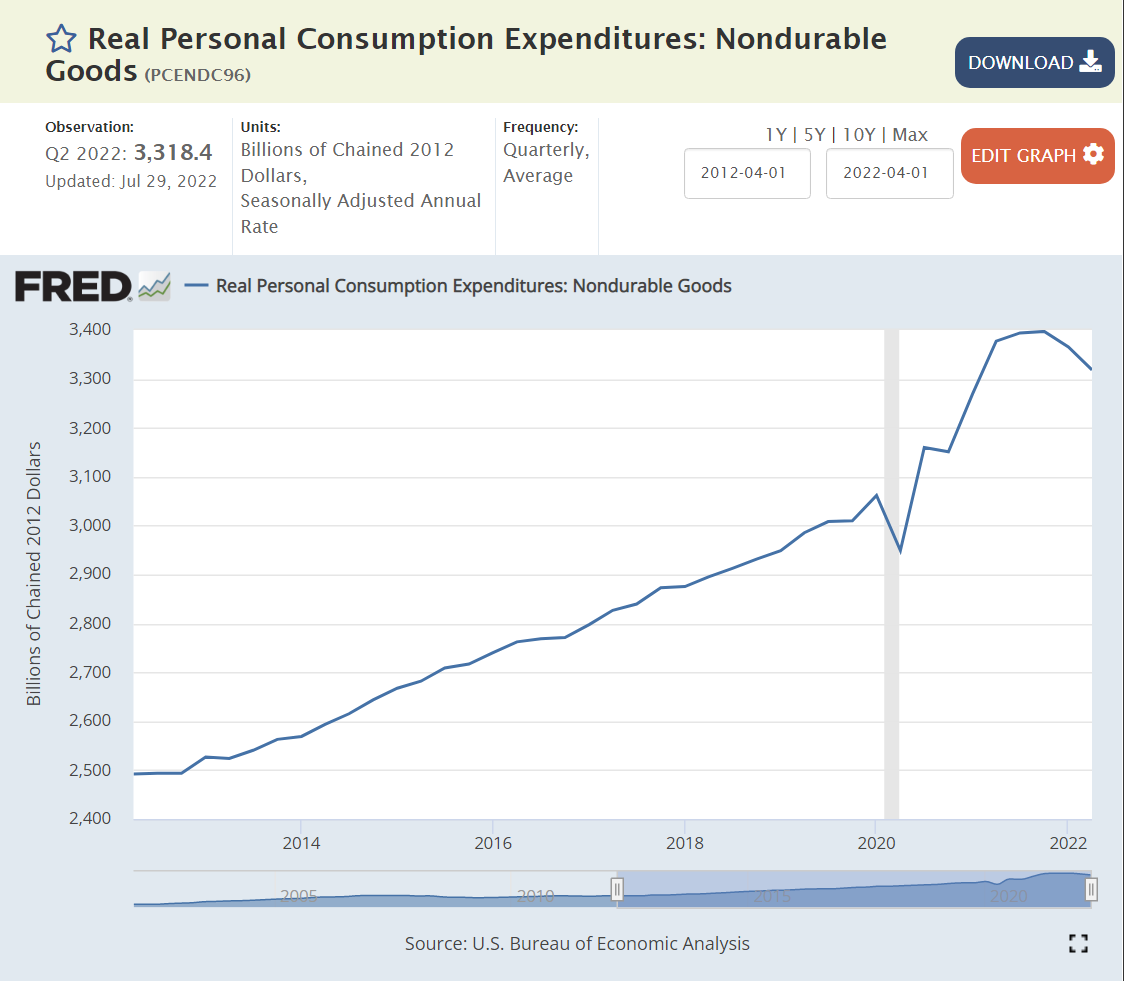
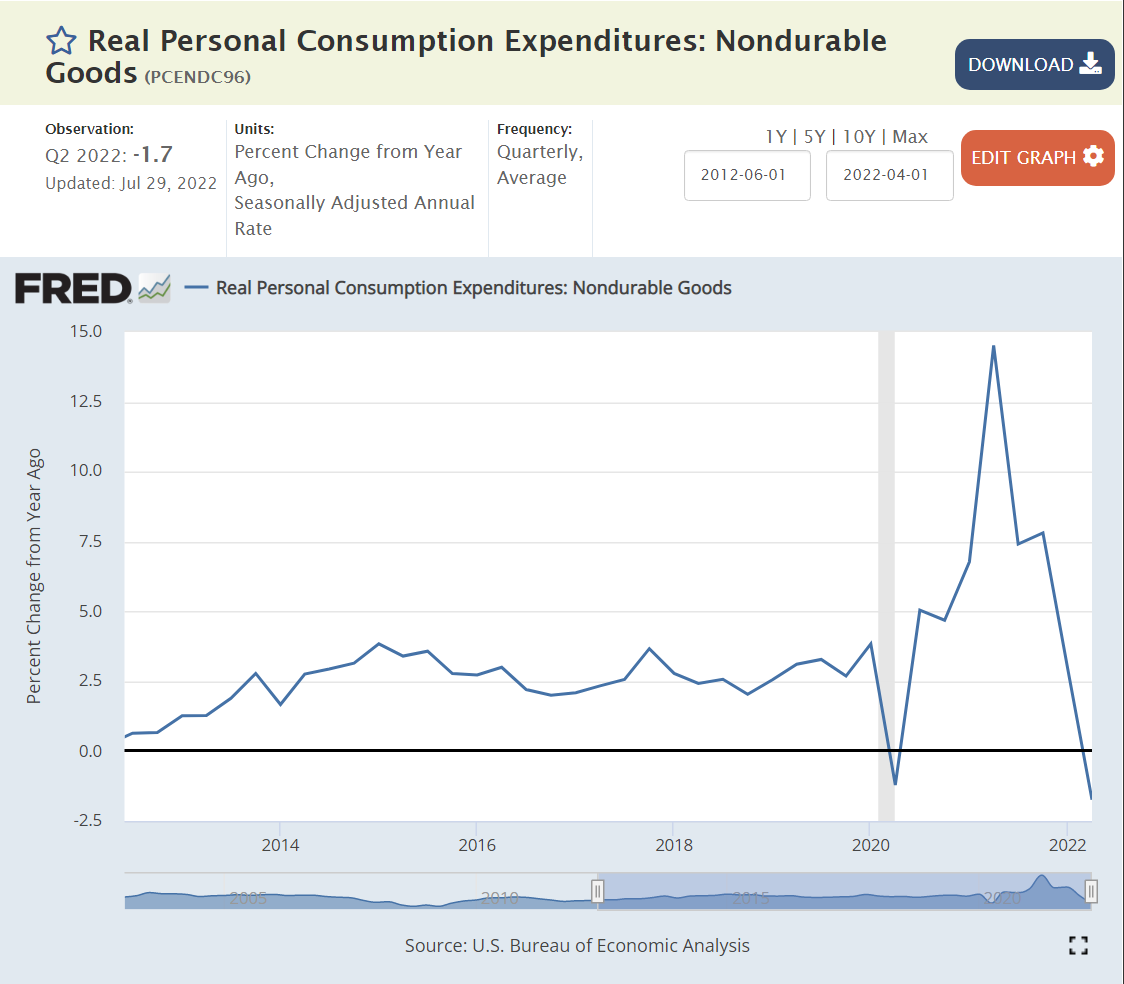
Durable goods demand spiked by an incredible 20-30% during the pandemic, fueled by government transfers and fewer opportunities to consume services. Demand for durable goods has flattened at this 20% higher level, it has not declined. In my view, this sector is not signaling recession.
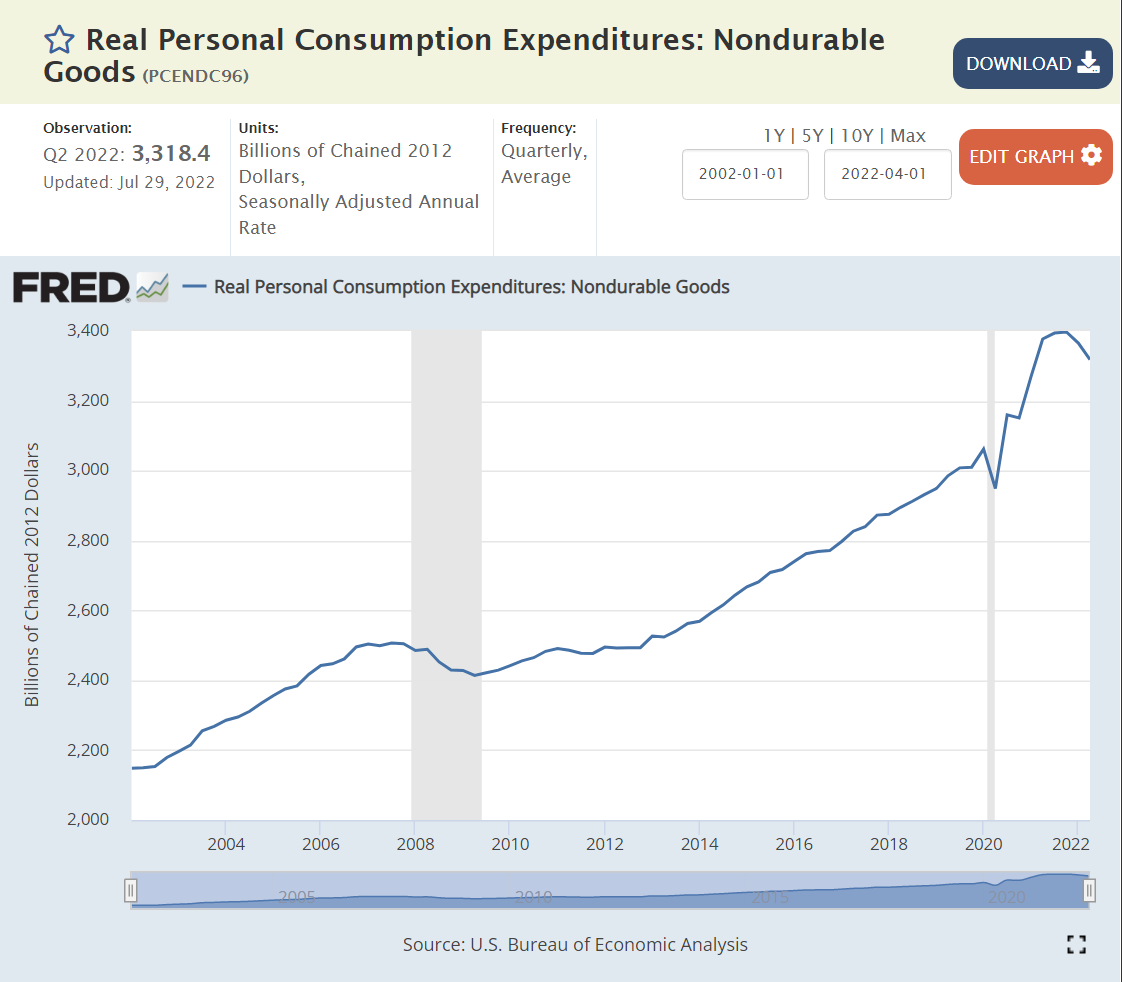
Non-durable goods consumption jumped by a real 12% during the pandemic and has essentially remained at this elevated level. We have two quarters at slightly lower consumption levels, so I rate this as “maybe” moving to a recession. Focus on the “big picture”. Both durable and non-durable goods consumption increased by historic percentages during the pandemic period and have remained at that elevated level 2 years later. It is not surprising that this demand has flattened or fallen off a bit. The surprising feature is the willingness of the American consumer to voluntarily spend much more money on “things” during the pandemic and maintain that level of spending as service opportunities returned, government transfers ended, and savings were drawn down.
The very large (44% of GDP) services sector was slower to recover from the pandemic, but demand for services remains quite strong, even though the percentage growth rate is lower than during the initial recovery period.
New housing investment grew by 50% between 2012 and 2016 and then remained at that level for the next 4 years before the pandemic. Long-run supply and demand factors indicate a “need” for more housing construction in the US to make up for the “missing” construction from 2008-2016. New housing construction did not decline with the pandemic, it increased by 15% in real terms! As with durable and nondurable goods consumption/production, this would not have been predicted in March, 2020 by anyone. Residential construction has levelled off 15% above 2019, equal to 2007 before the Great Recession. The increased mortgage interest rates indicate that demand will soften and this sector will decline somewhat in the second half of 2022, so this is a “maybe”. The long-term shortage of housing supply provides a floor for this sector.
“Supply chain issues” have restricted the accumulation of business inventories since the pandemic began. The unexpected spike in demand for durable and nondurable goods and residential construction lead to shortages. Worries about supply chain resiliency have led to higher targeted business inventory levels. Retailers have overstocked some product categories as the recovery has slowed and are being forced to discount prices to move these goods. Overall, this is a slight “maybe” recession indicator. I think that businesses would like to have 20% higher inventories overall.
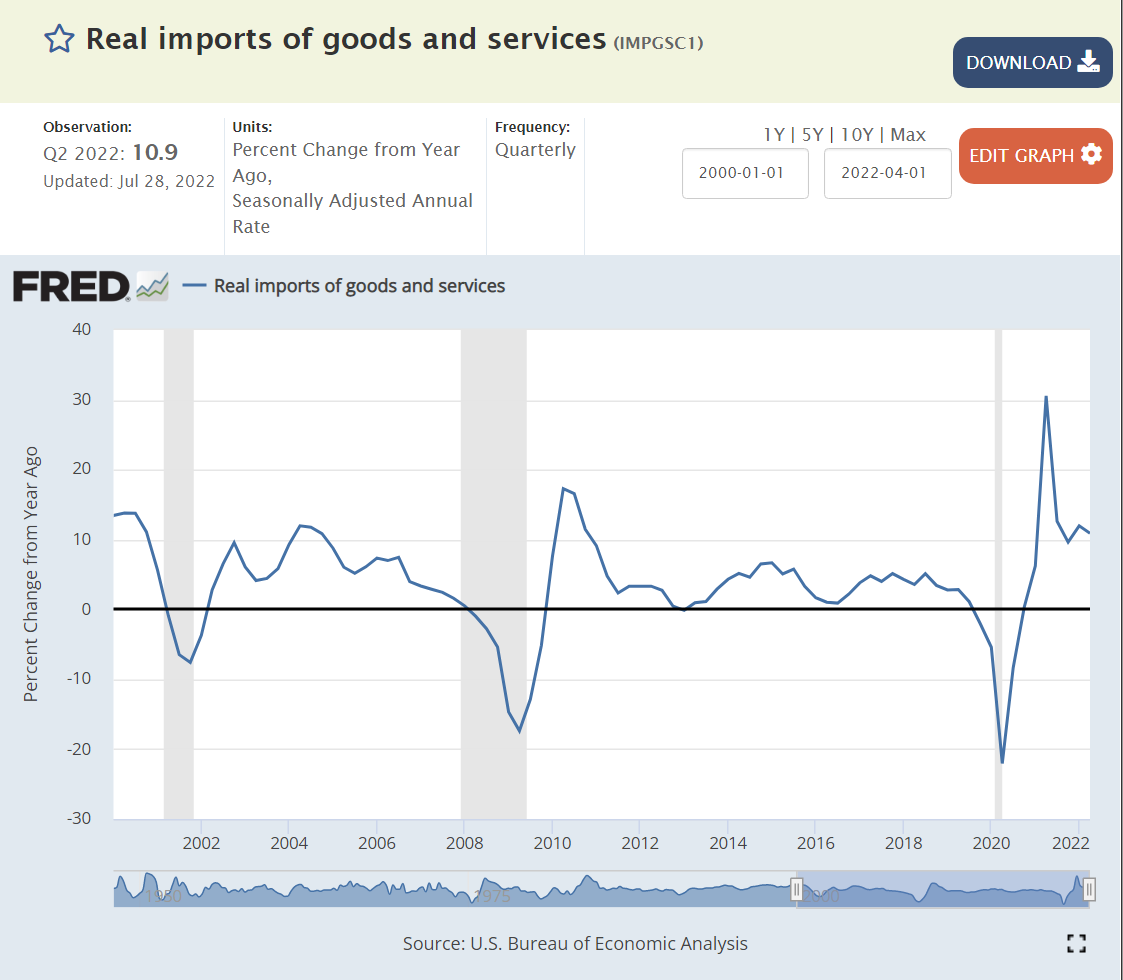
Although imports act as a reduction in the calculation of GDP, they tend to decline when the US economy declines. Import demand remains high, not indicating a recession.
Government (17%, 9/9 Volatile)
A majority of government spending is accounted for as a simple transfer, not part of the annual production of goods and services.
Government production activity grew quite significantly from 2014 to 2020. It has since declined by less than 1%. I rate this as a “maybe” indicator of recession, even though government activity is typically a countercyclical indicator, rising when recession arrives.
Summary
Services (45%), Business Investment (14%), Exports (12%), Imports (16%) and Durable Goods (9%) are NOT in recession. Housing (5%) and Non-durable Goods (15%) point towards recession, while Government (17%) and Business Inventories (1%) show warning signs. If I were a member of the NBER board, I would not designate a recession in the first half of 2022 as of today.
For the second half of 2022, a recession is possible. The Fed raising interest rates is already affecting the housing industry. But businesses continue to report solid to record profits. The stock market has declined by a bear market 20% but may or may not have found a bottom. The global risks from Russia’s attacks on Ukraine and China’s Covid lockdown strategy remain. Consumer confidence is weak, especially in a partisan world. Business confidence is weaker than in recent months, but most measures remain marginally positive. The labor market is at its strongest position in 50 years, supporting consumer demand. Higher than expected inflation has slowed consumer spending, but not to recession levels. Consumer savings and debt levels remain positive. Business debt levels have increased, but most businesses locked in low debt interest rates during 2020-22.
Why So Positive?
Governments operate with expansionary fiscal policy, ensuring that aggregate demand is adequate. There is a risk of too much stimulus and “modern monetary theory” excesses, but so far this is not a risk in the major economies.
Central banks are more effective. They provide credit in downturns, increase interest rates when required, coordinate with each other and pressure banks to hold adequate capital.
Governments and central banks take proactive steps to avoid currency crises,
After the Great Recession, lending in the US housing market is more reasonable.
Businesses have worked through many challenges in the last 15 years and are well positioned to prosper.
The overall economy is increasingly based on services more than manufacturing, mining and agriculture. The operations leverage of manufacturing facilities is a smaller factor in the world economy.
Labor power is lower. Cooperation with management is stronger.
Demand for labor is high. US has record open jobs and voluntary quits. The effective minimum wage has increased from $8-10 per hour to $12-15 per hour without major business disruptions.
Trade is lightly restricted.
Global economy is multipolar, relying on US, EU, Japan, China, India, Middle East, etc.
Technological progress continues. Better goods and services. Better processes, trade, transportation, markets, communication and insights.
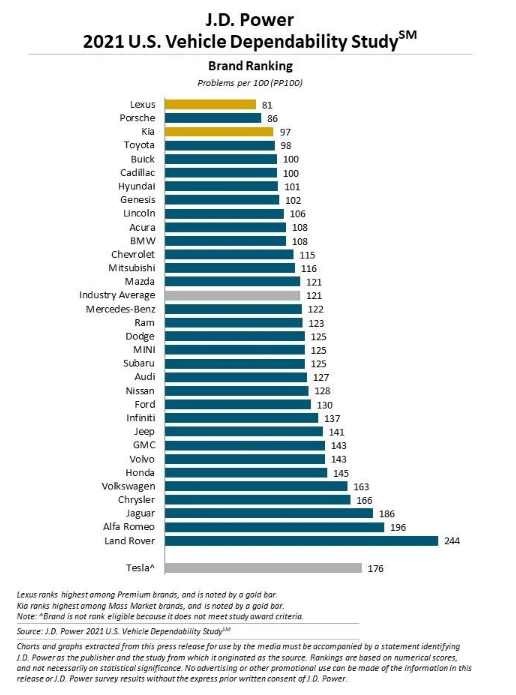
Ongoing defects dropped by 60% from 2001 to 2011 and then dropped by another 20% from 2011 to 2021. The compounded reduction is 68%, a little more than two-thirds of the defects disappearing in 20 years.
JD Powers started its initial quality surveys in 1987 and its Vehicle Dependability surveys in 1990. The summary results are not easily found on the internet. The Consumer Reports defect rates are similarly restricted to paying customers.
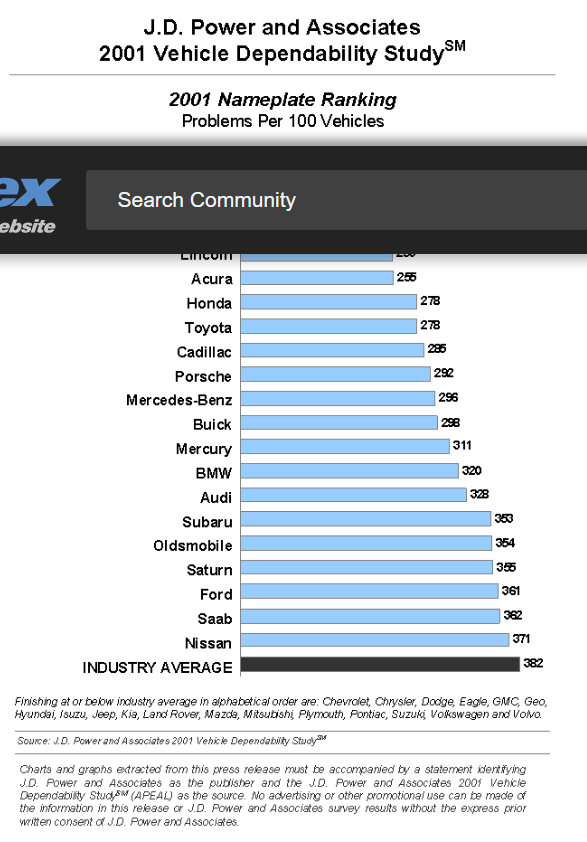
In the 1980’s, Toyota and Honda offered significantly higher vehicle quality. Other manufacturers essentially “caught up” in the next 20 years. A snapshot from 1985 illustrates the gap that was closed by 2000-5, before the Vehicle Dependability improvements shown above.
The very disappointing 2022 results are inconsistent with the downward defect trend of the last 20 years, reflecting the pandemic production, supply chain sourcing and vehicle prep problems of the last 2 years.
My “little” hometown of Fairport Harbor is part of Lake County, Ohio which once was the most sensitive county to changing presidential voting patterns after 1952. Lake County is a suburban or exurban county in the Greater Cleveland area. The population doubled from 29K to 60K between 1920 and 1944 while it retained a mixture of agricultural and manufacturing employment. The county grew very rapidly on its western side as Cleveland residents moved away from the city, reaching 149K by 1960. Another 50,000 new residents arrived by 1972, pushing the total above 200K. Growth slowed with the decline of the Cleveland metro area, but the population reached 228K by 2000. The population has been relatively fixed for the last 20 years.
From 1952 through 2008, Lake County voted with the national presidential election winner in all but one of the 15 elections. In 1992, Lake County provided George Bush, Sr with 38% of the vote, the same as he won nationally, but only provided Bill Clinton with 36% of the vote, offering a very high 26% of the vote to “protest candidate” Ross Perot, far above his national 19% share.
From 1920 to 1932, Lake County voted 70% Republican, a solid 16% above the national average. Lake County took pride in its role as part of the Connecticut “New Western Reserve” and its road, rail and ship based east to west transportation role at this time. The county was also the proud home of Republican President Garfield.
While the country gave FDR 57% of the vote in 1932, Lake County offered just 35%, preferring to re-elect President Hoover.
From 1936 to 1956, the county continued to lean Republican, offering an average of 6% more votes to the Republican head of the ticket than the average state. The county supported FDR in 1936 but opposed him in 1940 and 1944 and opposed Truman in 1948.
The county started its remarkable 14/15 presidential winners string in 1952, supporting Eisenhower by 5 points more than the country at large and repeating this support in 1956.
The county surprisingly supported Kennedy over Nixon 51/49 in 1960, dropping those 5 extra points of Republican support. Kennedy visited the small county during the election. This may have helped shift enough marginal voters.
From 1960 to 2004, the county’s Republican vote percentage matched the national average.
Democrats earned a record high 62% vote share for LBJ in 1964, with Goldwater falling to a stunning 38% Republican low. Lake County “faced east”, looking to the New England/New York and Midwest Republicans (Taft) for inspiration. Goldwater’s Texas, Arizona, California “western” message gained little local traction.
The 1968 election was completely different. Nixon edged Humphrey by 0.8%, with Wallace receiving 14%, as he did nationally. I was just 12 years old, but as a newspaper carrier for 3 years, I had read many editorials from the Cleveland Press, Cleveland Plain Dealer, Lake County News-Herald and Painesville Telegraph. The race riots of 1966-67, Vietnam protests and counterculture demonstrations and activities were beyond the lived experience of my neighbors. Nixon and Agnew leveraged a “patriotic” message to win voters in “my little town”. George Wallace earned a remarkable 14% as a modern populist, promising simple solutions to all of the nation’s problems. I don’t believe that Wallace’s “racist” message was a significant part of his appeal in this heartland. He was an early version of the right-side “anti-establishment” candidate.
In 1972, Nixon cruised to victory by 61/38 against a weak McGovern candidacy. Lake County agreed: 59/38. The “Kent State Riots” were part of this vote. Governor Rhodes was very popular in Ohio, winning 3 terms.
In 1976, Jimmy Carter sold Lake County on a moderate Democratic platform and his promise to “never lie”, winning 51/46, about the same as the national 50/48.
In the same year, the county’s largest employer, Diamond Shamrock, announced that it was permanently closing its chemical plant that had employed as many as 5,000 workers historically.
Reagan solidly won Lake County and the country by 50/41 and 59/41 in 1980 and 1984. His positive, traditional, patriotic, common-sense, reassuring message was well-received in a county and metropolitan region that was very hard hit by the start of a long-term downturn in manufacturing employment and regional population and economic growth.
George W. Bush was a little more popular in Lake County than the country as a whole, earning a 57/42 win, better than the national 53/46. Bush, Sr.’s WWII pedigree, executive experience and countenance played well in Lake County.
The 1992 election, pitting Bush, Sr.’s continuity, generation, broken tax promise, moderate social and economic views against Clinton’s contrasting policies was a divisive election, the true beginning of our polarized red versus blue state situation today.
In 1996, Bush’s support dropped from 57% to just 38%, while the national vote fell from 53% to 38%. Bush beat Clinton in Lake County 38% to 36%, the one non-match in the 15 elections.
Lake County was enamored with Ross Perot, offering him 26% of the vote in 1992 versus his 19-point national haul.
I worked for Ross Perot’s EDS in the 1980’s, as a headquarters financial analyst and project manager, producing the kinds of “charts and graphs” he loved to use in debates and press conferences. Ross was the most “what you see is what you get politician” I have ever seen. He believed that there are pragmatic, straightforward answers to any problem, and had lived a life demonstrating that this was true in the IT business, inventing the outsourced IT model and selling it to government agencies and corporations, just as he had sold mainframe computers in record volumes for IBM.
Ross was an anti-politician, a nationalist, a leader, a persuader, a man of integrity, a team player, a Texan, an outsider and very customer focused. Even with his significant campaign flaws, he was able to many attract voters who wanted to vote “none of the above”. I don’t believe his appeal was one of subtle racism, anti-immigration or historical pandering to a simpler, more culturally conservative time. Ross believed in progress, science and business.
Perot attracted 14% of Lake County voters in the next election, almost double the 8% national tally.
Clinton edged Dole 44/42 in Lake County in 1996, significantly behind his 49/41 national victory. In essence, this was a “none of the above” election for many in Lake County.
Lake County was an optimistic, fast-growing growing county for many years, tripling its population from 50,000 in 1940 to 149,000 in 1960 as Cuyahoga County grew, freeways opened, and people moved further from the central city. The county added another 50,000 people by 1972 as regional shopping malls such as the Great Lakes Mall opened by the Youngstown DeBartolo’s provided new attractions at the edge of the metro area. Growth slowed significantly after that, with the county adding just 20,000 people in the next 20 years through 1992 and another 14,000 people in the next 20 years. This change in the local environment from boom town to slow growth aggravated concerns about the country’s direction.
In 2000, George HW Bush, Jr. was able to capitalize on his message of “compassionate conservatism”, winning Lake County by 50/45, better than his narrow 48/49 popular vote loss. Even with the 9/11 patriotism bump, Lake County and the nation only narrowly re-elected Bush, Jr. by 51/48.
Obama’s centrist “hope and change” message attracted a few more Lake Countian’s to the Democratic ticket in 2004, earning a narrow 49.5% to 48.6% win, much tighter than the national 53/46 win.
The tables were turned in 2012, with Romney beating Obama by the same 49.5% to 48.6% result, in contrast with Obama’s 51/47-point victory. The 14/15 election match was broken. Lake County’s Republican share was 3 points higher than the nation this year, but its average Republican tilt for the last 16 elections was less than 1%.
Trump’s 2016 nationalist, populist, anti-immigrant, anti-globalization message played well in Lake County. He earned 5 points more than Romney, earning a solid 55/40 win, far ahead of his 46/48-point popular vote loss to Hillary Clinton. As with other blue collar, middle class, rust belt, Midwest states that had historically supported the Democrats, Lake County voted “no”, offering just 40% to Clinton.
2020 was very similar to 2016 in Lake County. Trump beat Biden 56/43 in Lake County, discounting Biden’s small-town Pennsylvania roots claims and centrist messages. Biden increased the Democrats’ national popular vote margin to 51/47.
It’s difficult to reconcile the 20-point swing from LBJ’s 1964 62/38 victory with Trump’s 56/43 advantage in 2020. Goldwater was a weak Republican candidate, promoting a conservative “philosophy” and radical “for the time” policies. Biden is a lifetime Washington politician, subject to obvious criticisms.
From Wallace to Anderson to Perot to Trump, a significant share of independent Lake County voters has been attracted to “outsider” national political candidates. The shared national experience of the Depression and WWII and bipartisan support for national leaders like FDR, Eisenhower, Kennedy and Reagan is nearly gone.
Since Reagan’s 1980 50/41 victory, Lake County has averaged a 51/43 Republican advantage. Based on Trump’s recent higher results (55-56%), Lake County looks to be a solid Red county today, leaving behind it’s Purple history.
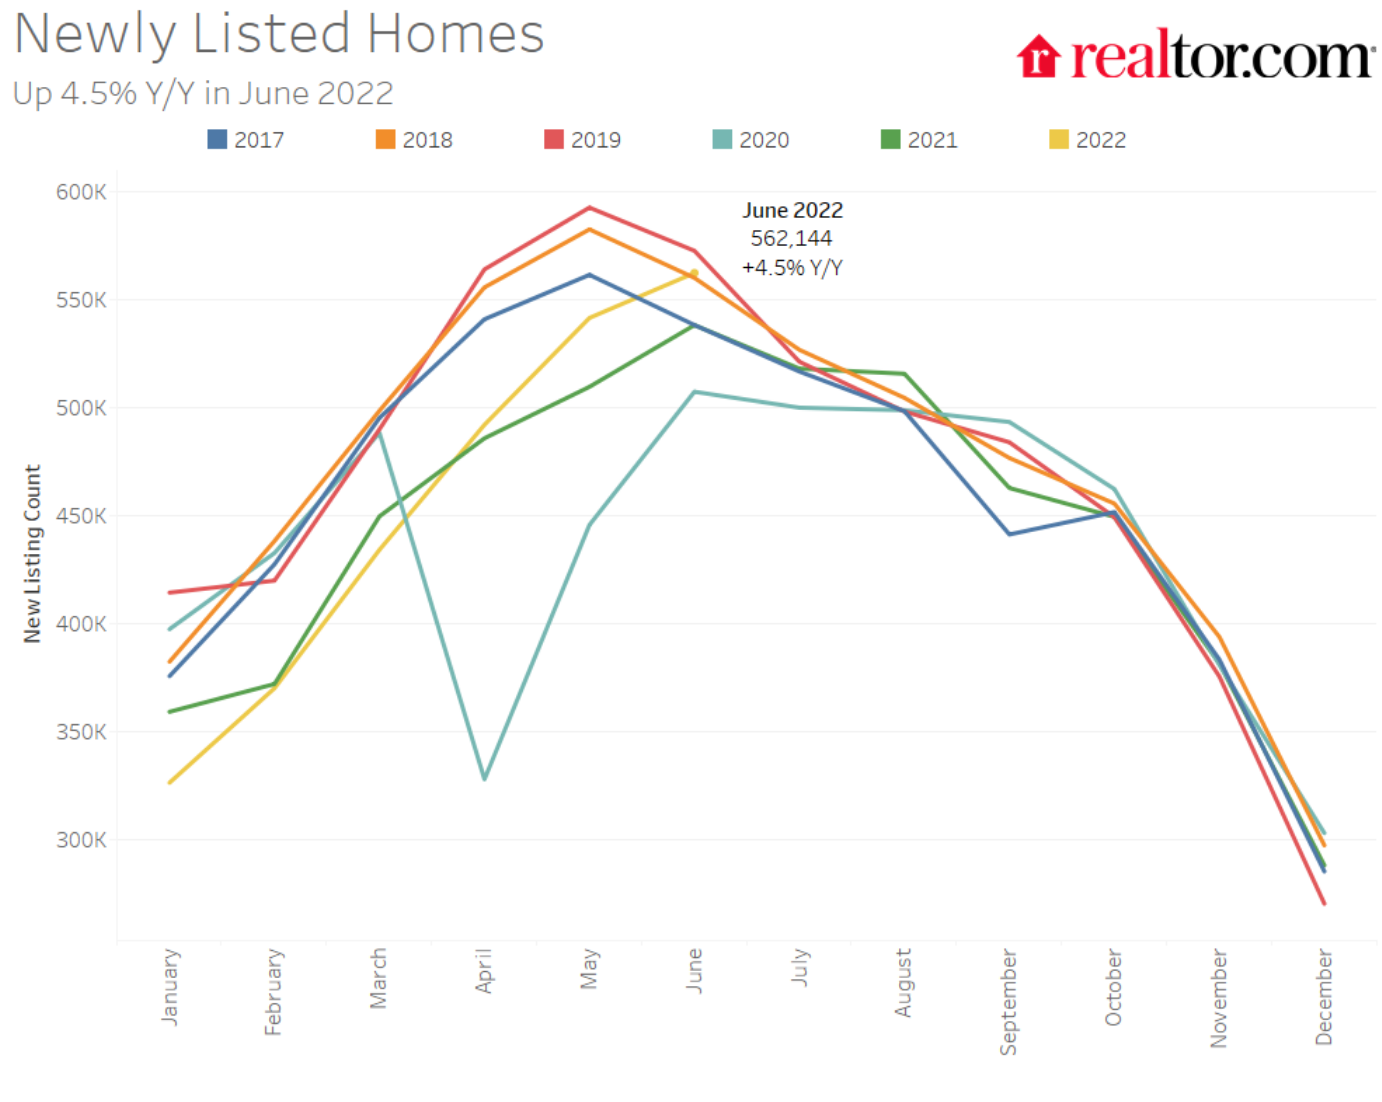
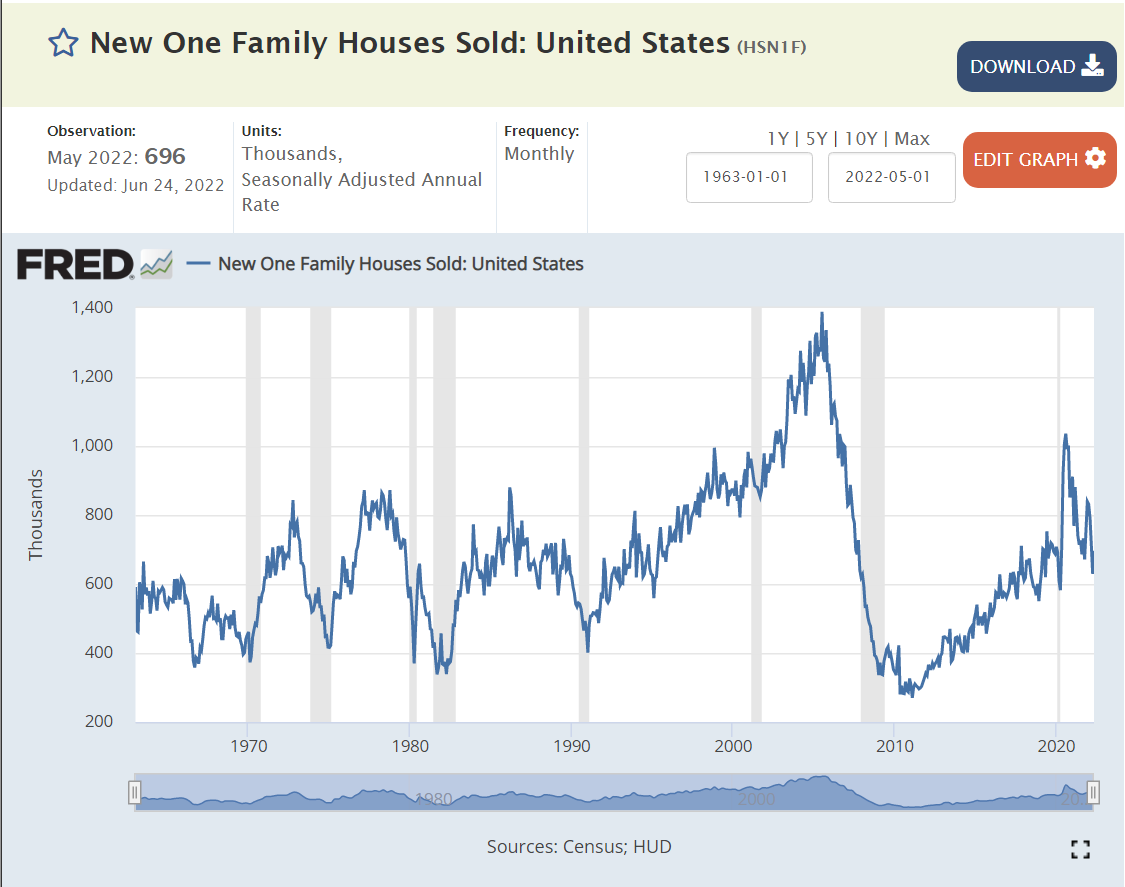
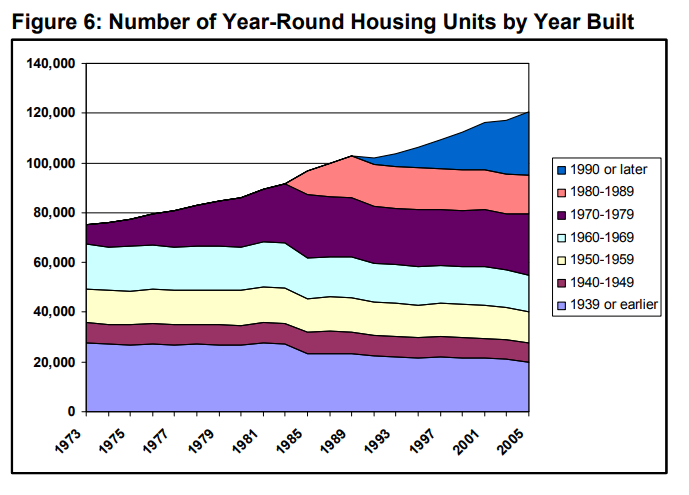
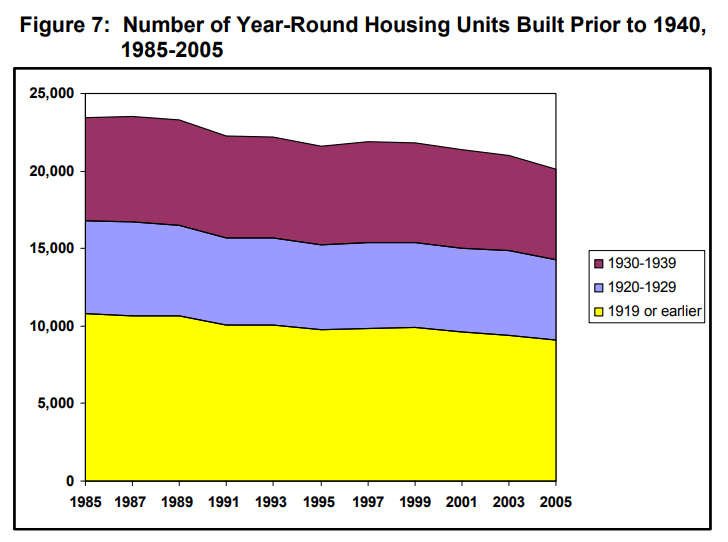
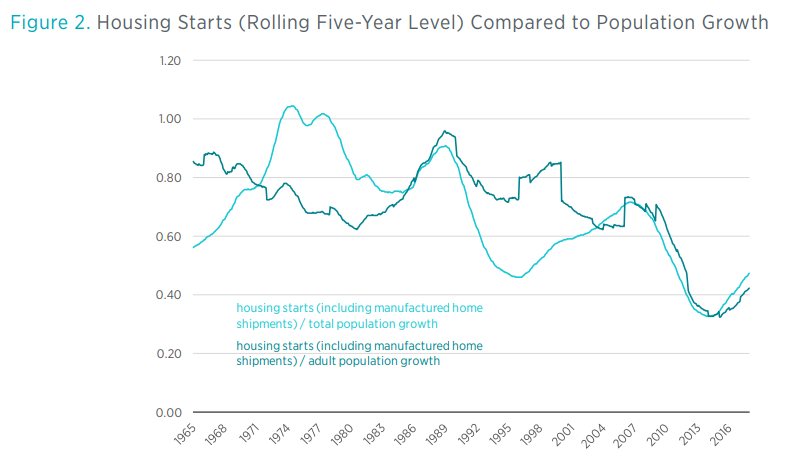
Even with record prices, new listings lagged during 2020-22.
The supply of new homes available for sale, has remained flat at 300,000 for the last 50 years, while the population has grown by 50%.
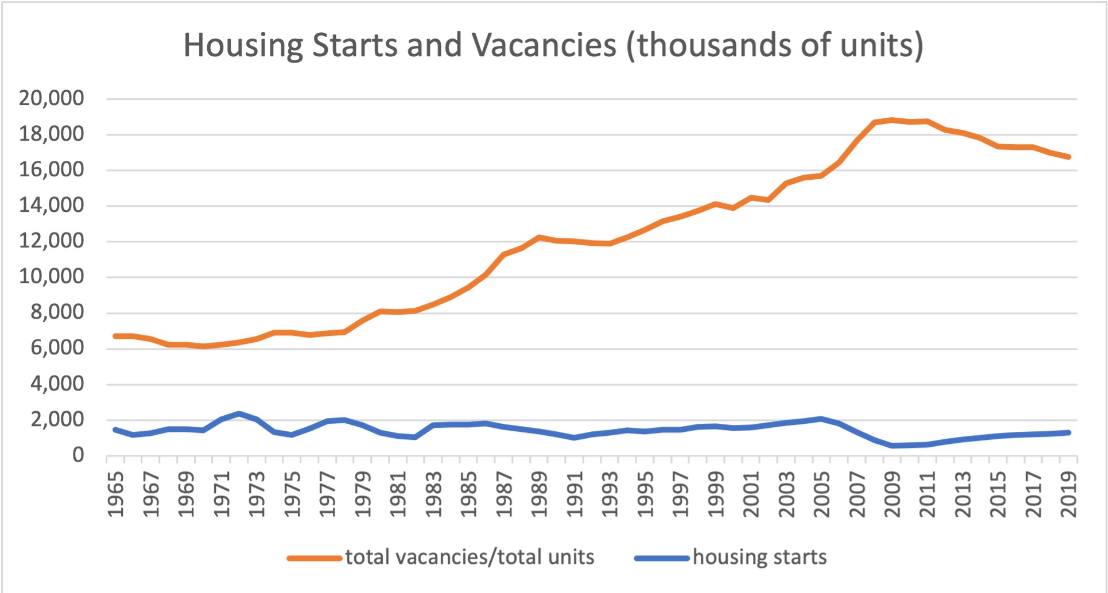
The home vacancy rate is at one-half of its historic level.
Housing Units
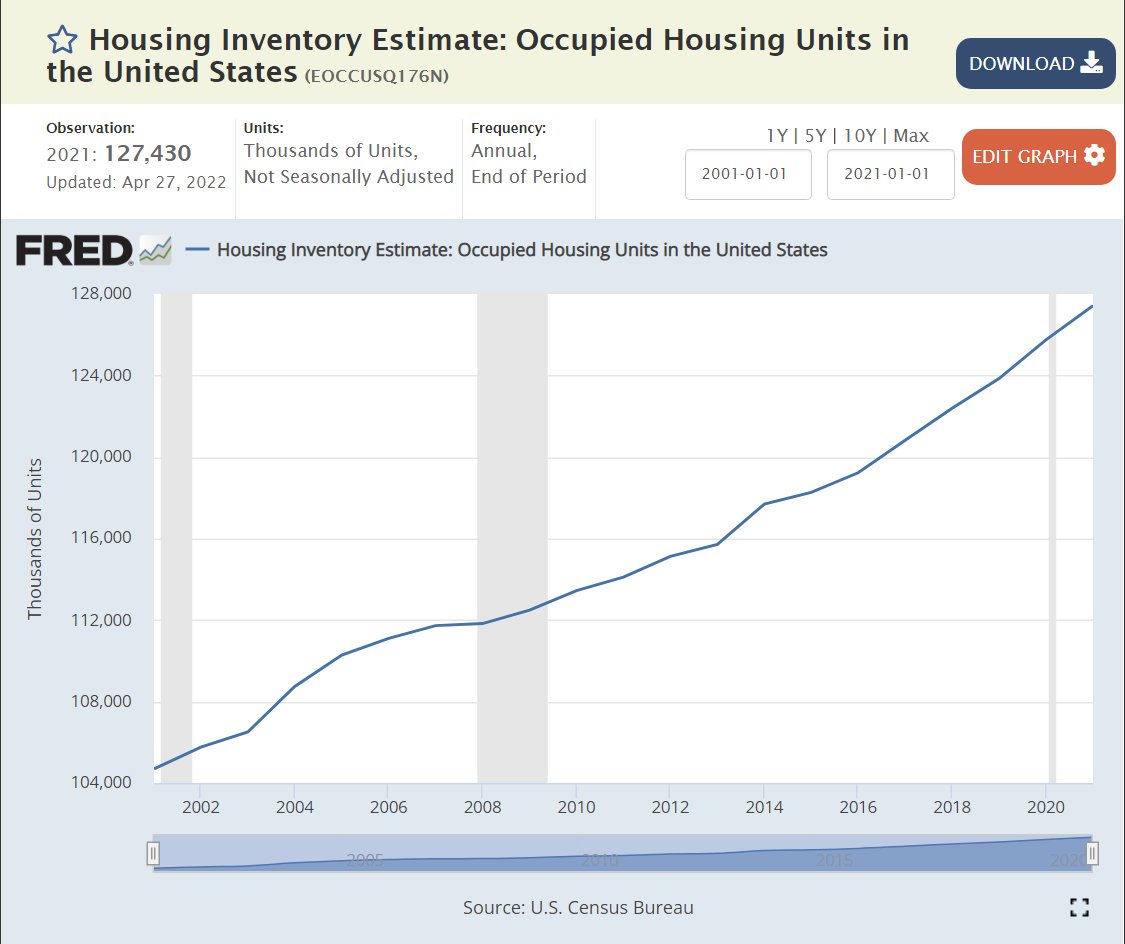
The ratio of housing units to population in 2021 is 0.38, a little higher than the 0.37 in 2001.
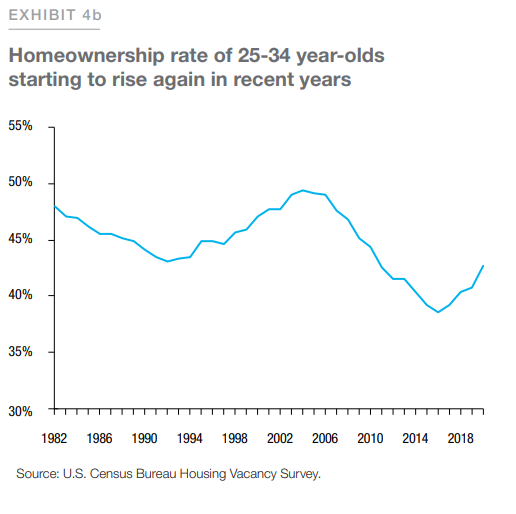
The “American dream” of single family home-ownership remains. Buyers continue to try to recover from the decline from 69% in 2006 to less that 64% in 2015.
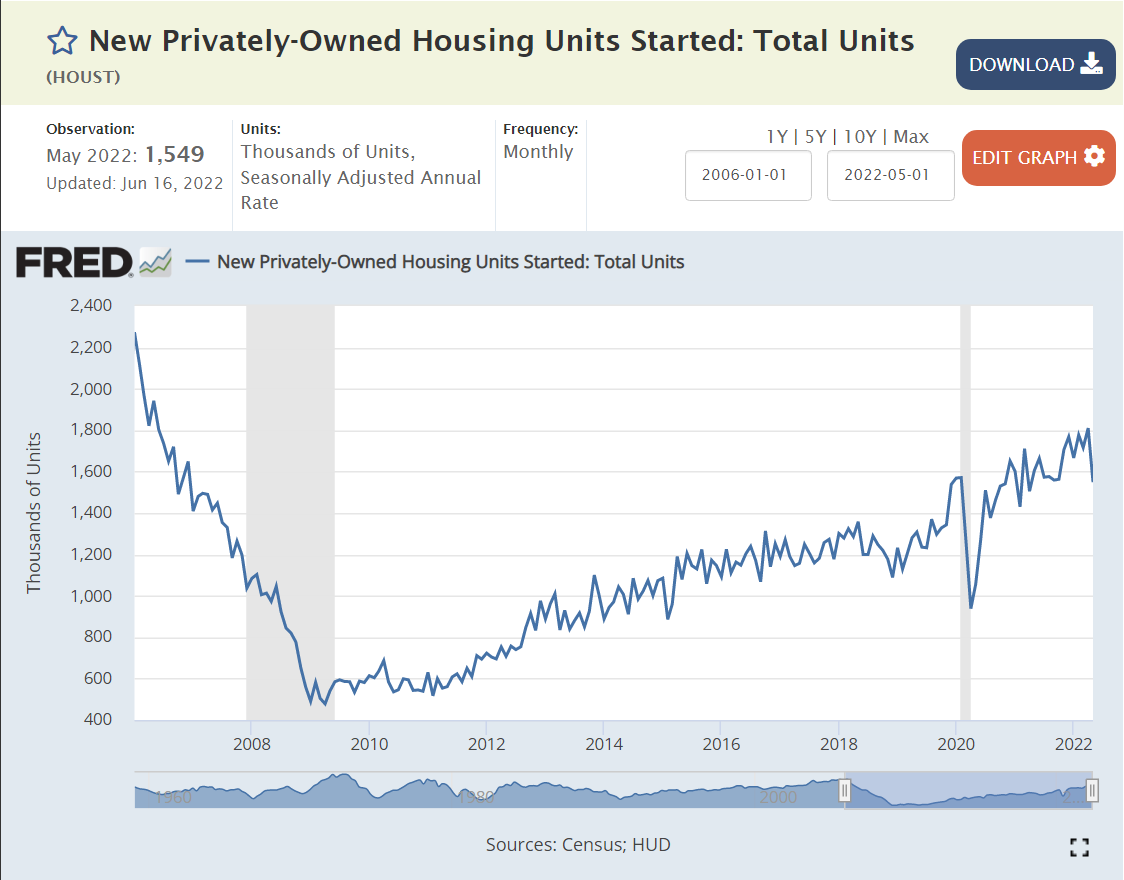
The number of owner-occupied (single-family) homes reached a peak of 76 million in 2006 and then flat-lined for eleven (11) years through 2017. An estimated 8 million homes have been added in the last 5 years, about 1.8M per year after zero per year for 11 years.
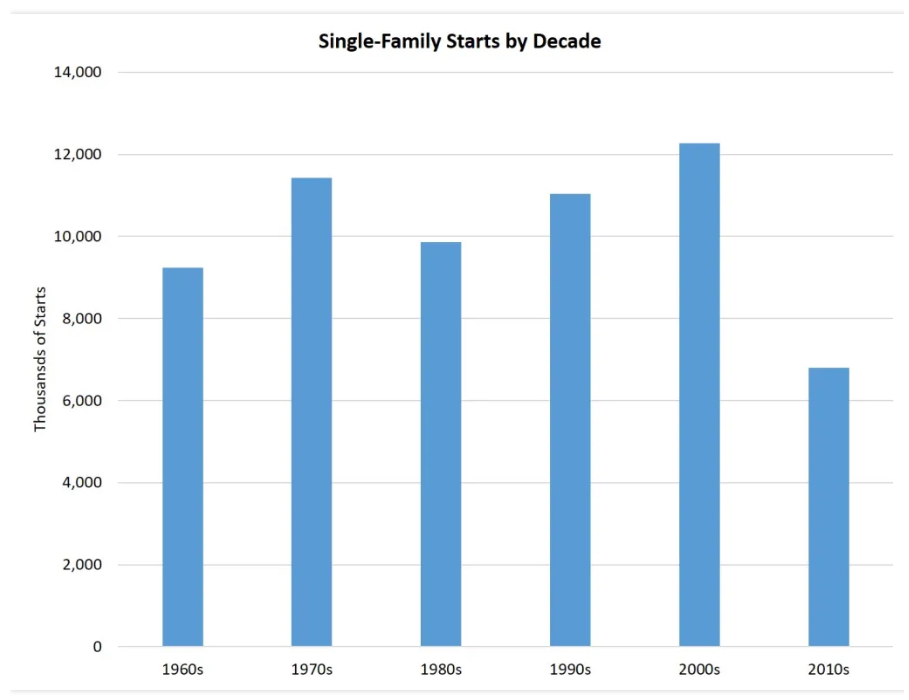
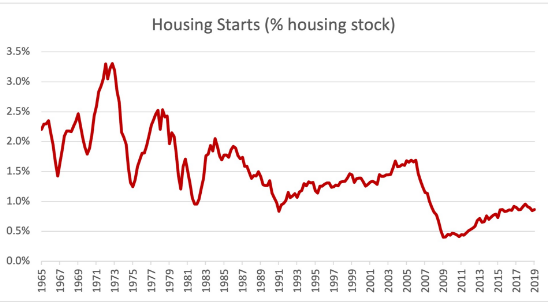
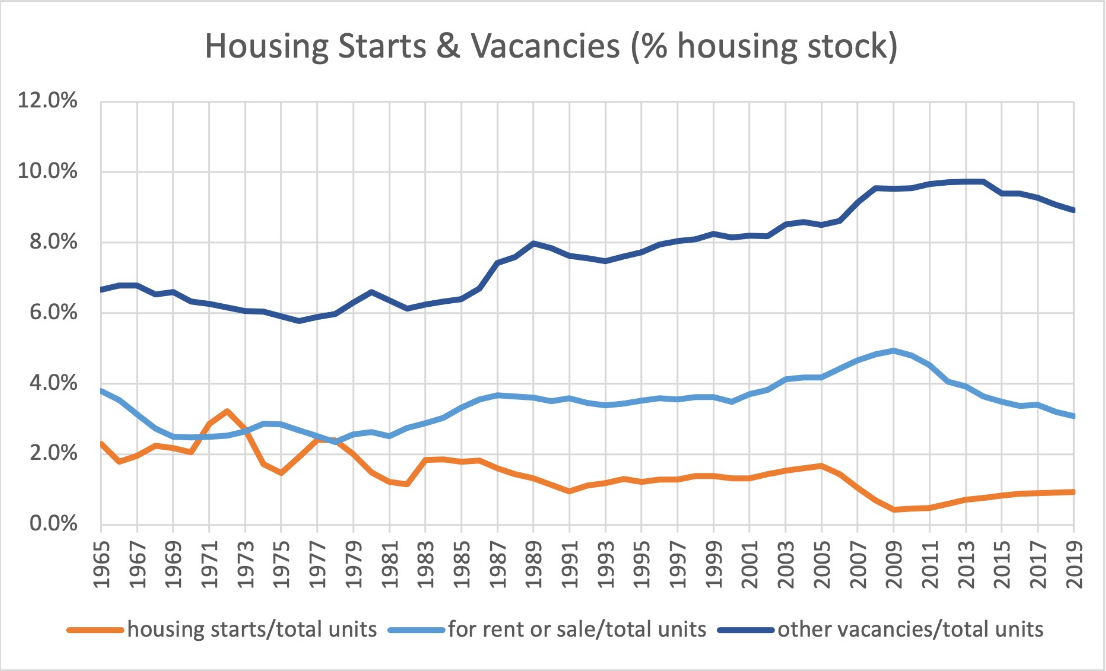
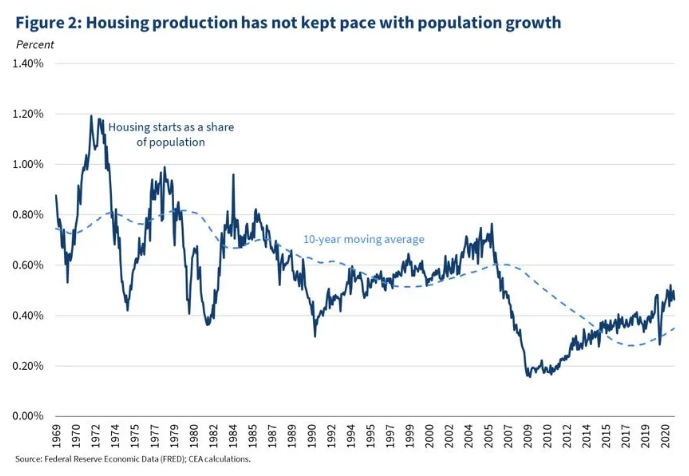
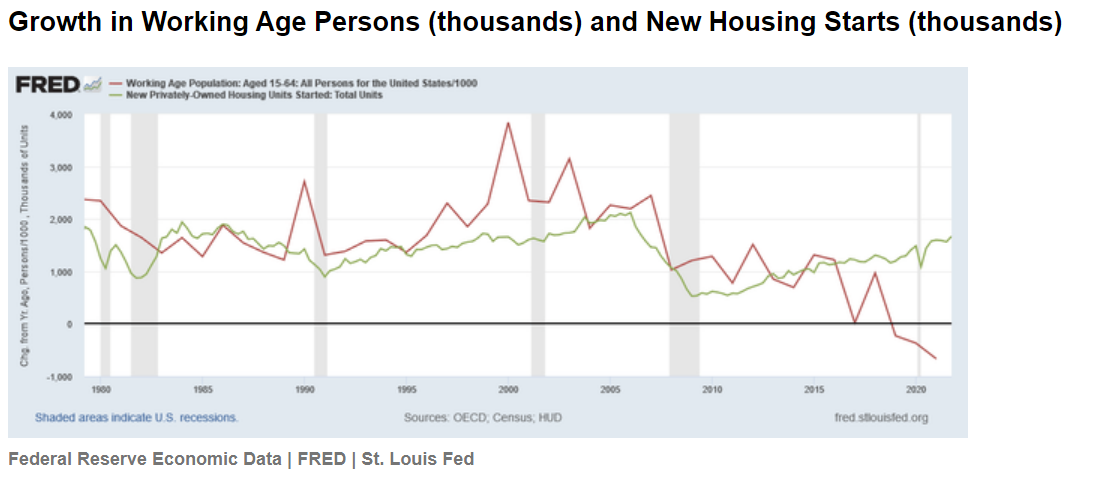
A thorough analysis of supply and demand would include dozens of factors and 100 metro housing markets. However, at the simple trend-based macro level, we see 1.5-1.6 million units per year added from 1960-2010. We see a trough from 2007-2020 with a deficit of more than 5 million missing housing starts.
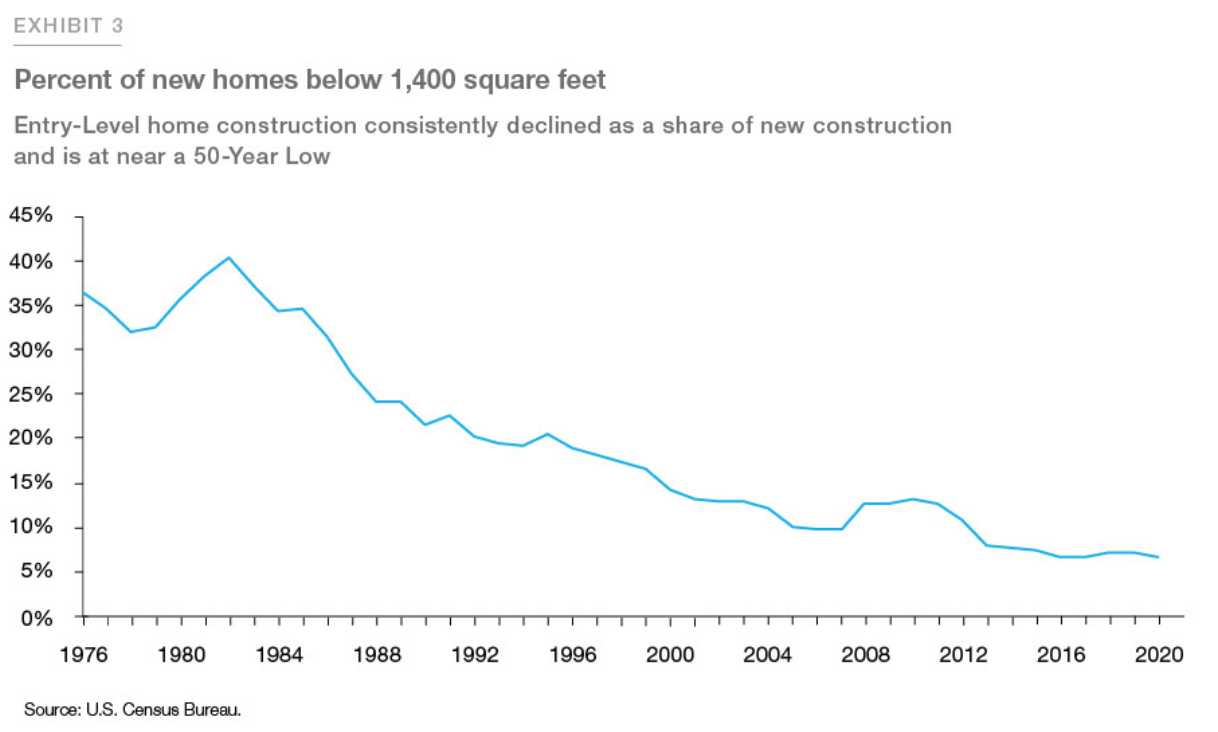
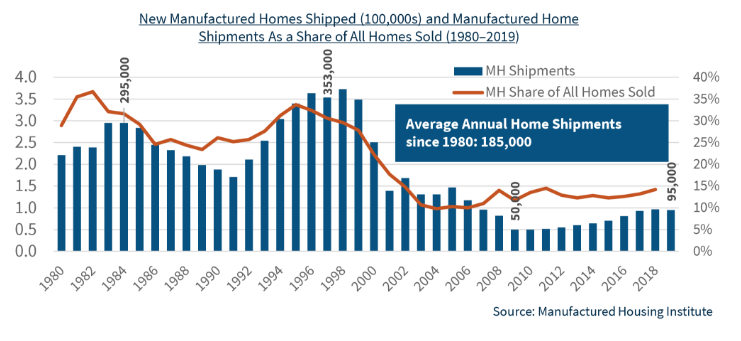
Even Worse, Starter Homes and Manufactured Housing Have Almost Disappeared, Driving an Affordability “Crisis”.
The US added less than one-half of the usual amount in the teens, driving the median housing stock (owner-occupied) age up from 33 to 39 years. So, it’s even more than the 5 million housing units that weren’t built. The whole stock is older. More units require maintenance. More people are waiting to have the new or “newer” home ownership experience.
Many Ratios Echo the Simple “Missing” Housing Stock Claim
The last graph is most persuasive for me. Housing starts are less than one-half of what they were in the 1970’s. That’s a big drop. It’s possible that consumers have just chosen to consume less housing and more of other goods and services, but that does not appear to be the case.
Overall, we’re missing 5-8 million units out of 128 million units in a market that is struggling to deliver 1.6 million units to meet the normal demand.
The Freddie Mac experts come up with a smaller number, just 3.8 million.
As noted earlier, the total housing units per capita ratio is relatively consistent. “Everybody gotta be somewhere”. The total housing units level has grown, with rental units replacing the desired and missing single-family units. The other graphs are comparing two rates of change and concluding that the rates of change are roughly equal, so there cannot be a shortage. I believe that the very deep and historically unprecedented (except for WW II) catastrophic decline in single family home construction from 2006-2020 created a material deficit in the stock of single family homes. The very weak economic recovery after the “Great Recession” held back new household formation and effective demand for new single family homes, so the construction industry did not recover back to its prior level for a full decade or more. The deficit remains.
Summary
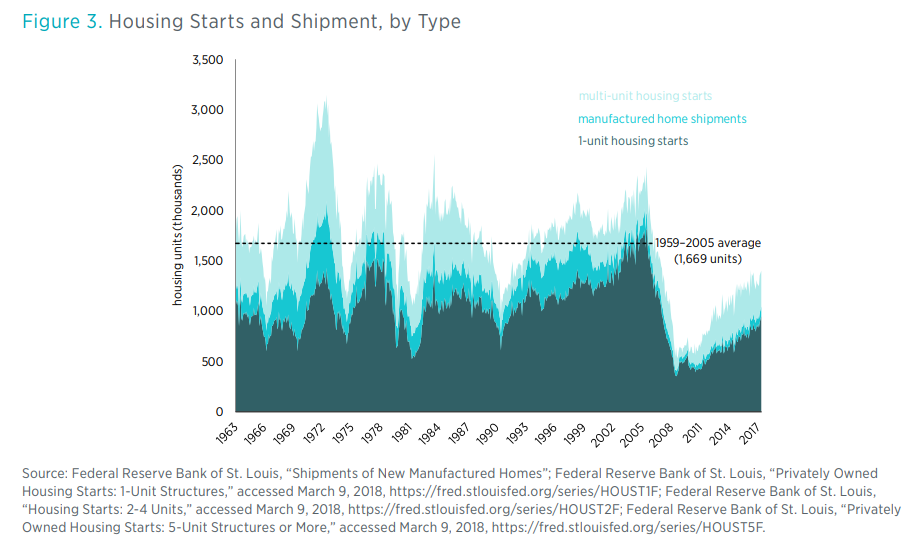
One of the most important concepts in Economics 101 is “stocks and flows”. Stocks are a summary quantity at a single point in time, like all of the gallons of water in Lake Erie behind Niagara Falls. Flows are a quantity per unit of time, like the gallons of water flowing over Niagara Falls per minute, hour or day. Our economy contains both “stocks and flows”, especially relevant in the housing market. The flow of new home construction (single family or multi-family) is one of the most volatile components of GDP (flow of $ produced per year).
Historically, major changes in home construction have driven a majority of all business cycle declines. Bank runs and changes in interest rates account for another one-third. Supply shocks and international trade/currency changes account for the remainder.
Most markets “clear” in a relatively short time period and we collectively quickly benefit from the increases in prices that attract producers and drive consumers to find “next best” options and from the decreases in prices that force producers to leave an industry and reallocate capital elsewhere and the relative increase in consumer demand that limits price declines.
Unfortunately, the real estate industry works across much longer time frames. Consumers “want” to own single-family homes, but they can rent or live with relatives for many years. Construction firms are unable to quickly increase their supply capacity when demand increases. This is an industry where “learning by doing” remains a core factor.
The construction industry was truly “decimated” in 2006-7-8. One-half, two-thirds, three-fourths or four-fifths of all firms in any local market (general contractors and suppliers) were bankrupted. It has been slow to recover as banks were “burned” by construction loans and slow to extend credit to anyone.
The remaining construction firms reached new “critical mass” by 2017 and have been expanding rapidly, subject to zoning, land acquisition, labor and materials constraints.
Nonetheless, the cumulative supply deficit is quite large and will drive housing price increases for many years, perhaps another decade!
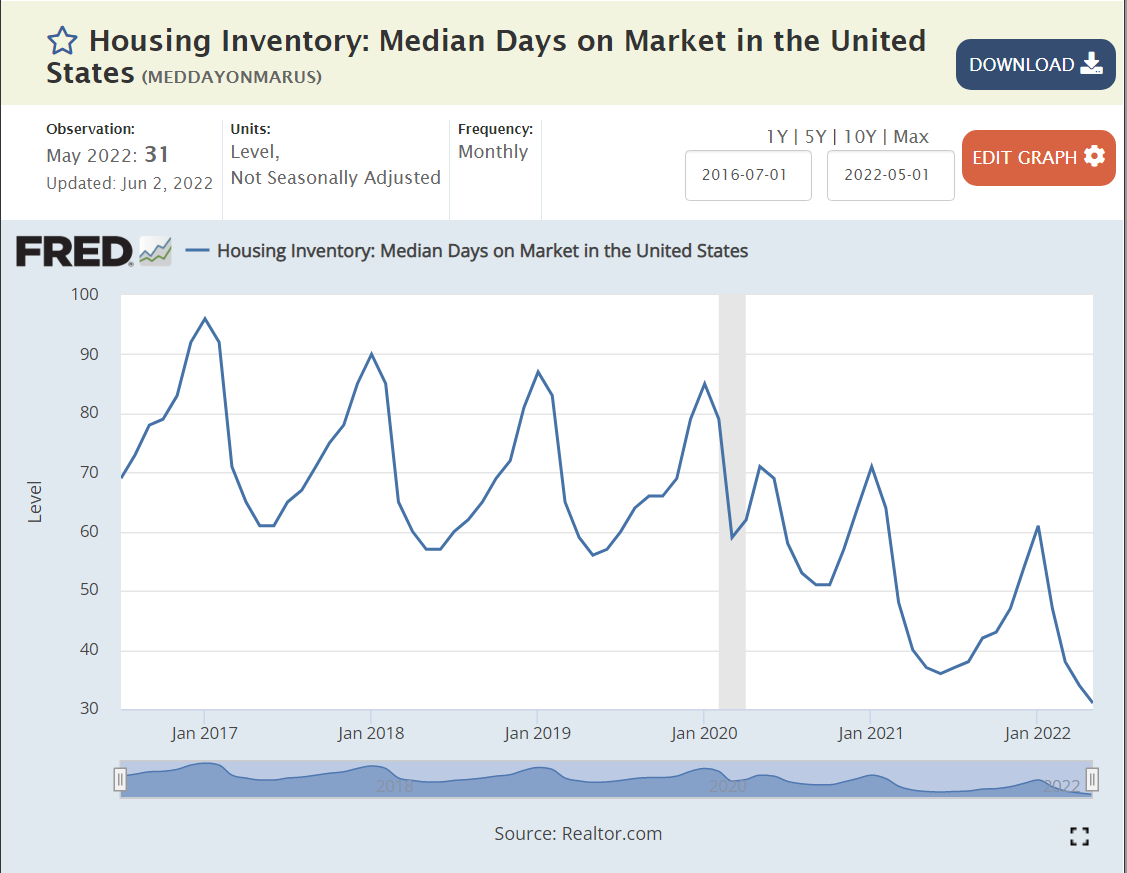
All of the national indicators point to an overheated housing market.
Houses are selling in 30 days, 60% faster than their usual 75 days on the market.
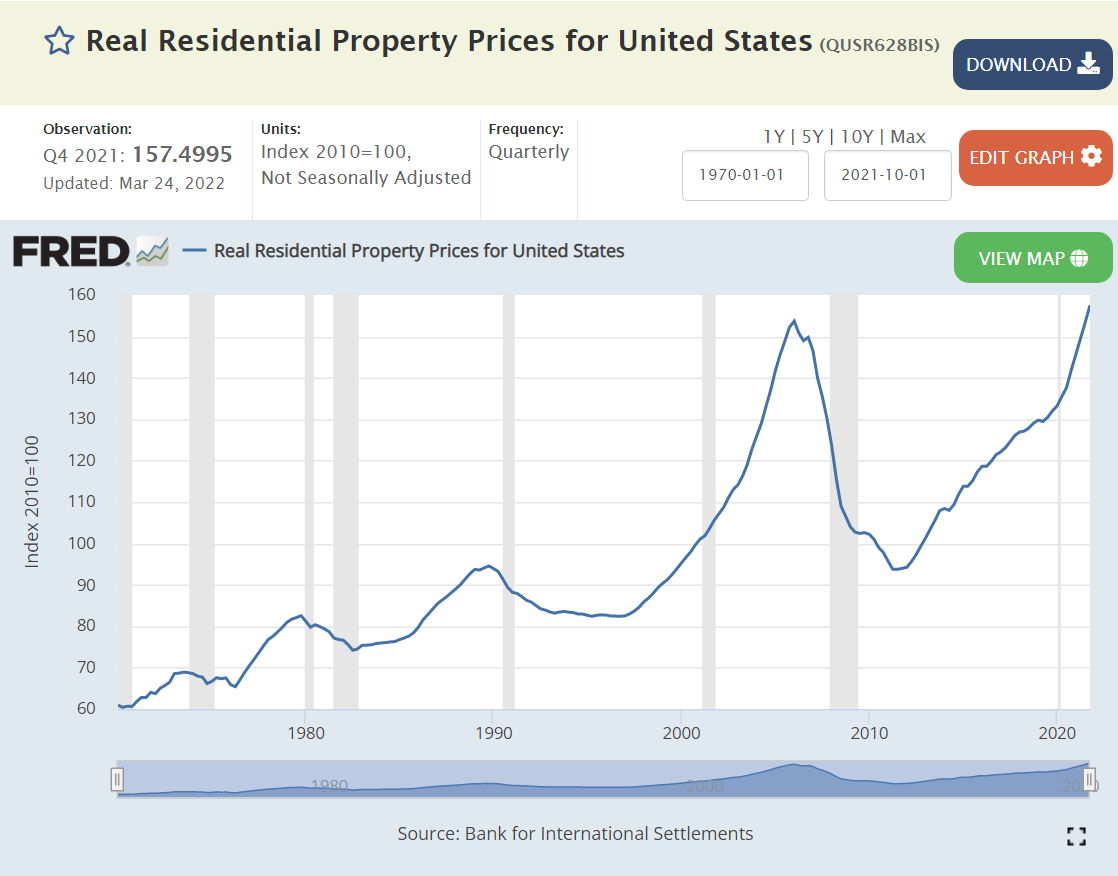
The median home sold for $320,000 throughout 2017-18-19-20. Homes now sell for $100,000 more at $420,000. That’s a 30% increase. We’ve had 10% inflation during this time, so that’s still 20% extra.
Builders have joined the party, showing the same pattern.
Single family rental prices have also followed suit.
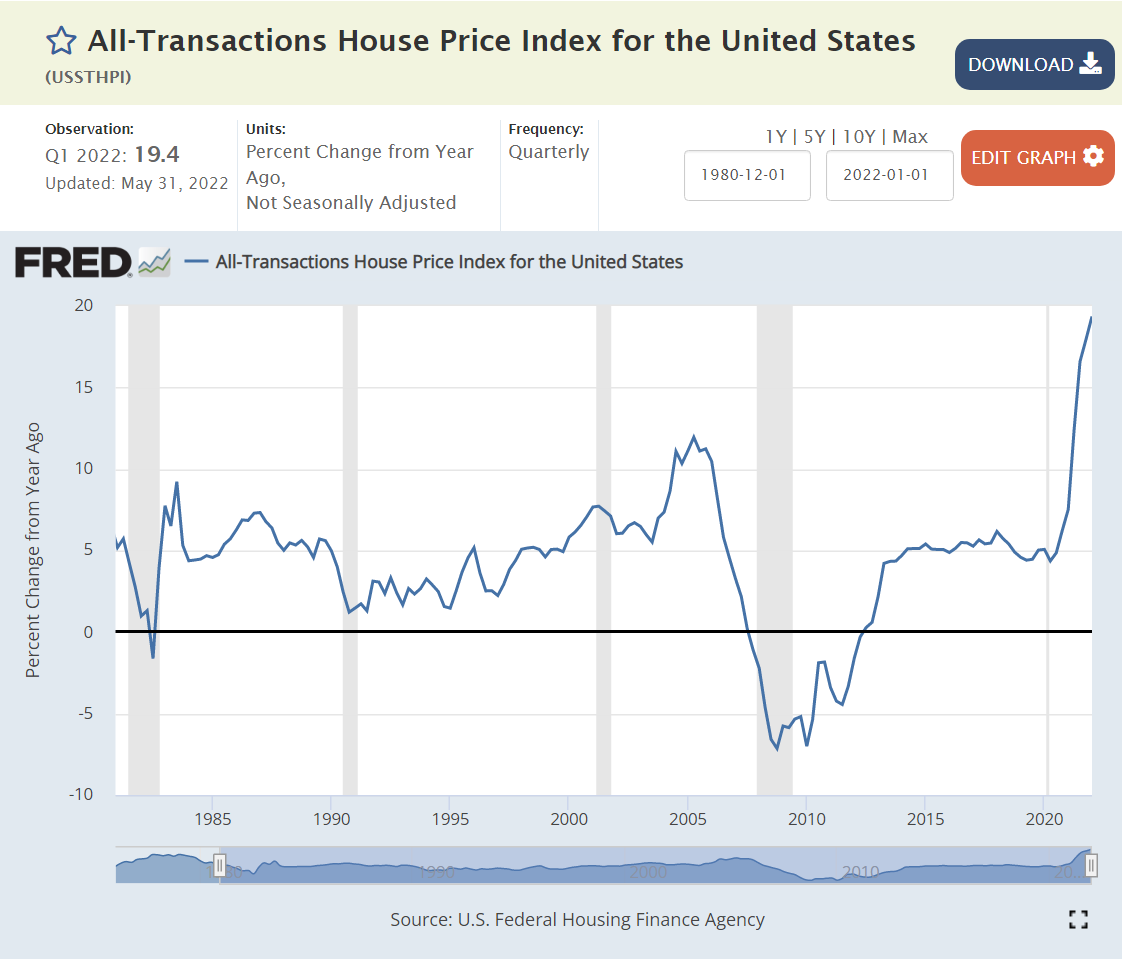
Real, inflation-adjusted, home prices are at an all-time high, equal to those just before the bubble popped starting the “Great Recession”.
Are current house prices sustainable? I think so. Will they continue to increase by 15% per year? No. Prices will level off based on the slow-down of the overall economy, lower consumer confidence, higher mortage rates, etc. Prices are sustainable due to supply and demand. Population growth in the US has continued, especially those aged 25-34 who form the age range where ownership increases.
The supply of new housing has lagged greatly since the Great Recession, compared with history and population. The supply of “starter homes” has been especially low.
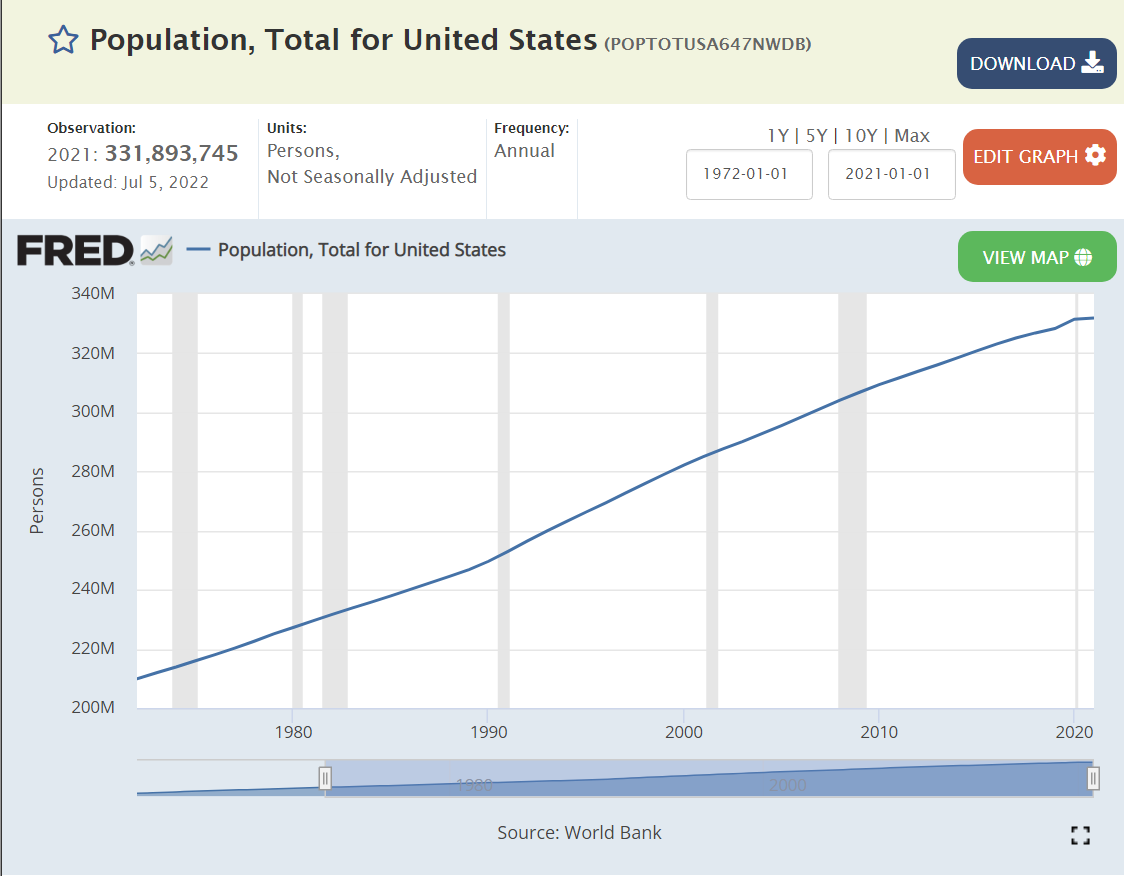
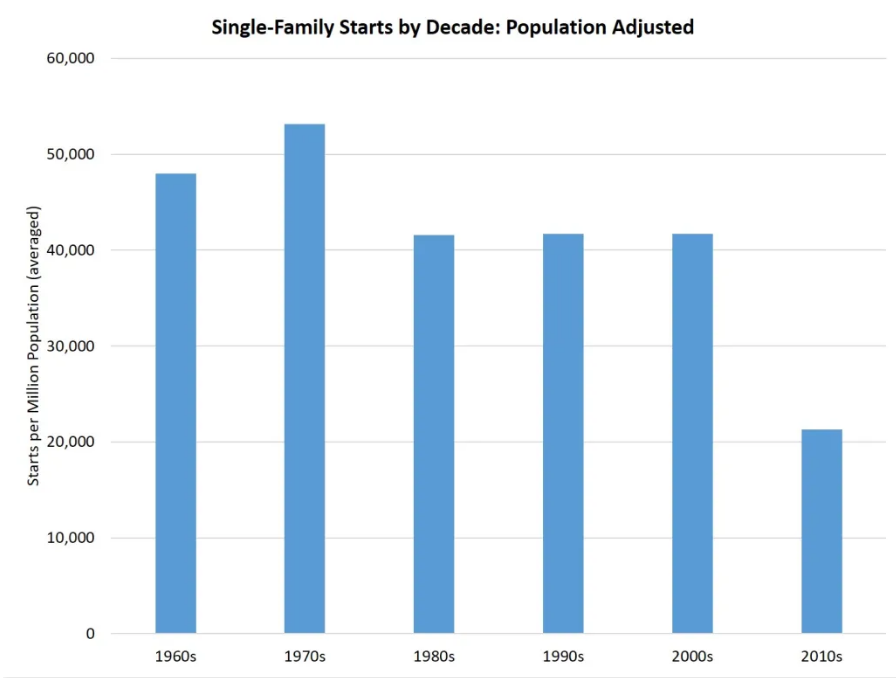
The US population has not quite doubled since 1960, but we’re getting close.
Let’s use 1.5 million housing starts as the typical level for 1960-1970. The comparable level today would be at least 2.25 million, even accounting for the “catch-up” in the 1950’s and 1960’s to make up for the housing shortfall in the 1930’s and 1940’s. The 1970’s and 1980’s were very weak decades due to international competition, energy crises, crazy high mortgage rates, recessions, stagflation, etc. The Clinton economic recovery in the 1990’s was strong for employment, low inflation, lower mortgage rates and zero federal budget deficits, but the economic gains were not disproportionately invested in the housing market. The population had increased from 180 to 280 million (55%), but housing starts were essentially “flat”.
The turn of the millennium saw a 25% increase in housing starts, from 1.6 to 2.0 million per year. This level was artificially supported by low interest rates and unsustainable mortgage lending practices. Based on the population, 2 million new homes built per year was sustainable in theory, but not in practice. The construction market dropped to near-zero. (0.5 million starts/year). It reached the 1959 (think about this) level of 1.6 million starts again only in 2020.
Let’s estimate the “lost” construction units of this 16-year period. Assume 1.6 million units per year is the long-term requirement. 2.9 million units were lost during 2007-10. Another 5.3 million units were lost from 2011-20. That’s a total of 8.2 million units, or about 4-5 years’ worth of construction. We can throw out the first period and assume this was offsetting unreasonable demand and supply before the Great Recession. But that still leaves 5.3 million missing units, 3 years worth of current construction. If we assume that 1.8 million units per year is the real long-term requirement, then the 2011-21 period was short another 2.2 million units, for a total of 7.5 million units, or nearly 5 years worth of current construction. At a national level, we still have a severe housing deficit.
The decreased building of “starter homes” aggravates the situation. Home builders try to optimize the profit on their investment in land, within zoning rules, so they disproportionately build larger single-family homes.
The Freddie Mac folks estimate a 4 million home deficit, about one-half of my “back of the envelope” estimate. Even at that level, we have a 2.5-year shortfall. This shortfall will work to increase home prices at a rate above inflation for at least the next 5 years.
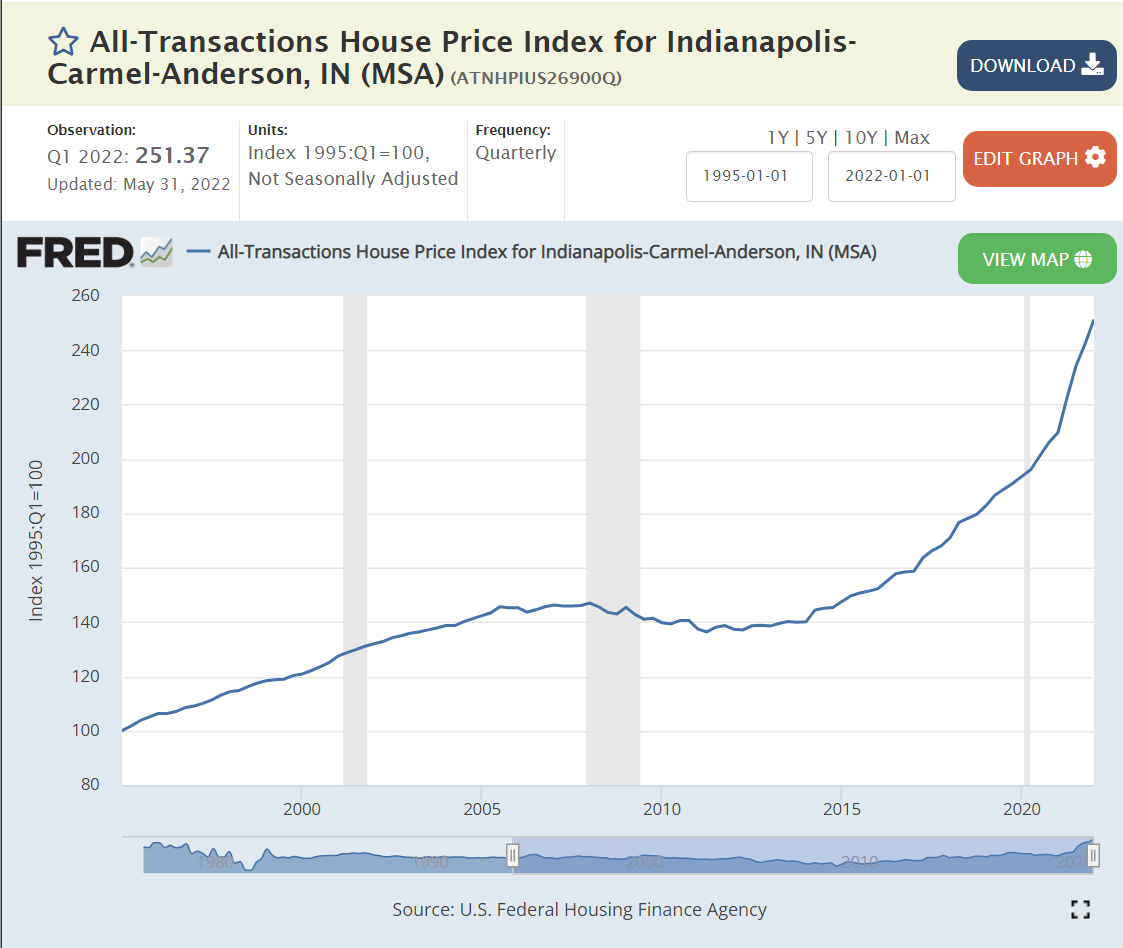
Indy metro population has grown at about the same rate as the nation in recent decades, so it is not surprising that it’s housing starts pattern is quite similar. Perhaps 1,200 permits per month, or 14,000 per year at the peak. Dropping by 75%, eliminating most of the local builders by 2008. The “recovery” has been even slower, reaching 800 permits per month only in late 2020 (2/3rds of the base). Doing the same kind of “rough” math, Indy has a minimum 400 permits per month deficit for 15 years, or 72,000 missing units. At 6,000 units per month, we have a 7-8 year shortfall!!! (flyover country) Assuming that metro Indy continues to be relatively attractive as a destination for college graduates and movers, existing housing prices should increase by more than inflation for the next decade, even though Indy is “cursed” by being a relatively small city with many freeways and housing development options in all directions (tongue placed firmly in cheek)
Although Indy residents complain about recent increases in housing prices, even the higher end suburbs of Fishers and Carmel show up in an “affordable” housing article.
Metro Indy house prices increased by 40% from 1995-2005, but then flat-lined for the next decade, showing just a 40% increase over 20 years or less than 2% growth per year, slower than inflation. They grew by another 40% from 2015-20 in 6 years, 3 times faster than the previous 20 years. They grew much faster in the last year!
The 2%ish price increase rate bumped up to 5% from 2015-2020, before spiking to 20%.
Realtor.com says Indy has a $320K median list price, up 16% for the year, with 30 days listing to accepted offer.
FHA reports 15% price increases in Indy home sales. Indy ranks 63/100 metro areas, slightly below the average 17% rate, and well below the 30% price increases in southwest Florida.
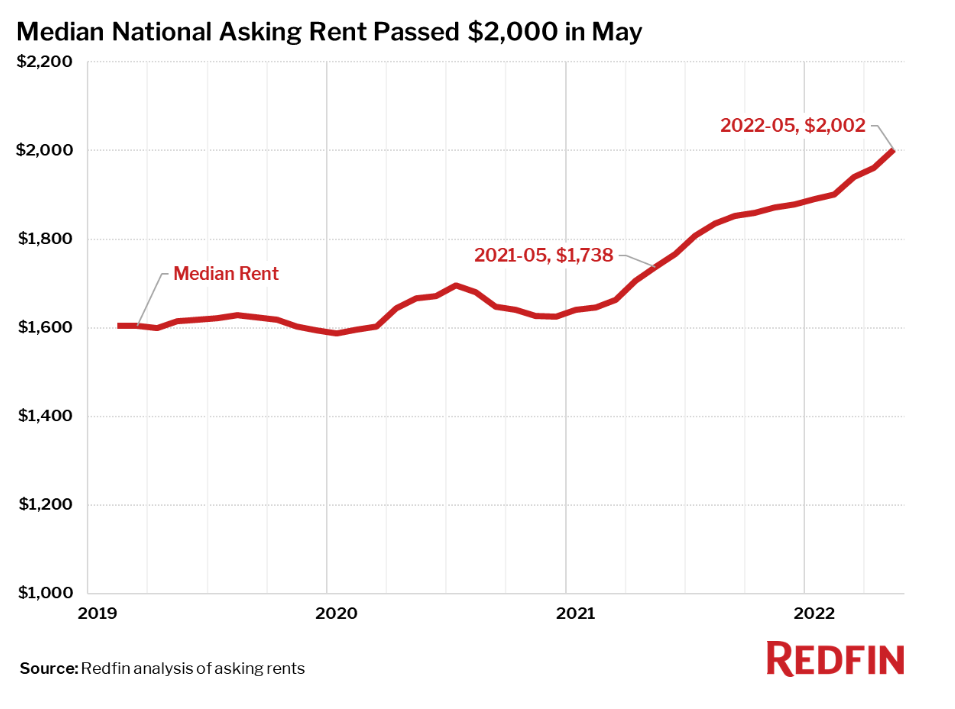
US rents are up by 25% in the last year and a half. Places like Cincinnati and Nashville are seeing 30% asking rent increases. Redfin reports 20% increases in Indy asking prices, but the $1,471 monthly rent remains in the bottom 20%.
The US housing industry is not like a typical consumer product or services market where the forces of supply and demand determine a market price and the equilibrium quantity of housing is delivered instantaneously. Households adapt, calculate, defer, overextend their housing demand based on many factors. Given the four-fold difference between peak and bottom supply, the construction industry is inherently unstable. Zoning rules and approvals change. Mortgage interest rates change. The economy moves through business cycles. Houses are built with 40-60-80 year expected lives, but consumed one year at a time.
The US economy has underinvested in housing for 15 years. The population has grown and median household incomes have grown. Households have aged and decided they prefer single family houses. There is a 3-5-7 year deficit of new housing. Housing prices will increase faster than inflation for the next decade. Indianapolis may see housing prices rise even faster than the national average since it has built relatively fewer new homes.
I was a wide-eyed young adult when the US last experienced 12% and 15% inflation rates. Our current situation is very different from that sad time 50 years ago. Fiscal policy was much looser, with LBJ pursuing a both “guns and butter” policy and Nixon following along. Monetary policy was slightly accommodating in the 70’s, comparable to today. The “supply shock” in the 70’s was much larger. The US was then much more dependent on foreign oil imports. Today the US is roughly “energy independent”, so subject to global price changes only. In the 1970’s, labor unions had some degree of power against the largest manufacturing concerns and used that power to attempt to maintain workers’ wages. There is no similar labor power today.
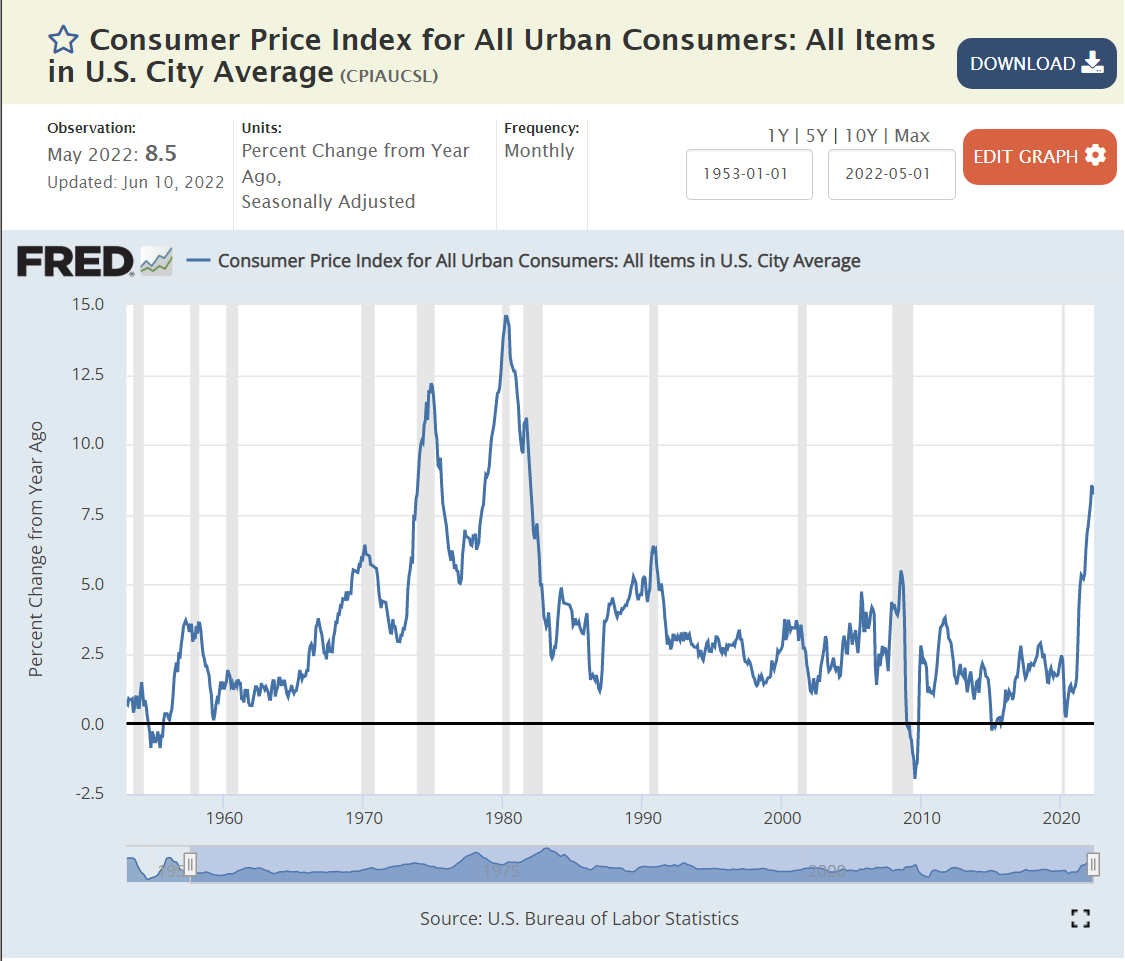
Average Inflation is at a Recent High of 8%
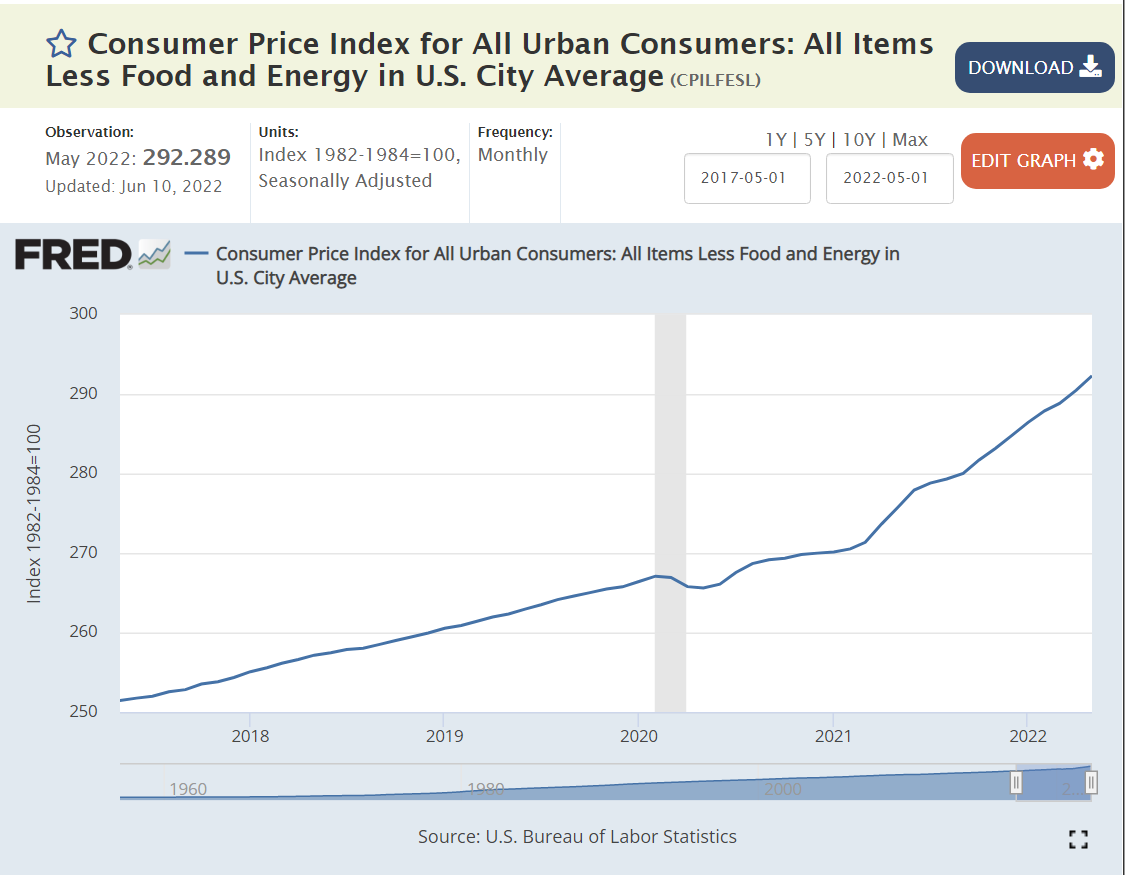
Core Inflation, Excluding Food and Energy is Growing at 6%
The inflection point is March, 2021. 2-3% inflation before then. 6% inflation in the last year. 6% is much higher than the 2% trend of the last 2-3 decades, but not a harbinger of spiraling inflation or wage-price spirals or cost-push inflation.
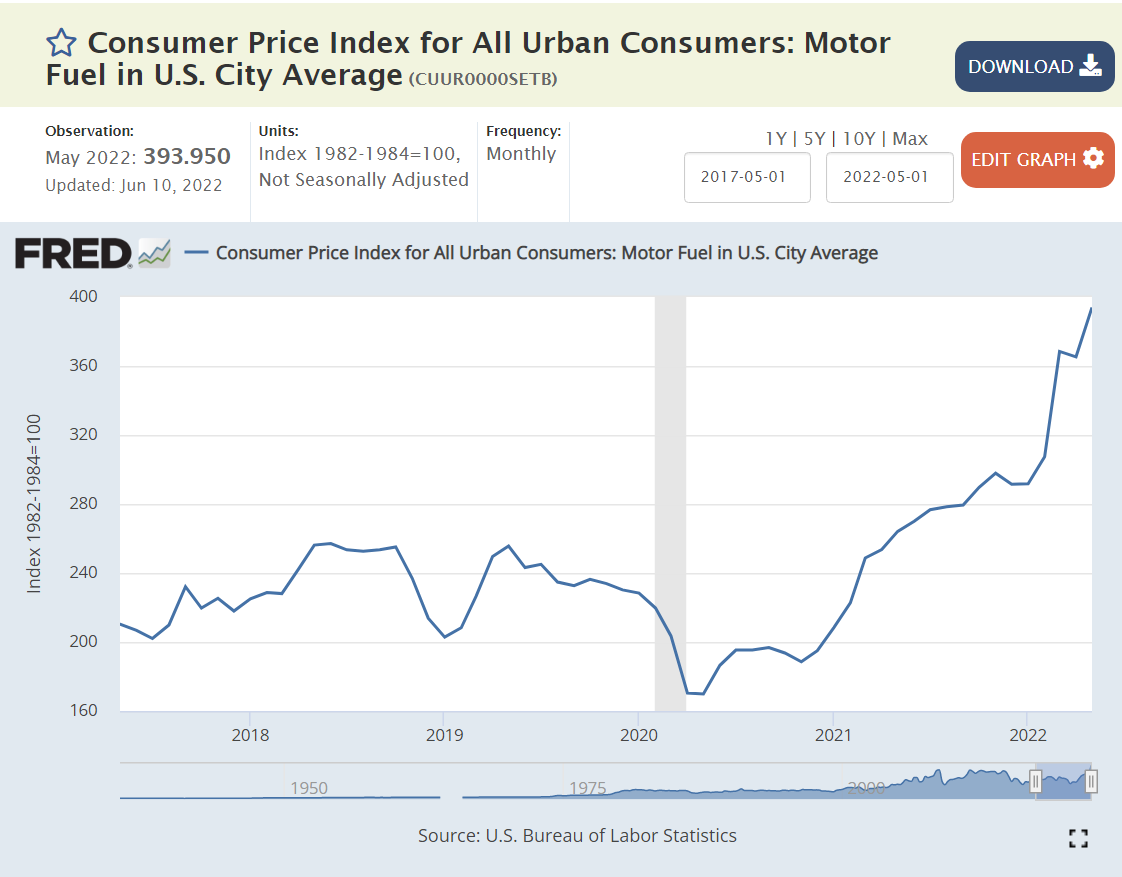
Inflation is Driven by Historically Highly Variable 1) Energy, 2) Commodities and 3) Food Prices.
The doubling of global energy prices since the end of 2020 is apparent. This was driven by the unexpectedly rapid global recovery from the pandemic (good news, overall) and the supply crimp from the Russian invasion of Ukraine. Energy is a 7% weight in consumer prices, so a doubling has a tremendous effect.
US demand for durable goods spiked by 50% within the pandemic, as in-person services were unavailable. This completely unexpected increase in demand for final goods drove a completely unexpected demand for commodity inputs, resulting in much higher prices that continue through today.
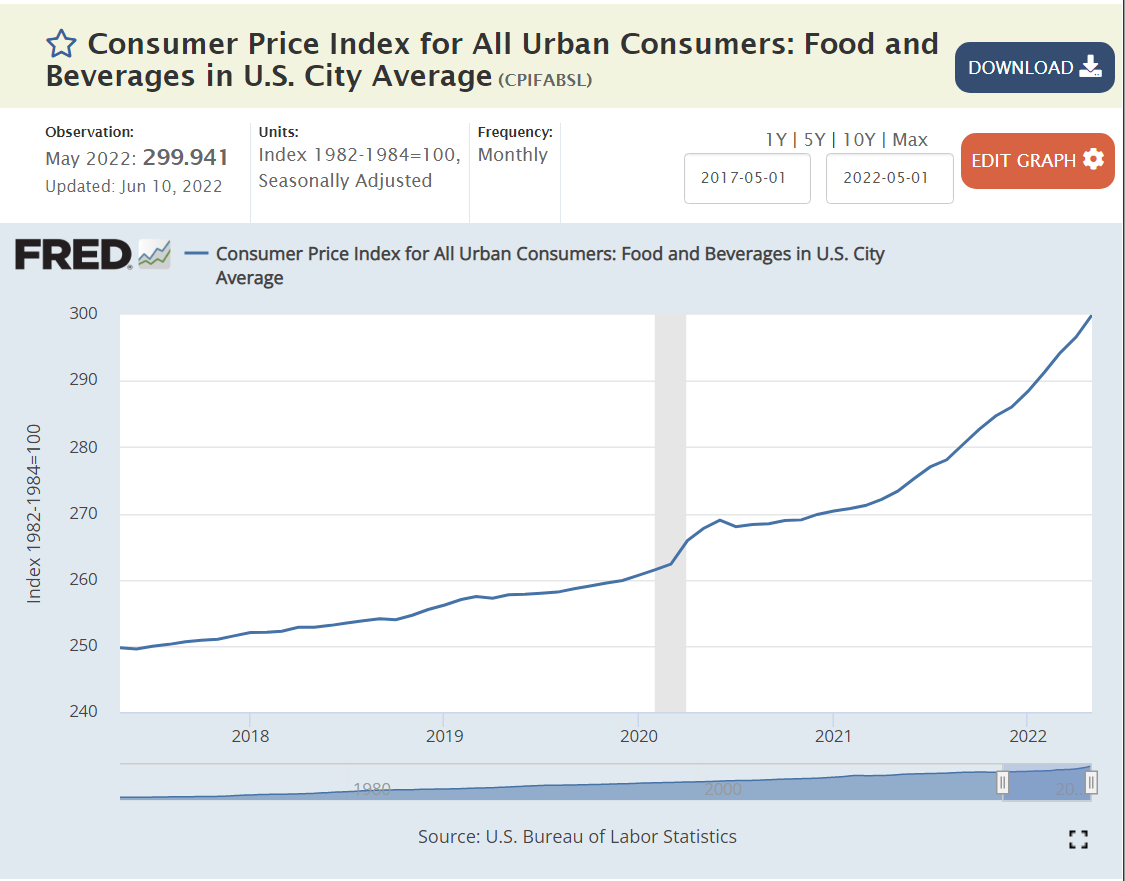
Food price increases also spiked. The pandemic interrupted direct agriculture and food processing labor inputs. Raw food inflation reached 16%, while “away from home” food prices grew by just 7%.
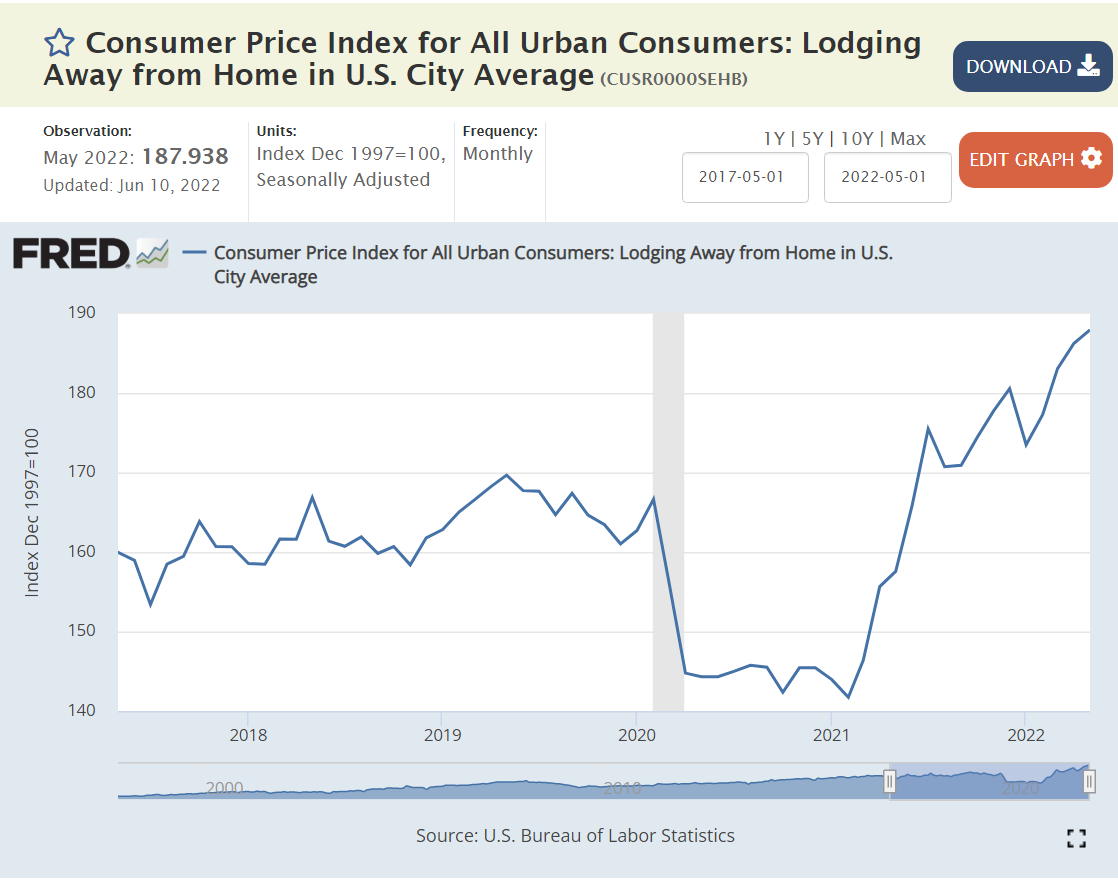
Lodging and Vehicle Prices Spiked Due to the Stop/Start Nature of the Pandemic Economy.
Lodging and used car inflation exceeded 20% but is now slowing. New car prices increased by 12%, but this price increase is back down to a 7% annual rate.
But, All Other Sectors Have Experienced “Normal” – Non-accelerating 6% or Lower Price Increases.
6%.
3-4%.
3-5%.
4-5%.
Drugs 2%. Medical Services 6%.
Communication and IT continue their price decreases after a small increase.
1-2% annual inflation.
Household furnishings, up 9% like other consumer durables.
Food away from home, up 6-7%, despite the incredible disruptions in the last 2-3 years.
Summary
Energy, food and commodities prices have increased sharply in the last year. The other dozen price indices have increased by 5-6-7% and then flattened off. Loose fiscal and monetary policy, combined with commodities price spikes have driven quite high consumer price inflation for the last 6-9 months. Inflation will drop from 8% to 6% in the 3rd quarter and then to 4% in the 4th quarter and then lower into 2023.
There is no indication of rapidly increasing prices or a wage-price spiral. US labor unions don’t have the power to respond to the recent unexpected increase in consumer prices with a demand for equal or higher wage increases. Wages have increased by 5% in the last 2 years as inflation has spiked to 8%.