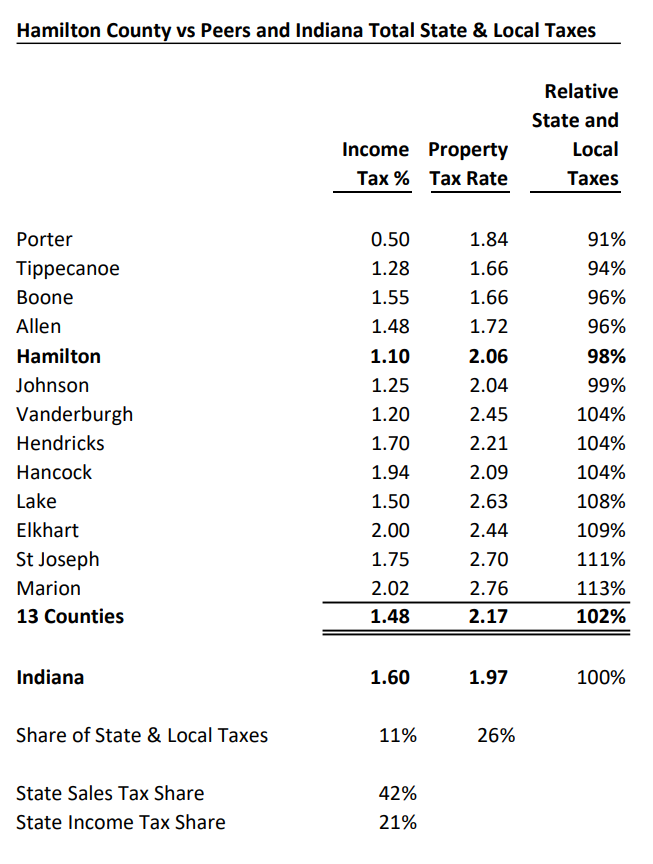
State and local taxes are mostly driven by the state. In Indiana, state sales and income taxes account for 63% of the total. Local taxes account for 37% of the total.
Indiana is a lower tax state. Various sources rank it 11th to 18th lowest, with a median ranking of 14th. Hoosiers pay 9.3% of their income for taxes.
Indiana’s 9.3% paid is a little higher than 10th rated Oklahoma’s 9.0% and a little less than 25th rated New Mexico’s 10.2%. It is significantly lower than 40th rated Utah’s 12.1%.
Hamilton County’s 1.1% income tax rate is the 12th lowest of 92 counties in Indiana, 31% lower than the average of 1.6%. The median is 1.75%. Its median property tax rate is 5% higher than the state average. The weighted average total state and local tax rate for Hamilton County is 2% lower than the state average. The Hamilton County total taxes paid as a percent of income is comparable to 12th ranked Louisiana and Florida at 9.1%.
Hamilton County has lower taxes compared with its Indiana peer counties, the top 10 in population plus Indy metro Johnson, Boone and Hancock counties. Its 1.1% income tax rate is lower than all except Porter County; significantly (26%) below the 1.48% average. Its median property tax rate is 5th lowest of the 13, 5% below the peer average. The peer counties’ total tax rate is 2% above the Indiana average. Hamilton County is 2% below the Indiana average.
For each measure, we’ll list the Hamilton County rate, the Indiana rate and a letter grade primarily comparing Hamilton County with the Indiana average but also considering the national average.
Annual flu vaccinations: 64% vs 54%, A.
Infants with recommended immunizations: 66% vs 67%, C.
Mothers receiving pre-natal care in first trimester: 84% vs 72%, A.
Mammography screenings: 47% vs 39%, A.
Adults with recent preventive care visit: 78% vs 75%, B.
Adults reporting excessive drinking: 18% vs 18%, C.
Alcohol impaired driving deaths: 24% vs 19% (US avg is 27%), C.
Adult smoking: 11% vs 20% (US avg is 16%), A.
Preventable hospital stays (by outpatient services) per 100K Medicare enrollees: 1,850 vs 3,174, A.
Adults without leisure-time physical activity: 17% vs 26% (US avg is 22%), A.
Adult obesity: 29% vs 37% (US avg is 32%), B.
Adult diabetes rate: 8% vs 11% (US avg is 9%), B.
Diabetes deaths per 100K: 12 vs 30, A.
Heart disease prevalence: 4.4% vs 6.0%, A.
Heart disease hospitalizations per 1K Medicare beneficiaries: 48 vs 62 (US avg is 57), A.
Sexually transmitted disease (chlamydia) cases per 100K: 216 vs 480, A.
Existing HIV cases per 100K: 82 vs 193, A.
Some medical experts dispute classifying measures (above and below) as being strongly related to individual behaviors or as social indicators. They are grouped as conventionally done by others reporting on public health.
Social Indicators
Emergency room injury visits per 10K: 532 vs 850, A.
Injury deaths per 100K: 43 vs 85 (US avg is 76), A.
Drug overdose deaths per 100K: 12 vs 28 (US avg is 23), A.
Opioid ER visits per 100K: 31 vs 75, A.
Deaths of despair per 100K: 31 vs 53, A.
Teen births per 1K females: 4 vs 17, A.
Births, mother smoked during pregnancy: 1% vs 11%, A.
Infant deaths per 1K live births: 4.7 vs 6.7 (US avg is 5.4), B.
Deaths per 100K under age 18: 30 vs 60 (US avg is 50), A.
Children in single parent households: 13% vs 25%, A.
Disconnected ages 16-19, not working or in school: 5% vs 6% (US avg is 7%), B.
Juvenile arrests per 1K: 8 vs 19, A.
Summary
Hamilton County earns summary A grades for both behaviors and social indicators. US News & World Report rates Hamilton County as 8th best nationally of the counties it tracks. County Health Rankings lists it as the healthiest county in Indiana.
For each measure, we’ll list the Hamilton County rate, the Indiana rate and a letter grade primarily comparing Hamilton County with the Indiana average but also considering the national average.
Primary care physicians per 100K: 140 vs 67, A+.
Hospital beds per 1,000: 1.8 vs 3.3, (US avg is 1.9), B.
Population per “other” (nurse practitioner) primary care providers: 920 vs 830, C-.
Population per mental health care provider: 580 vs 530 (US avg is 340): D.
Population per dentist: 1,350 vs 1,700 (US avg is 1,380), B.
Access to park or physical recreation facilities: 90% vs 77%, A-.
Uninsured adults: 5% vs 10%, A+.
Food insecurity: 7% vs 11%, A.
Limited access to healthy foods: 5% vs 9% (US avg is 6%), B.
Health Outcomes
Life expectancy: 81.6 vs 76.5 (US avg is 78.5), A.
Deaths per 100K: 710 vs 965, A+.
Premature deaths per 100K: 215 vs 420, A+.
Reporting poor or fair health: 9% vs 15%, A.
Poor physical health days per month: 2.5 vs 3.3 (US avg is 3.0), B.
Poor physical health one-half of the time: 7% vs 10%, A.
Low birth weight: 7% vs 8%, B.
Arthritis hospitalizations per 10K: 33 vs 33, C.
Hip fractures per 10K aged 65+: 56 vs 62, B.
New lung cancer cases per 100K: 46 vs 72, A+.
Total cancer rate per 100K: 442 vs 457, C+.
Total cancer death rate per 100K: 126 vs 163 (US avg is 144), A-.
Mental Health
Poor mental health days per month: 3.9 vs 4.9, A.
Frequent mental distress: 13% vs 16%, B+.
Medicare beneficiaries with depression: 20% vs 21% (US avg is 18%), C-.
Insufficient sleep: 27% vs 36%, A.
Suicide deaths per 100K: 9 vs 15, A+.
Summary
Subjectively, health resources combine for a solid B+ or A-. Health outcomes are clearly rated A. Mental health is A. US News & World Report rates Hamilton County as 8th best nationally of the counties it tracks. County Health Rankings lists it as the healthiest county in Indiana. Hamilton County operates Riverview Health. Its health department effectively managed several rounds of covid vaccines.
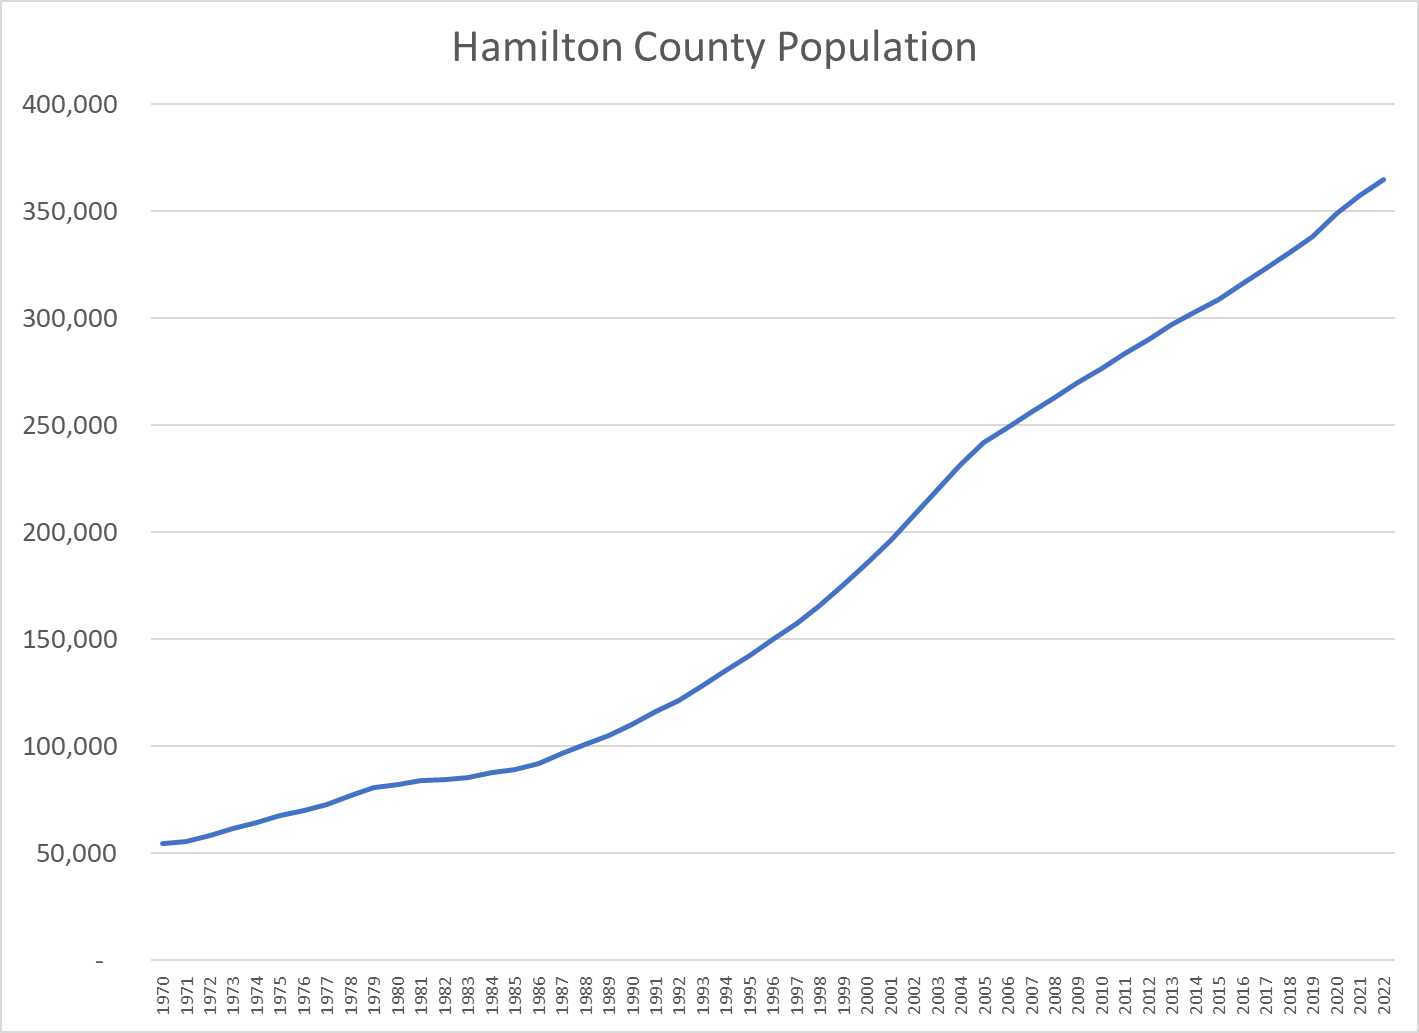
Hamilton County’s population has grown by at least 7,000 per year for 30 years. Growth peaked at 10,000 per year from 1999-2005, decreased to 7,000 in the aftermath of the Great Recession and has since increased to 8,000 per year.
The county has enjoyed a natural increase of about 2,000 per year, with 4,000 births per year and 2,000 deaths per year. Annual net in-migration has averaged 6,000 in the last decade. Hamilton County loses roughly 3,000 residents to other states and 2,000 students to attend major universities. It gains about 4,000 international immigrants, 1,000 from Illinois, 1,000 from other Indiana counties and 5,000 from nearby Marion County.
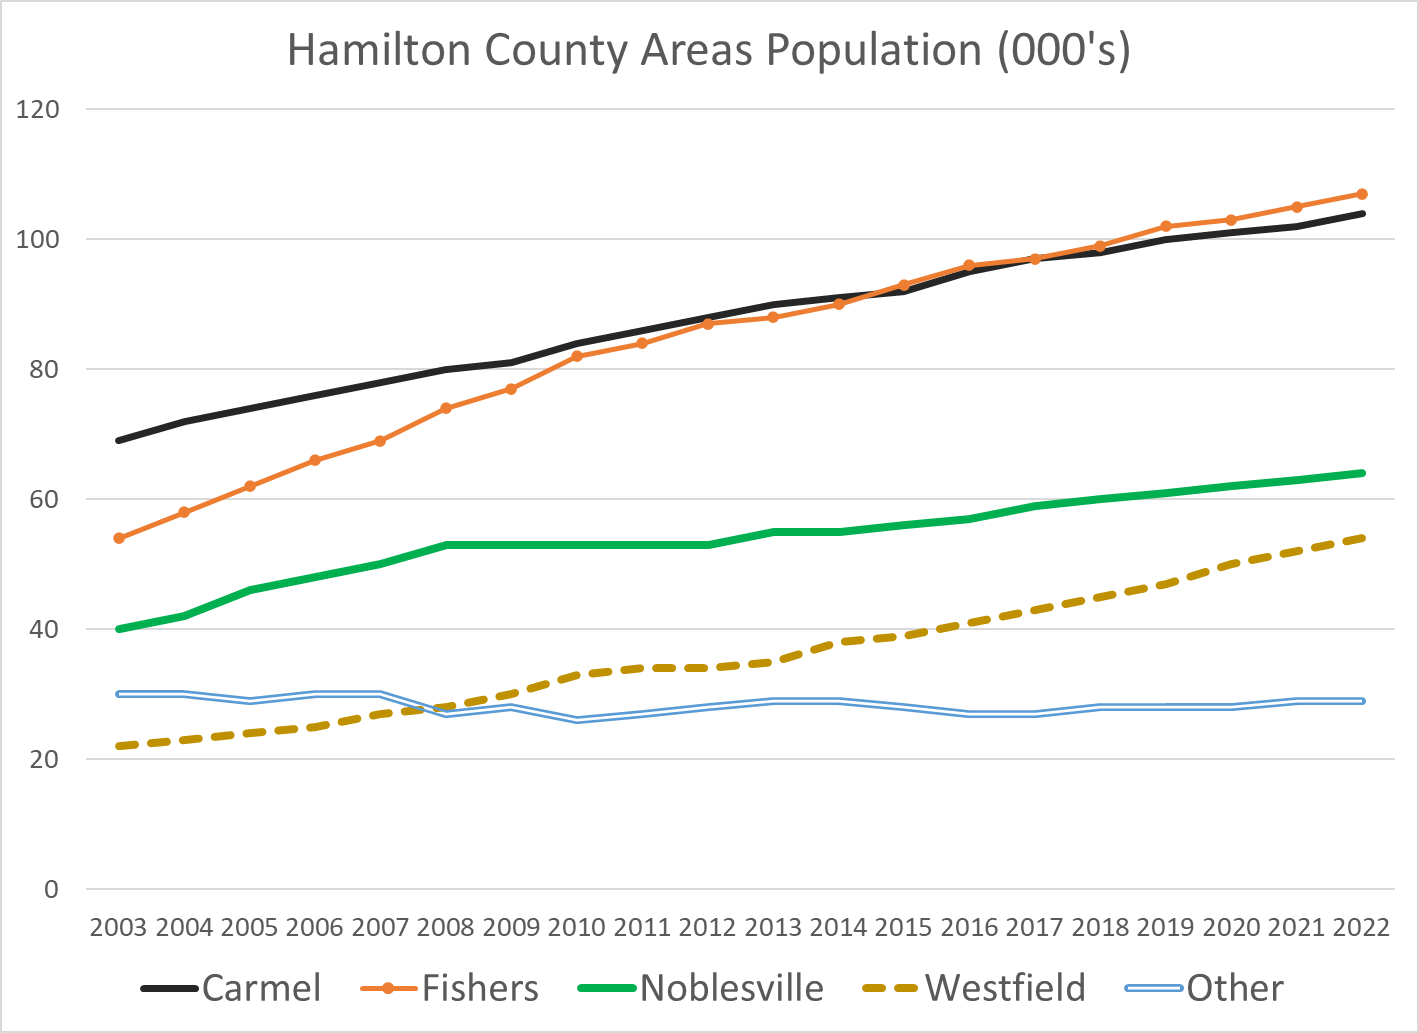
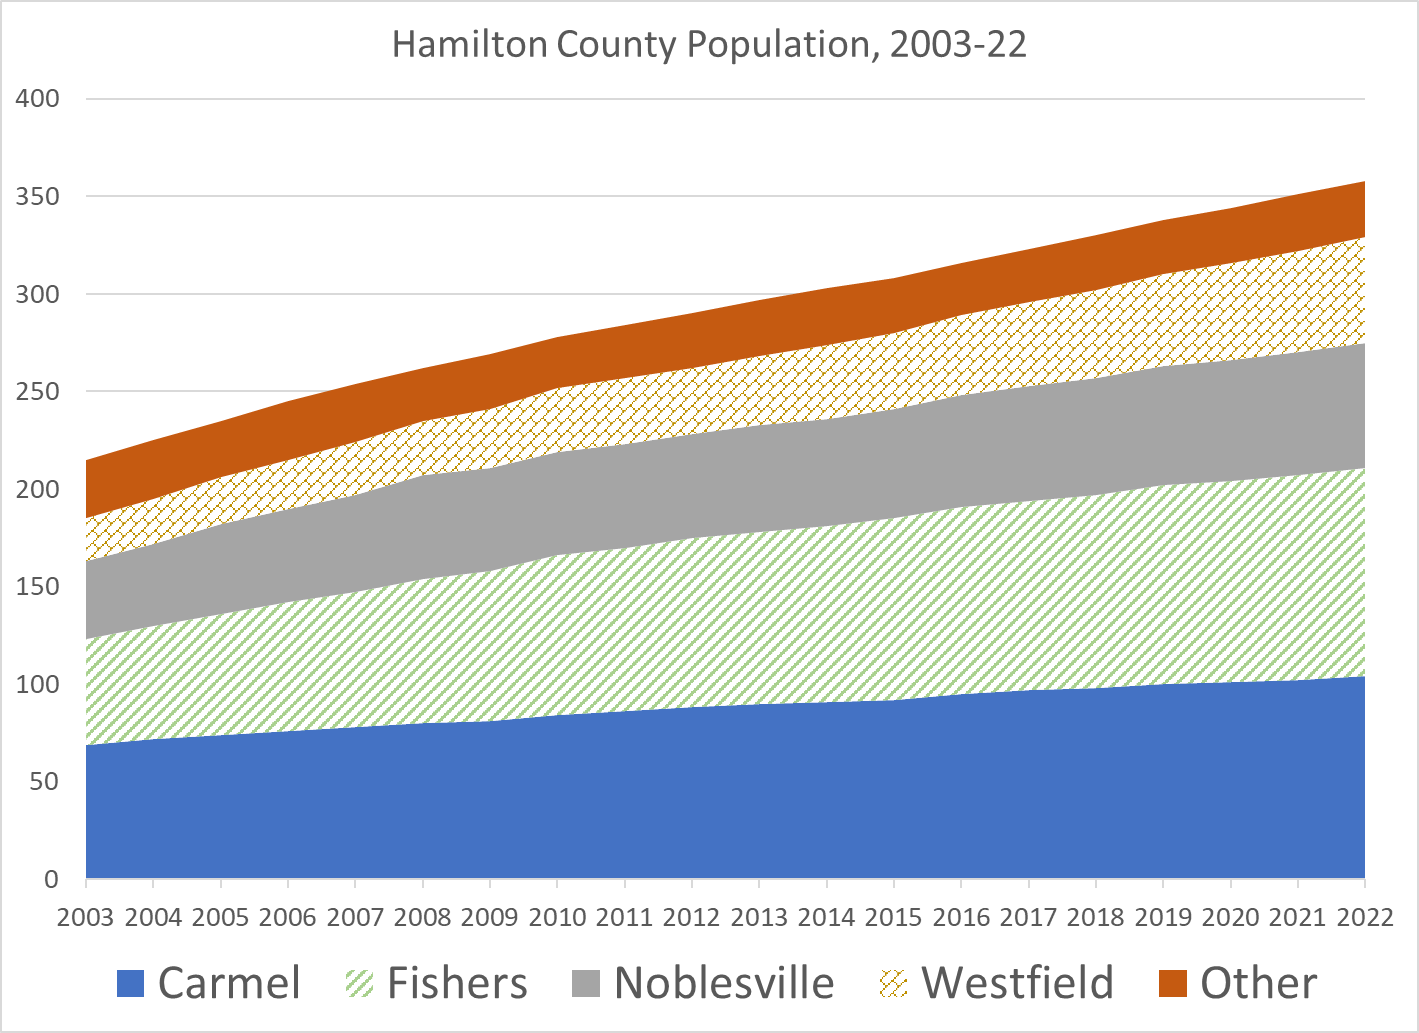
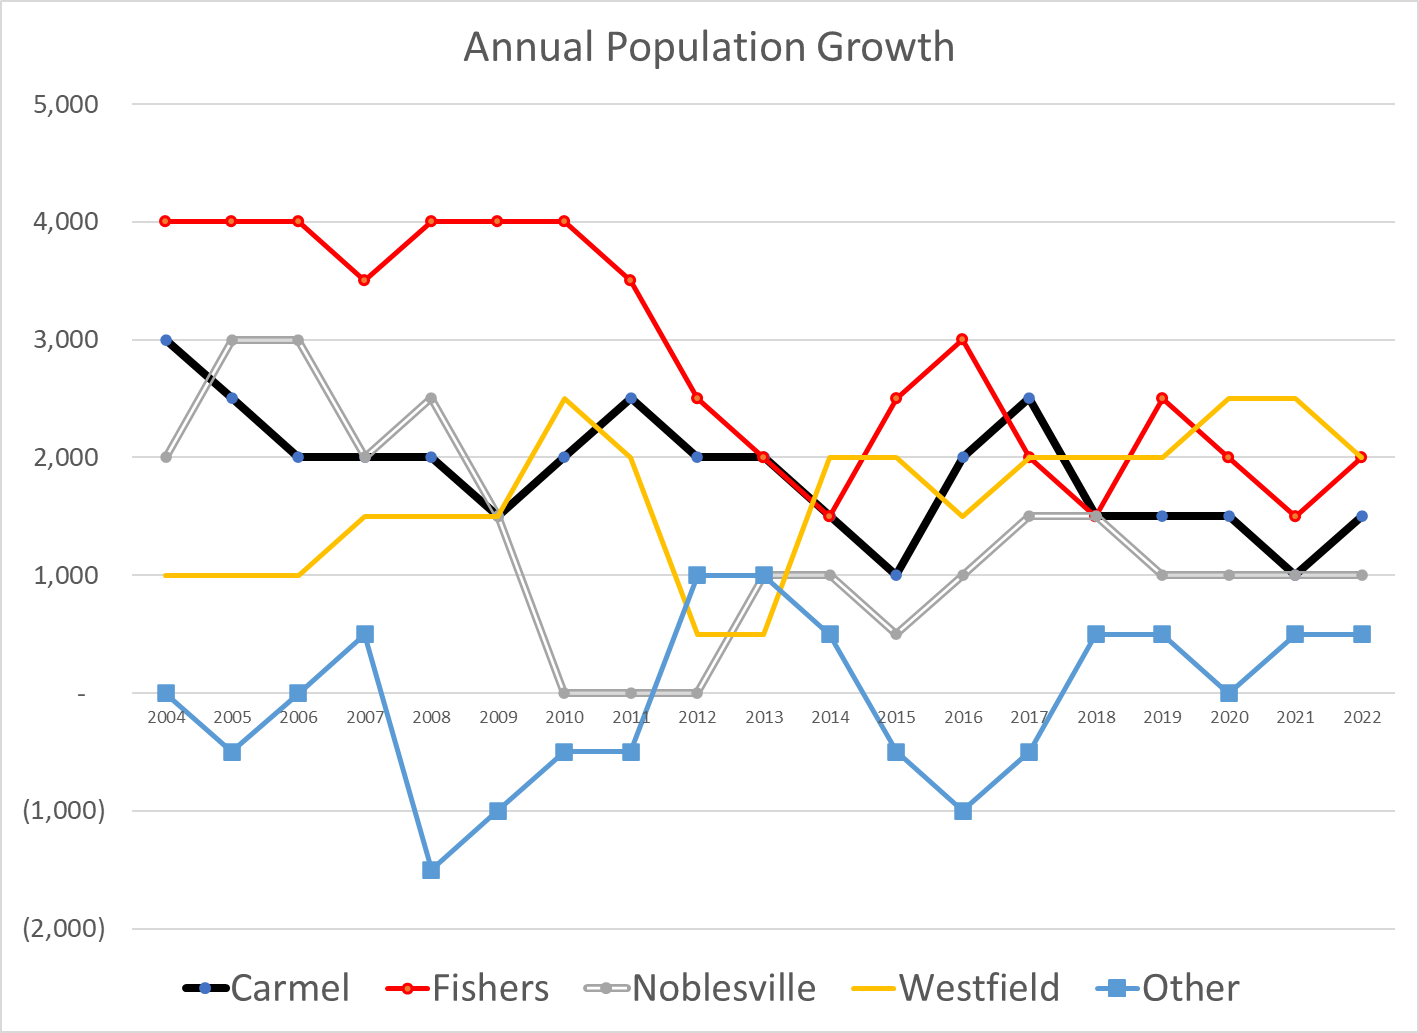
Four major cities contribute to Hamilton County’s rapid growth. Carmel was the early leader. Fishers grew even more rapidly in the 2000’s. Noblesville has continued its steady growth of 1,000 new citizens annually. Westfield has joined Carmel and Fishers in adding 2,000 residents per year, showing a higher percentage growth rate on its lower base.
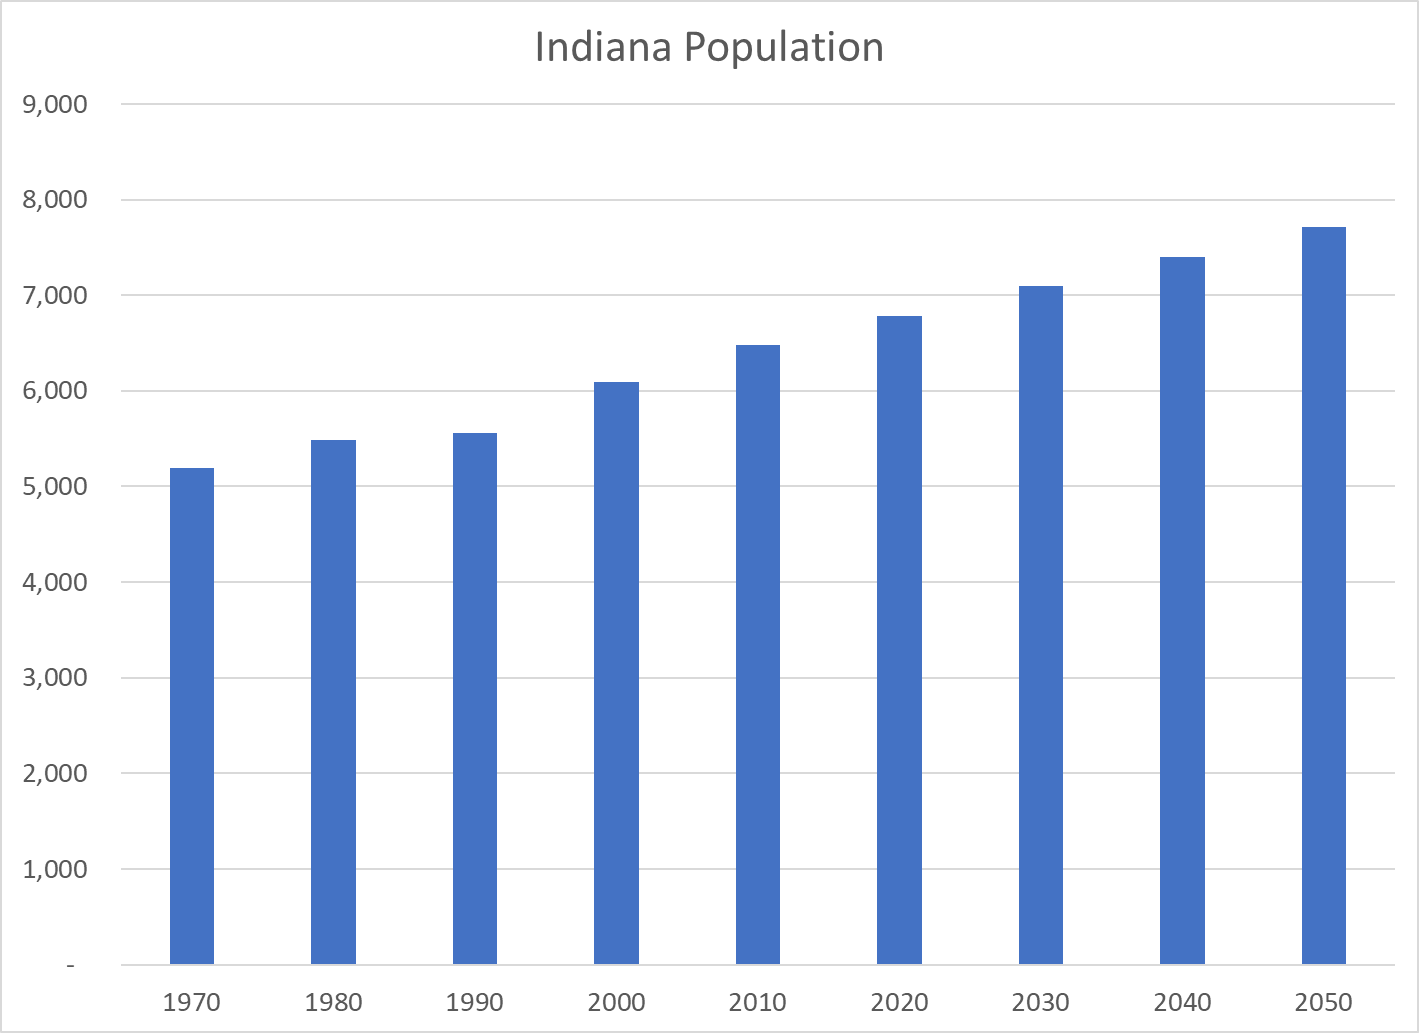
The 2020 census results were significantly higher than the 2018 state of Indiana forecast update. The 2018 forecast shows Hamilton County in 2050 at 528,000 people rather than 567,000 with growth of 180,000 rather than 219,000. It has Indiana at 7.3 million instead of 7.7 million people in 2050.
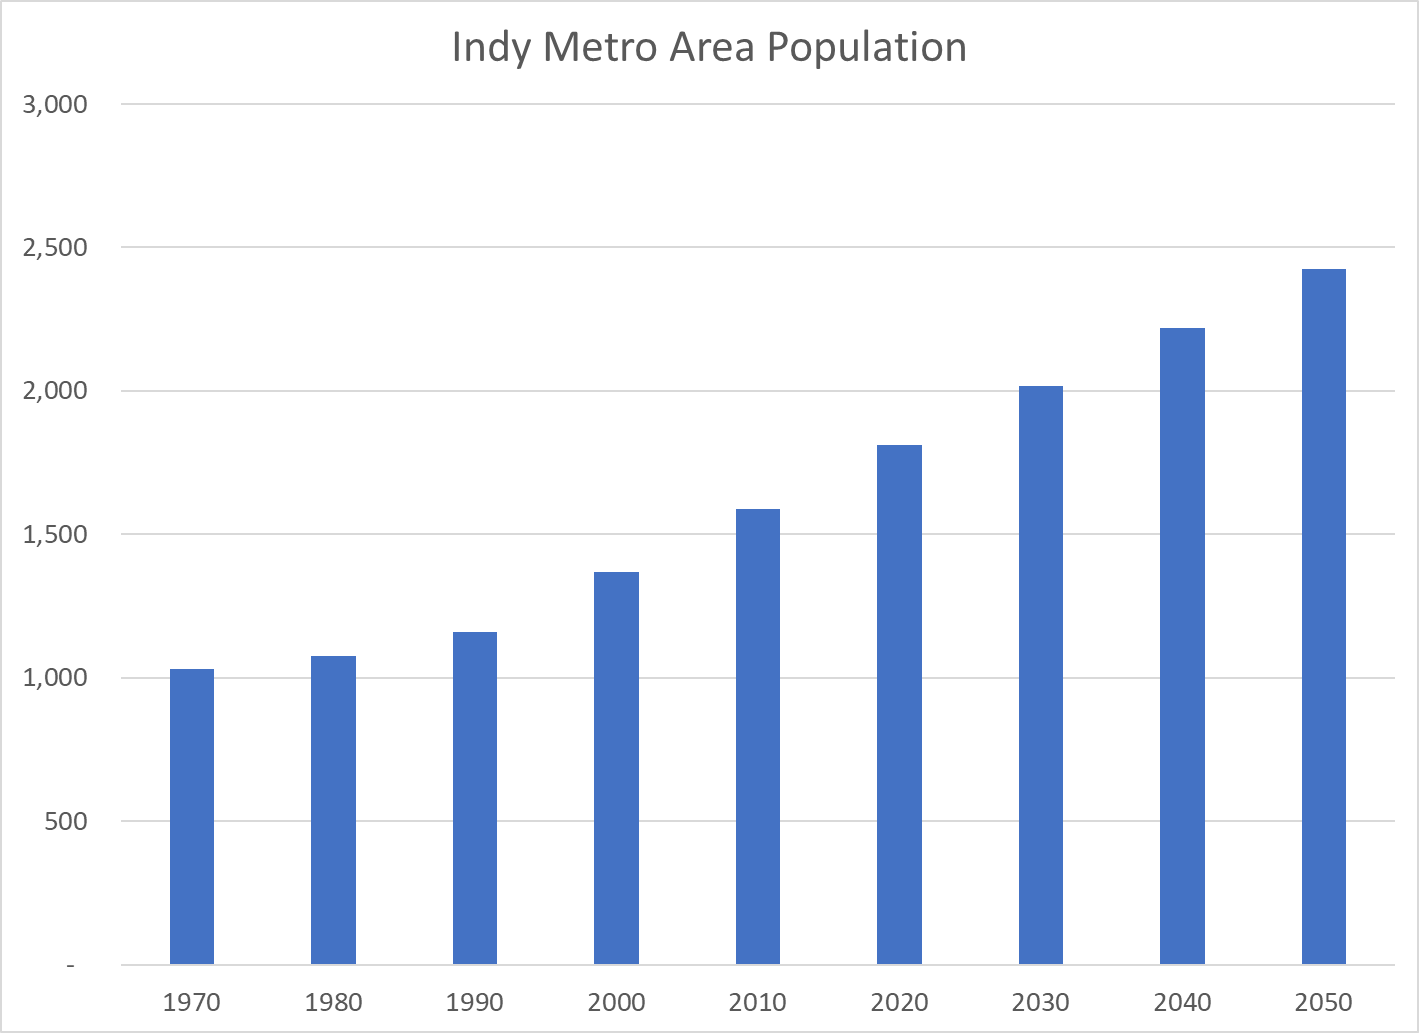
The metropolitan Indianapolis area is expected to continue to experience solid growth rates for the next 3 decades.
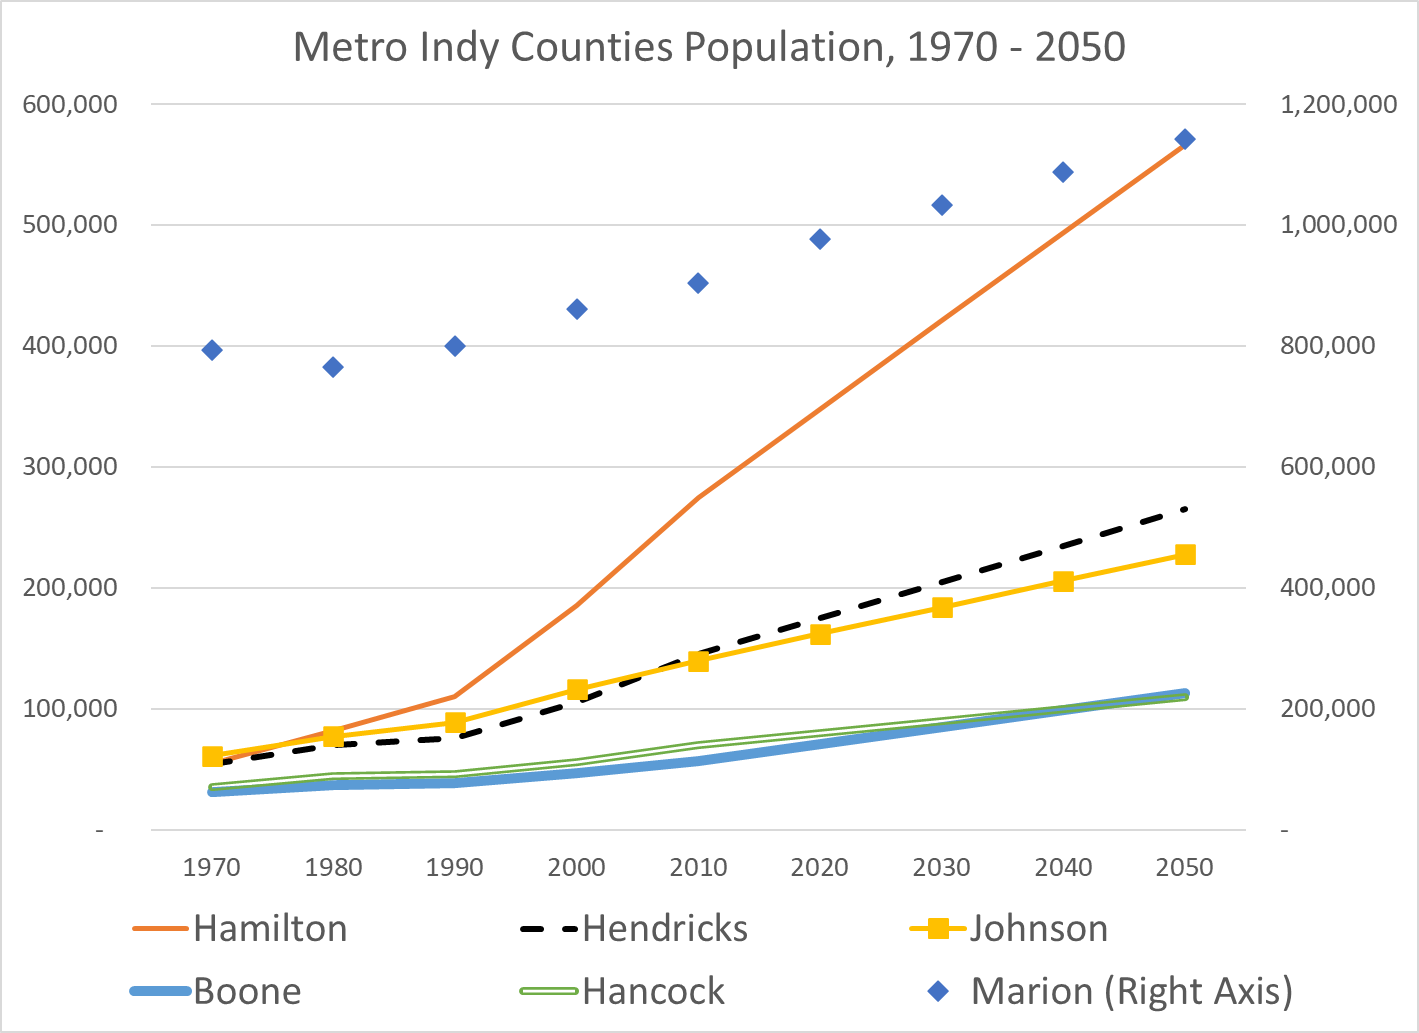
In 1970, Hamilton County had 55,000 citizens and ranked 21st of Indiana’s 92 counties. It doubled in size to 110,000 by 1990, ranking 11th largest and joining Madison, Delaware, Tippecanoe, Vigo and LaPorte as “major” counties. By 2000 Hamilton County contained 185,000 people and was ranked the 6th largest in Indiana. Hamilton continued to grow by 75,000 per decade, passing Elkhart and St. Joseph counties for 4th place by 2010. Based on these trends, Hamilton will pass Allen County by 2030 and Lake County by 2040 to become the second largest Indiana county, trailing only Marion County.
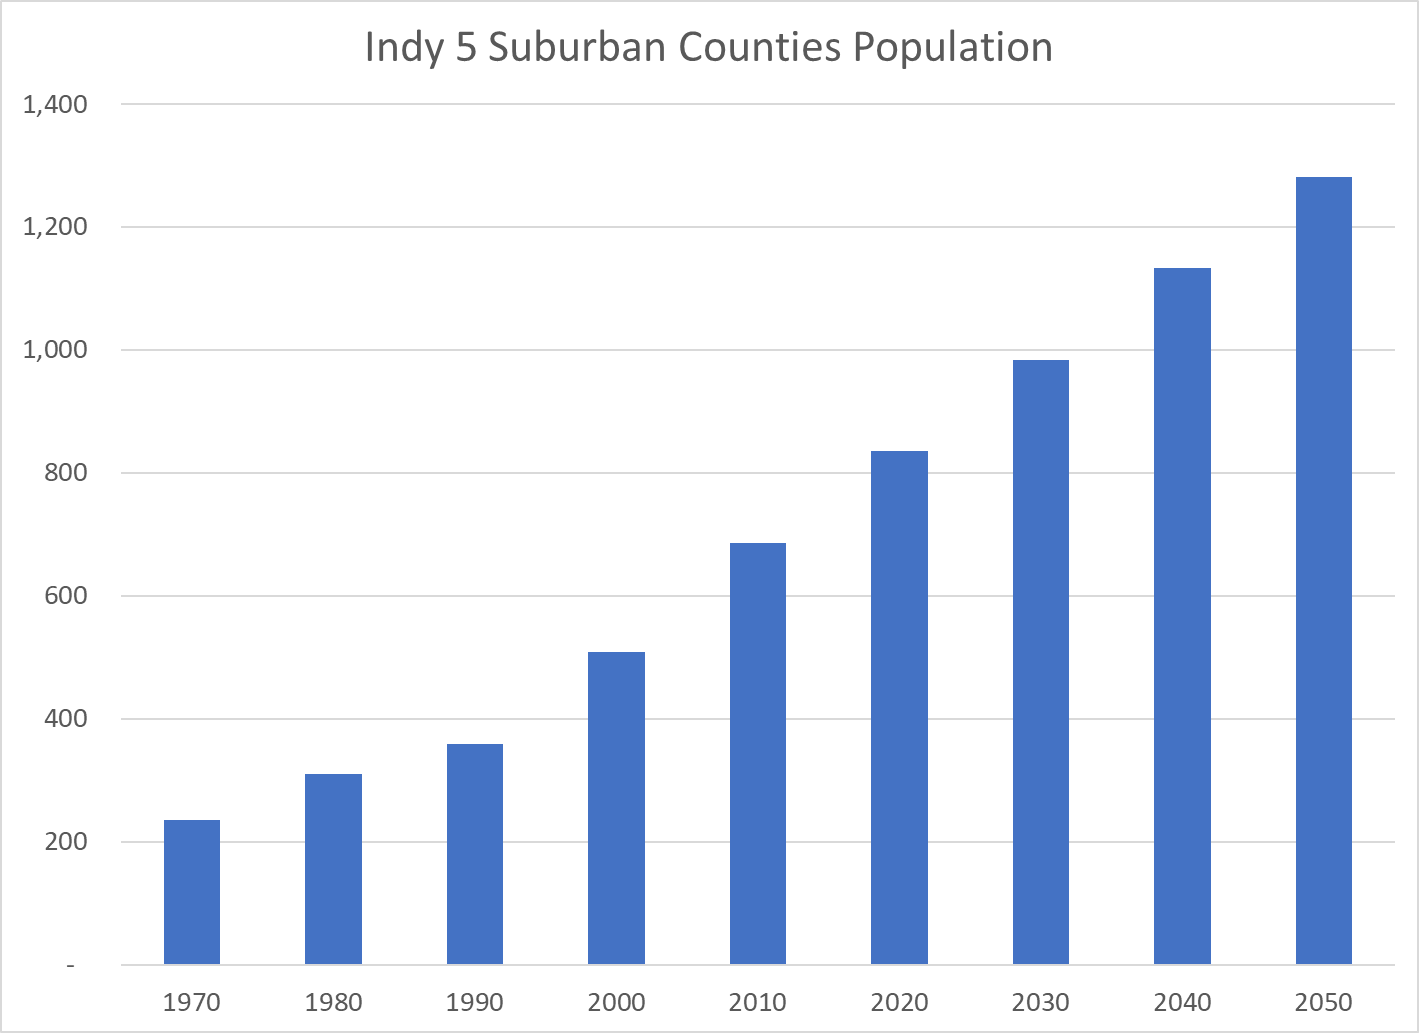
Hamilton County has grown as part of the Indy Metro area. Marion County has averaged growth of 60,000 people in the last 3 decades. Hamilton County is forecast to maintain its 73,000 per decade growth rate. The other four suburban counties are forecast to maintain their combined 80,000 per decade growth rate.
Summary
Hamilton County has enjoyed annual population growth of 7-8,000 for the last 30 years and can reasonably be forecast to continue such growth for the next 30 years. The growth of the Indy Metro area stands out versus slower growing areas in Indiana and the Midwest. Hamilton County’s four major cities continue to attract new residents and the county’s northern areas remain available for managed development within short commuting distances of the existing economic centers throughout the county. Economic growth has a tendency to be self-reinforcing. As Hamilton County approaches one-half million residents it will focus more on “managing” such growth.
The last official forecast of Indiana’s population was made in 2012, estimating growth from 6.5M in 2010 to 7.5M in 2050. The actual population was a little higher than this forecast in 2020. My forecast is for 7.7M in 2050.
Indiana was and is an agriculture and manufacturing intensive state. Population growth slowed in the 1970’s and 1980’s before recovering in the 1990’s. Indiana added 1.2M people in the 30 years from 1990 to 2020, growing by 7% per decade, about one-half of the national average, but faster than its neighbors.
I expect the 2010-2020 growth levels to continue for the next 3 decades.
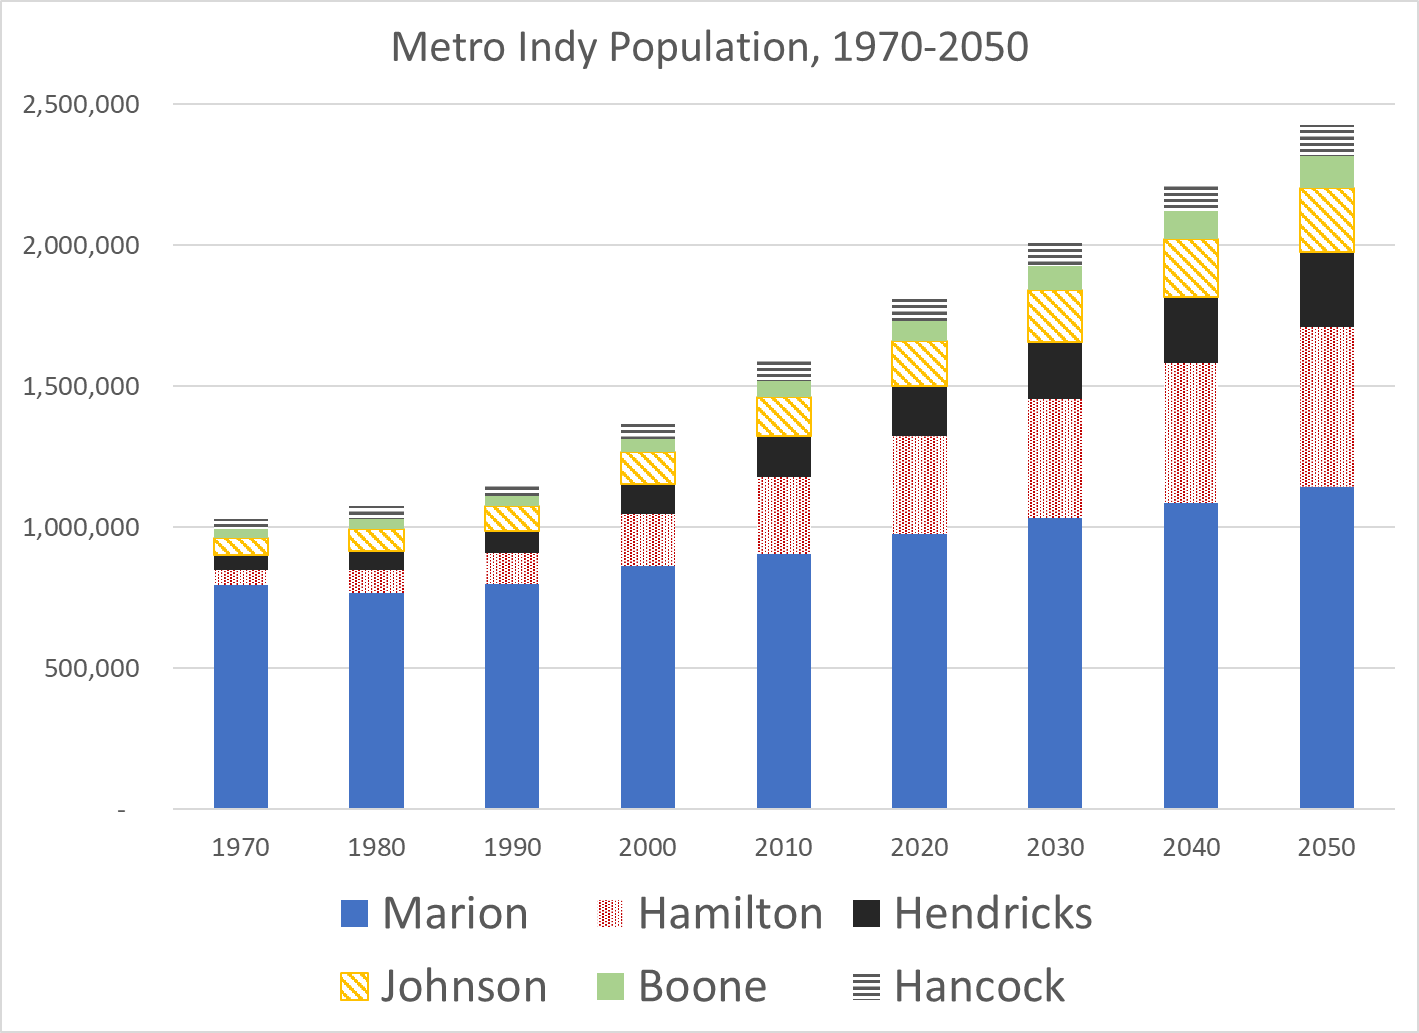
Indianapolis (Marion County) is the only major city in Indiana. It was also manufacturing intensive at the end of the 20th century. Its population growth stagnated in the 1980’s and 1990’s before recovering.
Indy’s suburbs were immaterial in 1970, but have grown to be nearly as large as the main city in 2020.
The total Indy metro area grew by 80% from 1990 to 2020 and is expected to grow at the same rate for the next few decades.
Like metro areas across the country, Indianapolis has grown much faster than the rural counties of Indiana.
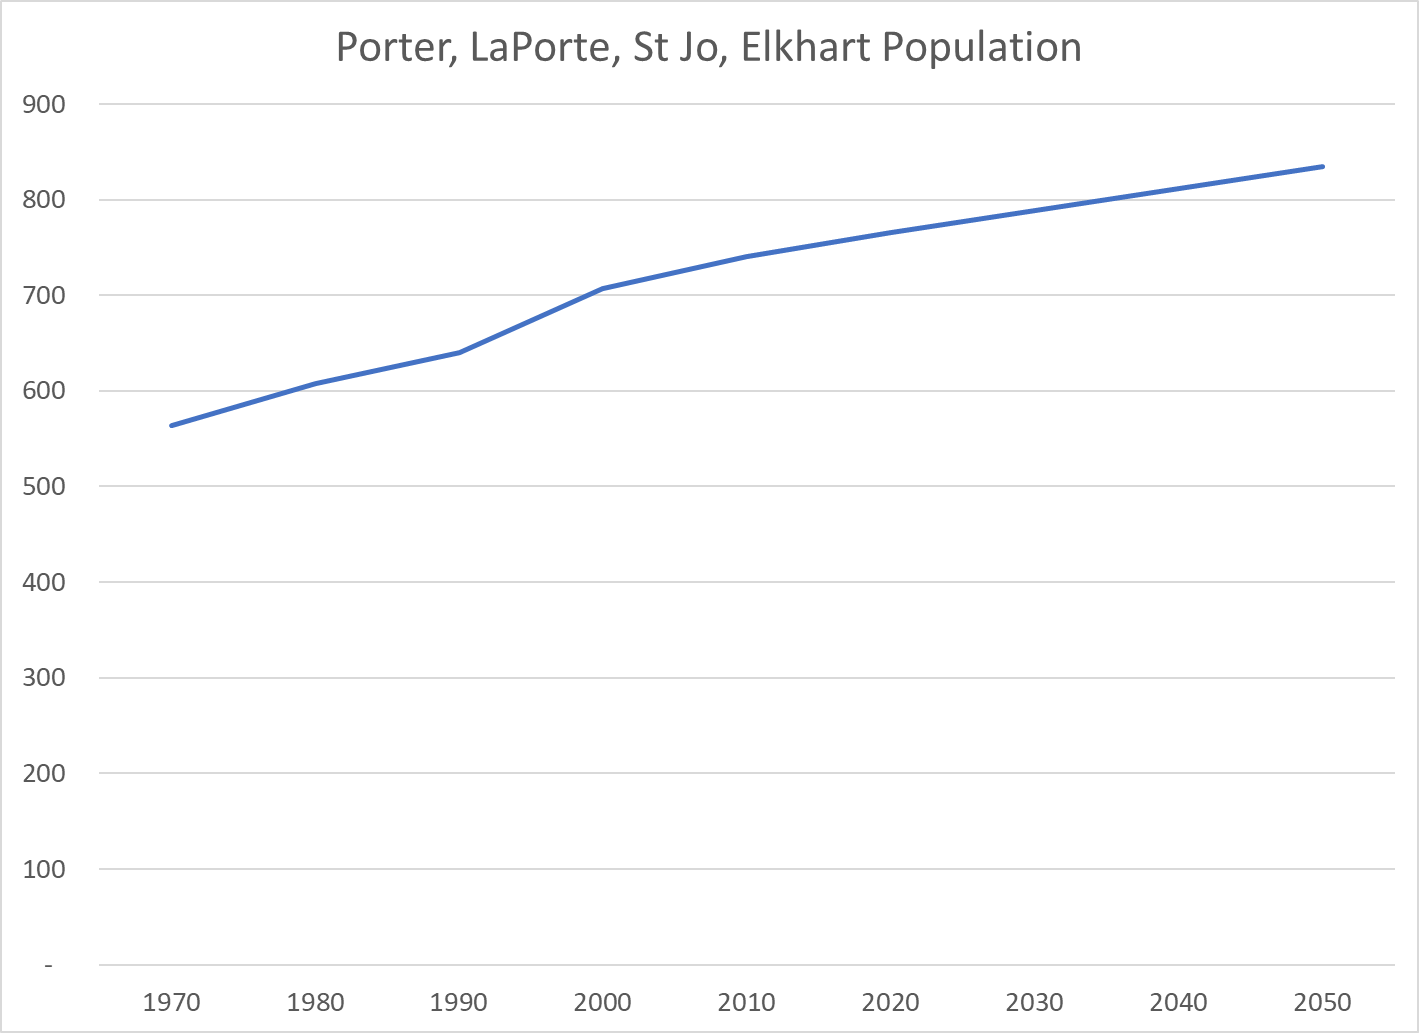
Lake County (Gary) in the northwest corner of Indiana is the second largest metro area of Indiana. Its population dropped drastically from 1970 to 1990 and has slowly recovered. This manufacturing intensive area is not considered a highly attractive Chicago suburb, but it has found sources of growth.
The four counties east of Lake County are a separate economic area and have grown since 1970 at a reasonable pace.
The I-90 corridor’s population was the same size as metro Indianapolis from 1970-1990, but their growth paths diverged afterwards.
Historically, Ft Wayne has been the third largest Indiana city. It was also a manufacturing leader, which slowed its growth in the 1980’s and 1990’s. It has since recovered and established a strong growth rate.
Indiana has 6 other minor cities that have collectively accelerated their growth since 1990. Tippecanoe and Monroe Counties benefit from their state universities. Columbus (Bartholomew) is a manufacturing leader supported by its proximity to IU and Indianapolis. Clark County is a suburb of Louisville. Evansville (Vanderburgh) has struggled to find a new economic engine due to its small size and remote location, despite the extension of I-69. Terre Haute (Vigo) has also been slow to find new engines of growth to replace its historic manufacturing strengths.
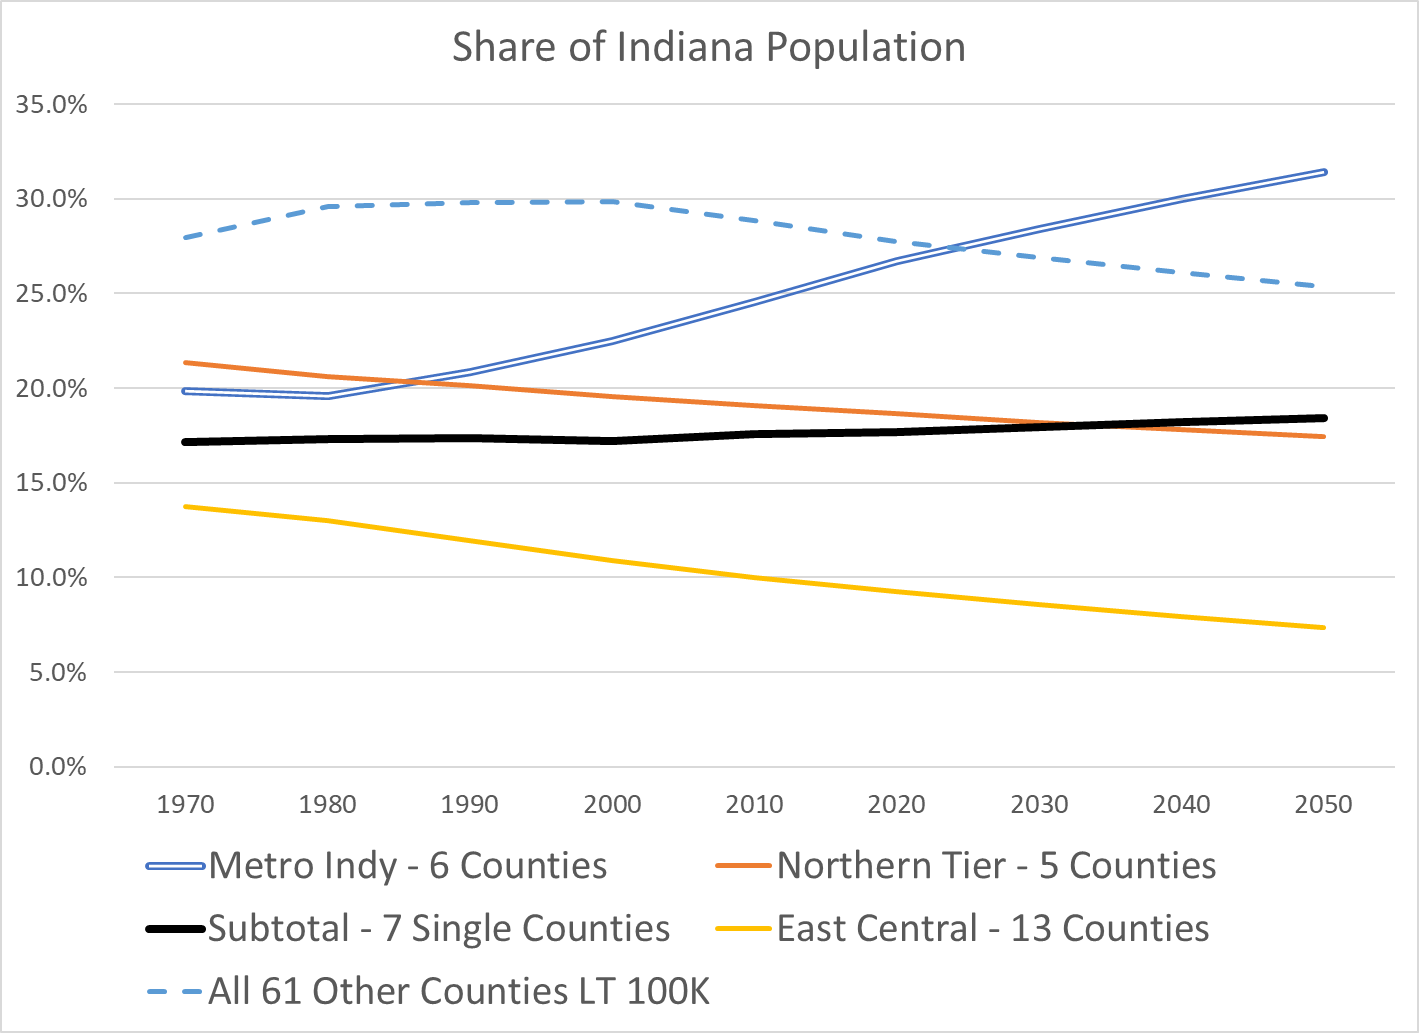
These 18 larger counties (of 92) have collectively driven almost all of the population growth in Indiana for the last 30 years. These trends are expected to continue for the next 30 years.
A broad swath of 13 counties north, east and northeast of Indianapolis have seen population declines in the last half century and will likely experience further declines. The natural gas boom, Wabash River transportation advantage and national road (US 40, I-70) advantage drove manufacturing in these areas in the early twentieth century. General Motors grew and then declined. The Ball Corporation grew and declined. Muncie was the subject of the famous Middletown sociology studies of the typical American community and this area, and the greater Indianapolis area have remained targets of marketing and political research studies. Logansport, Peru and Wabash along the river. Marion, Anderson and Muncie. Hartford City, Portland, Randolph, Richmond, Connersville, Newcastle and Rushville. The 61 other Indiana agricultural counties managed to grow slowly from 1970 to 2000 but found their limits afterwards.
In the modern world, local economies must find “critical mass” in order to succeed. Metro Indy is doing well. The I-90 corridor near Notre Dame is surviving as are the other mini-metro areas. The other 74 counties are stagnant.
Since WW II, the US and the world have been on a tear, inventing at a pace never seen before. We have dozens of breakthroughs in basic science/materials, medicine/biotechnology, space, electronics, computers, networks, the internet and artificial intelligence. I’ve set aside advances in business processes and pure science, math, social sciences, philosophy and the humanities. I’m not addressing the potential costs and risks of a more technologically advanced civilization. I just want to briefly outline the major technical innovations of the last 75 years. I have grouped them into 3 buckets: traditional industries, medicine and computers.
The computer advances account for 54 of the 115 items, a little less than one-half. There are 21 hardware and network items, about one-sixth of the total (18%). Software broadly defined to include the internet and artificial intelligence sum to 33 items, a solid 3 out of 10 (29%). The 22 medical innovations represent roughly one-sixth of the total (19%). The 39 traditional, historical areas combine for one-third of the inventions.
I won’t describe the innovations in detail. I’ll append web links at the bottom which provide thumbnail sketches of this history and its importance. I expect that my readers know and use these innovations. I’m attempting to summarize then in order to provide perspective. The dominance of computer and communications advances is the biggest takeaway. I expect to see both incremental advances in each category and innovative combinations of computer software, communications, medicine and basic science in the next 25 years.
Agriculture
The green revolution, high yield varieties of rice and other crops
Electricity generation, turbines, batteries, electric motors.
Steam engine, turbine.
Internal combustion engine, automobile, tractor.
Railroad, locomotive.
Anesthesia.
Distilled oil products, diesel, kerosene and gasoline.
Telephone.
Circa 1900
Airplane
Automobile
Camera; digital camera
Electric light bulb; fluorescent, LCD, LED
Moving pictures
Phonograph
Radio
Refrigeration
Vaccines
Medical diagnostics: X-Ray; MRI, CT scan
Antibiotics, penicillin
Circa 1950
Electronic computer, Turing machine, personal computer; after arithmetical machines, abacus and slide rule.
Contraceptives
Geographical positioning system, (GPS) and mapping.
Vacuum tubes, integrated circuits, semiconductors and microprocessors.
Nuclear fission, fusion, power and bombs.
Television.
Circa 2000
Genetics, gene editing, DNA.
Mobile phone networks, infrastructure and personal devices.
Internet communications network.
World wide web addressing structure.
Artificial intelligence.
Smartphones.
Summary
The greatest technical innovations of humanity cover a broad range of life: food/cooking, construction, travel, transport, household, finance, science, power, medicine, entertainment and calculation.
We have a dozen major inventions in both of the 19th and 20th centuries. Change appears to be accelerating…