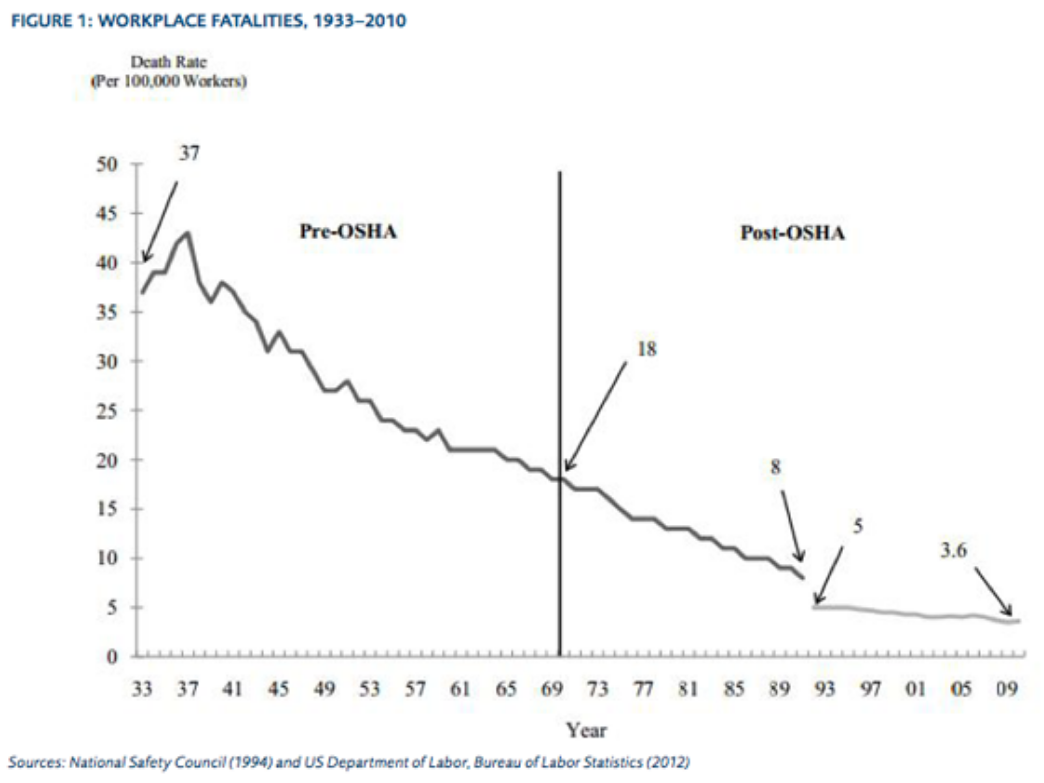
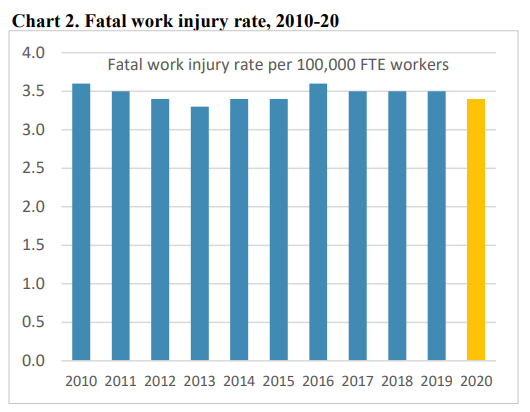
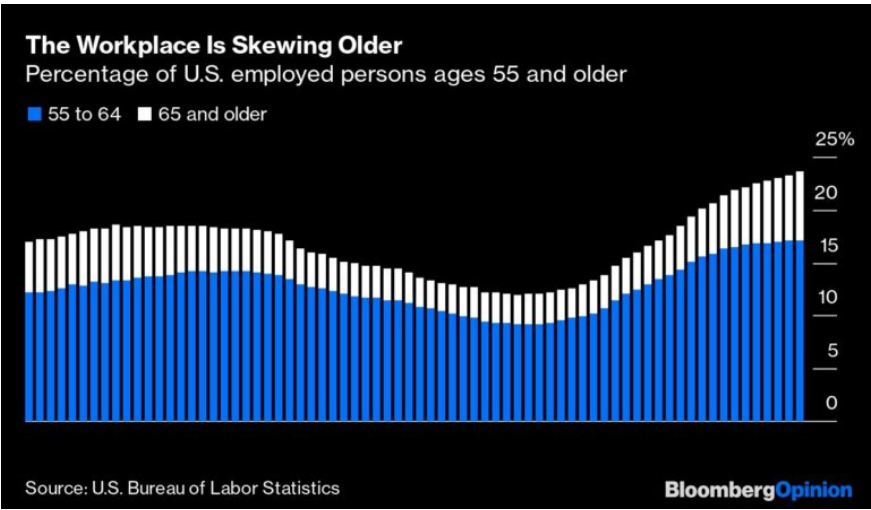
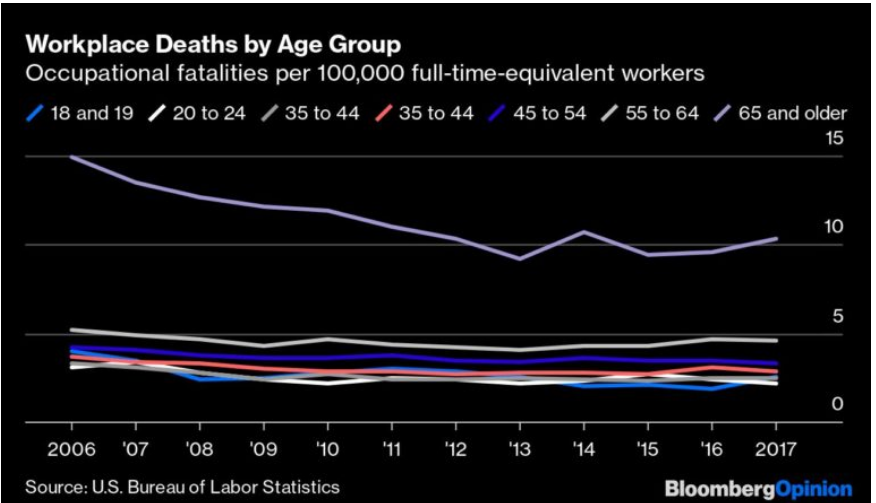
The baby boomers have caused the relatively higher death rate aged 55+ groups to almost double their share of total workers. While the death rate for EACH age group has gone down in the last 20 years, the blended average has been flat for the last decade.
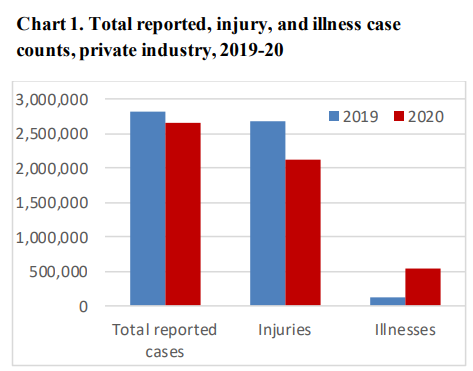
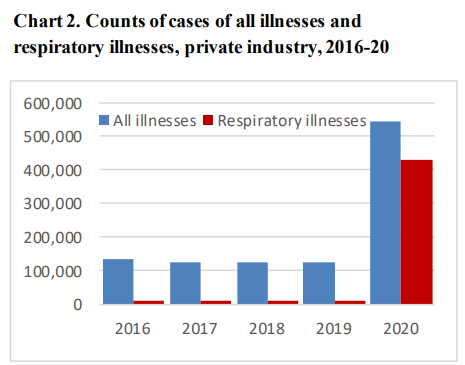
Covid Provided Special Challenges and the Results Could Always Be Even Better
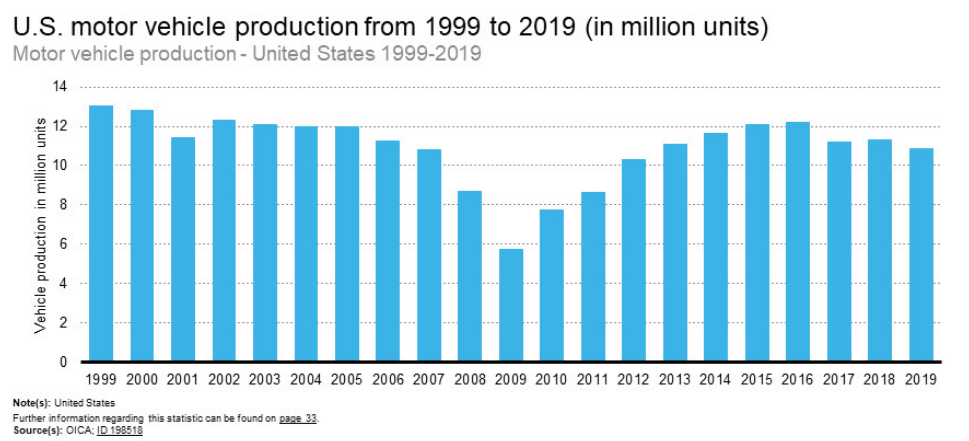
Japanese corporations produce about one-third of US output in the US. They export 400,000 vehicles from the US. Three-fourths of Japanese brand cars sold in the US are produced in the US. Japanese cars, on average, have more US (domestic) content than so-called American made cars.
6-month time limit. A dozen or less bipartisan dignitaries. Retired ambassadors, investors, CEO’s, federal reserve presidents, etc. Make Mitch Daniels the chair.
Assign 2 projects. One to cut government waste. The other anti-inflation policies. No more than a dozen recommendations in each half. Presented to congress for simple yes/no vote, without major amendments allowed.
2. Spend Less Government Money
Fiscal spending is too expansionary for the current situation. Back off. Reduce infrastructure spending for now, spend it in the next recession. Reduce marginal defense programs that only have political reasons. Cut state government spending by 3%, which is budgeted to increased by 9%.
Increase immigration to improve labor supply. Cut tariffs to reduce supplies costs. Lean on local regulators to reduce zoning restraints and one size fits all building codes. Strategically require a higher share of affordable housing and multifamily permits annually in each metropolitan region. Phase-out the mortgage interest tax deduction for second homes.
Loosen regulations for 5 years to encourage increased “all of the above supplies” energy through drilling, coal, oil and nuclear. Suspend federal gas tax for 3 years. Negotiate oil price minimums/maximums between US/Europe/Japan and OPEC.
Reducing inflation is a complicated policy area. The solutions proposed by “experts” are rarely politically appealing. Competing political parties hesitate to provide “wins” to the other. However, 8% inflation after a 2-year pandemic while the US faces Russian war actions is a “national emergency”, worthy of an FDR like approach to “try a few things”. It is an opportunity to overcome individual industry opposition to things that make sense for the country. It is an opportunity to try some left and right solutions.
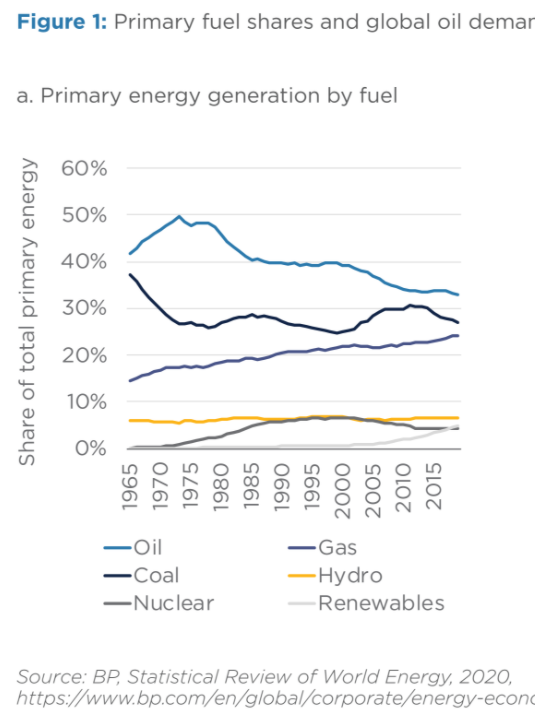
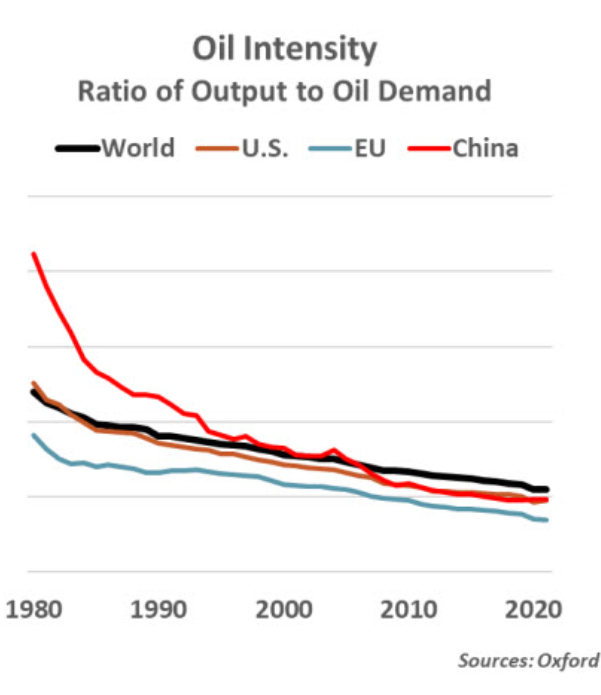
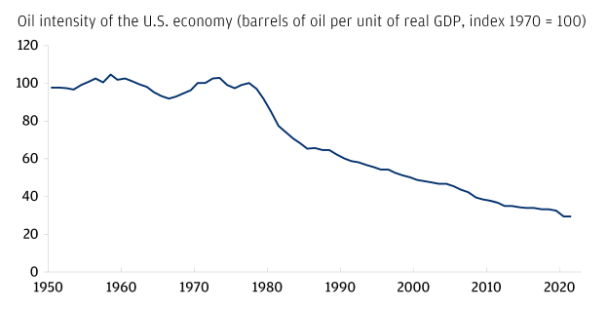
Energy intensity is down as the service economy becomes a greater share of GDP, energy efficiency improves for consumer and industrial uses, electricity power grows with its inherently higher efficiency, and renewable energy grows as a source of power.
Finally, individual country risks still matter: Russia, Iran, Venezuela and Saudi Arabia.
Summary
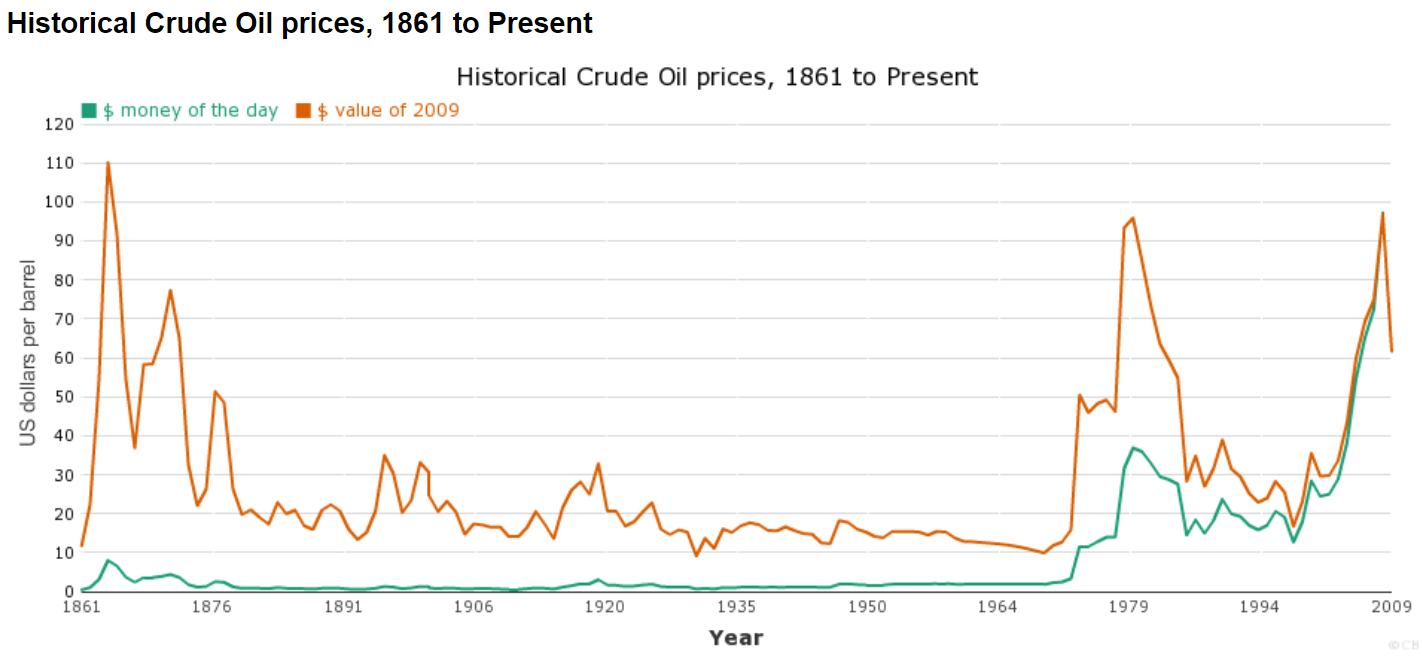
The Oil Shocks of the 1970’s were due to a drastic shift in the pricing power of the OPEC countries following 30 years of greatly accelerated global demand for oil while it was priced attractively. Demand and supply have both grown in the last 50 years. The role of oil in the global and US economies (compared with real output/GDP) has dropped by more than one-half. Increased oil prices can and will have a significant effect today, but less than one-half of that in the past. Long-run trends indicate that the role of oil as a critical resource will continue to decline, although there remain risks as the world closes coal and nuclear power plants and makes the investments required for a renewable energy world.
Typical vehicle age increased by one-quarter, from 9.6 to 12.1 years since 2002.
Typical vehicle age increased by more than one-half from 7.8 years in 1990.
Typical vehicle age more than doubled from just 5.3 years in 1969.
The rate of increase has remained relatively constant, with improved highways, driving, designs, quality and maintenance allowing the average age to increase by 1 year every 7-8 years.
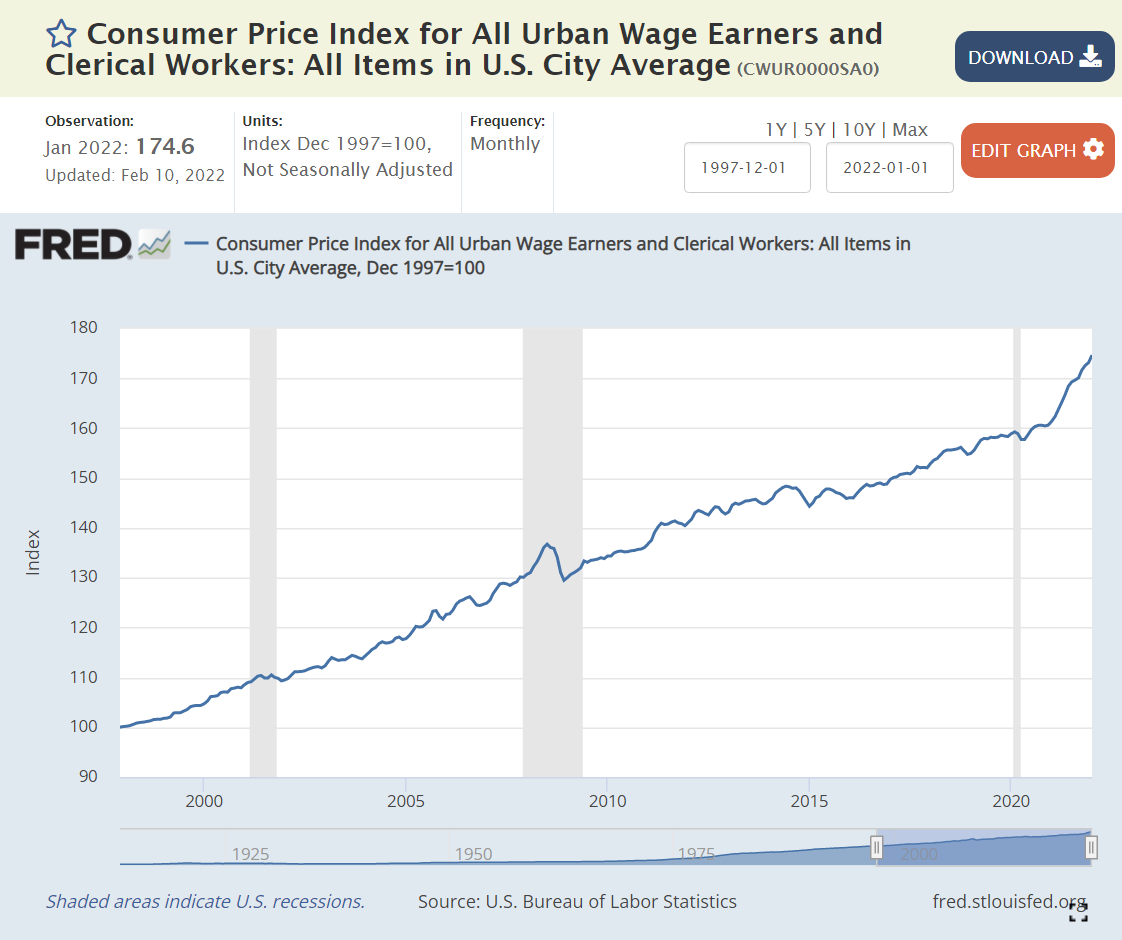
Inflation is back in the news after several quiet decades. The components of the All Urban Wage Earners and Clerical Workers are listed above, comparing Feb 2020 with a 1997 base of 100, and then Jan 2022 with the same base. The most recent weighting of categories is in the rightmost column.
Overall, consumer prices have risen by a modest 2-2.5% annually, just 59% through Feb 2020 and 75% through Jan 2022. Yes, that is a 10% price increase in the last 2 years: 175/159.
The 3 largest components have shown price rises close to the overall average. The biggest sector, Housing (39%), displays slightly higher inflation, at 72% and 85%, closer to 3% annually, with a possibility of higher rises for the next few years. Transportation (22%) reveals lower than 2% annual inflation with a 45% increase across the full period. Food and Beverage (15%) is close to the average with 64% and 82% growth.
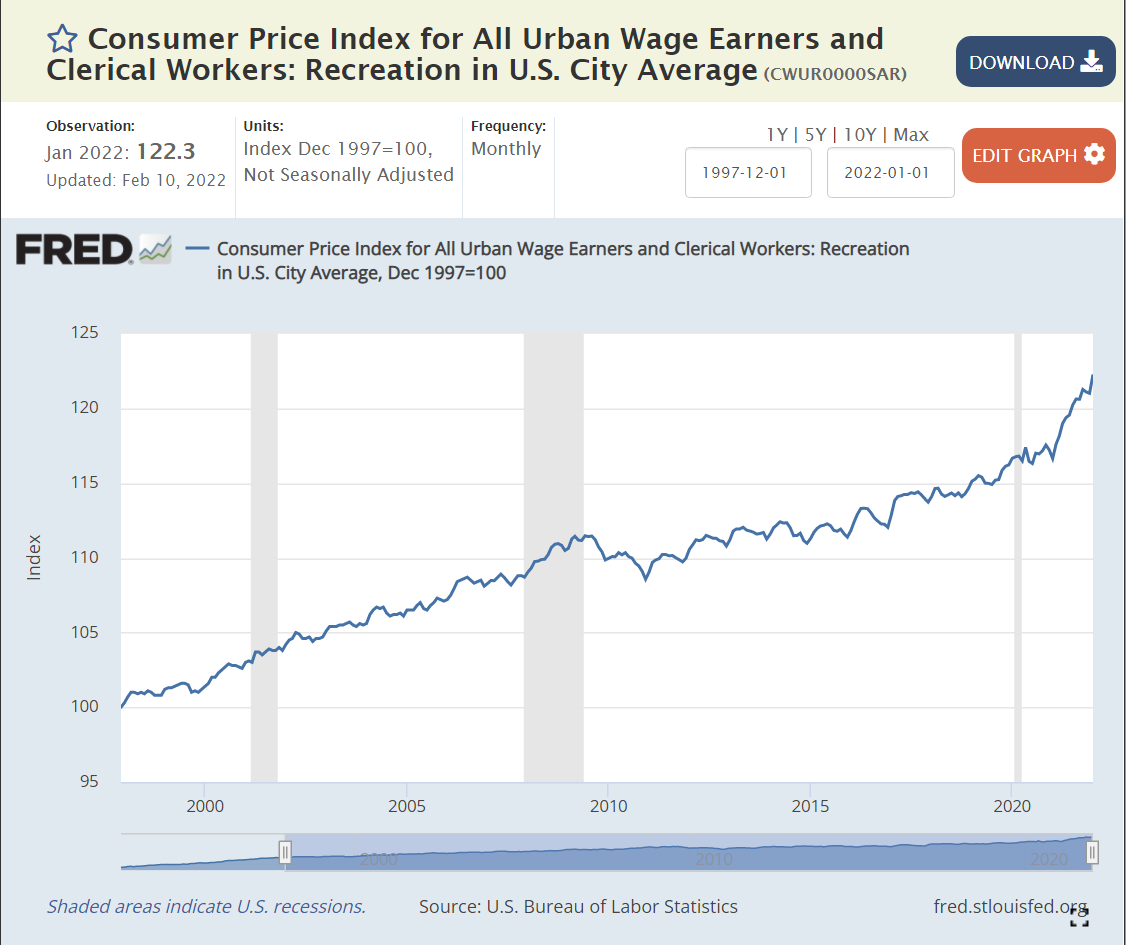
Some smaller areas have seen slow price growth. Apparel (3%) has declined in actual prices during this period. Recreation prices (4%) have grown by less than 1% annually.
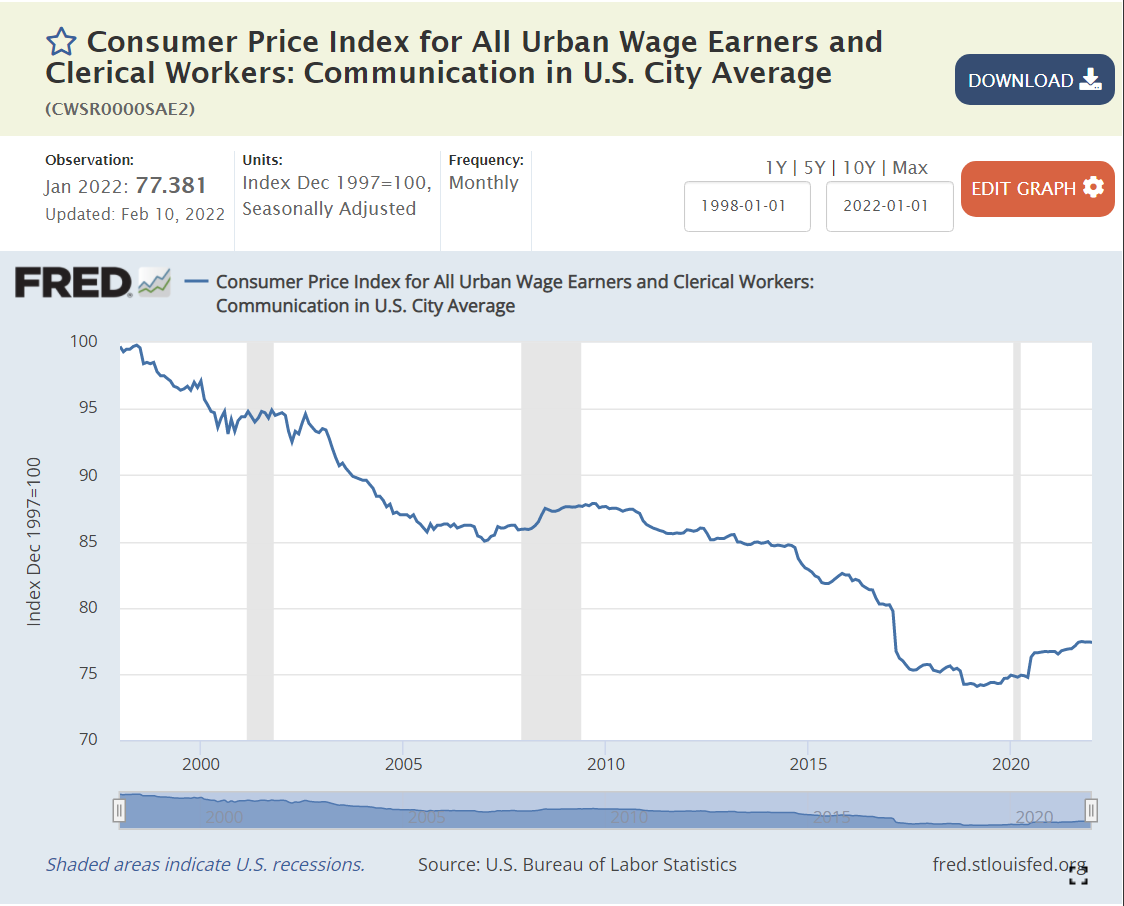
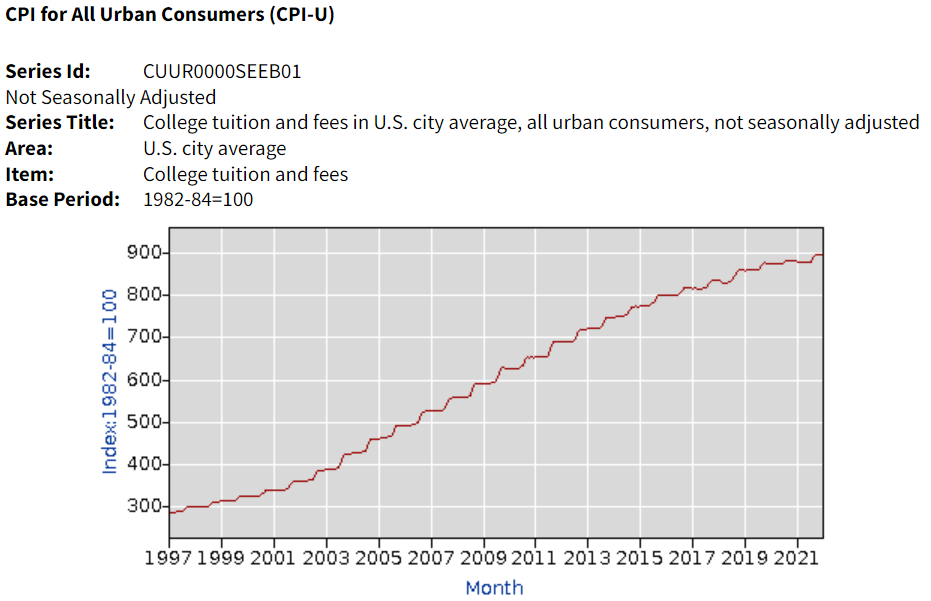
Education and Information (6%) prices have grown by 1% annually, but this category includes 3 very different subsectors. Information Technology prices have declined throughout the period. No simple 25- year summary is available. Communications prices have dropped by an average of 1% annually. Education prices have grown much faster, more than offsetting the decline in IT and communications prices. The Tuition, Fees and Child Care measure of prices increased by 165% and 171%, more than twice as fast as overall inflation, roughly 4% annually. College tuition (data not in Fred database) increased by 191% and 196%, about 4.5% per year.
The Other Goods and Services (3%) category mostly contains miscellaneous items that don’t fit cleanly in Housing or Food/Beverage. The category displays faster price increases (3.5%) on average due to the very sharp increase in Tobacco prices (taxes) which have grown 4-fold in 25 years (7%/year). Note that alcoholic beverage prices increased by a little more than 2% annually
Finally, Medical Care (7%) has grown by 116% – 125% during these 25 years, about 3.5% annually.
Overall goods prices have grown slowly and service prices more rapidly. Medical care and college prices stand out for their increases, while the price of housing/rentals is flashing warning signs.
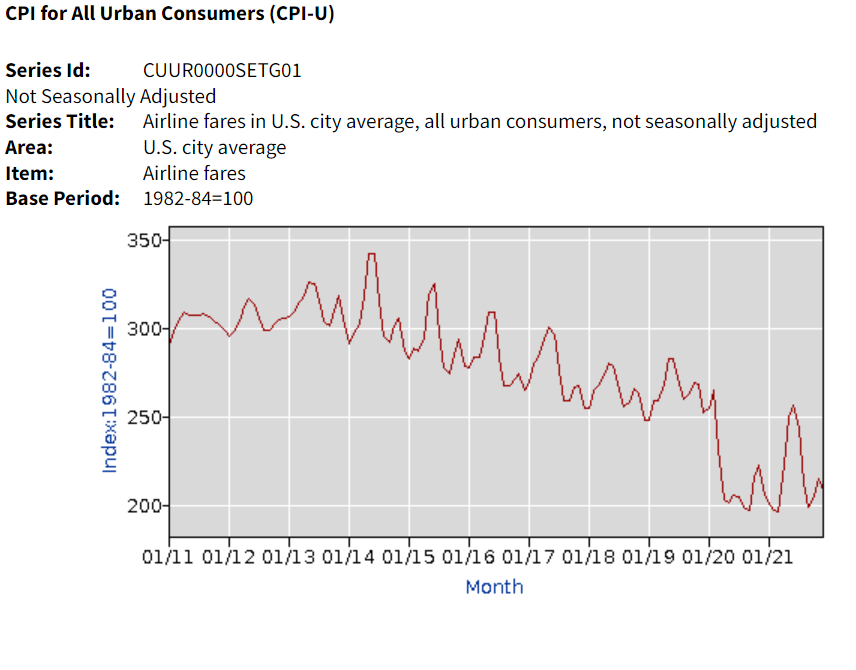
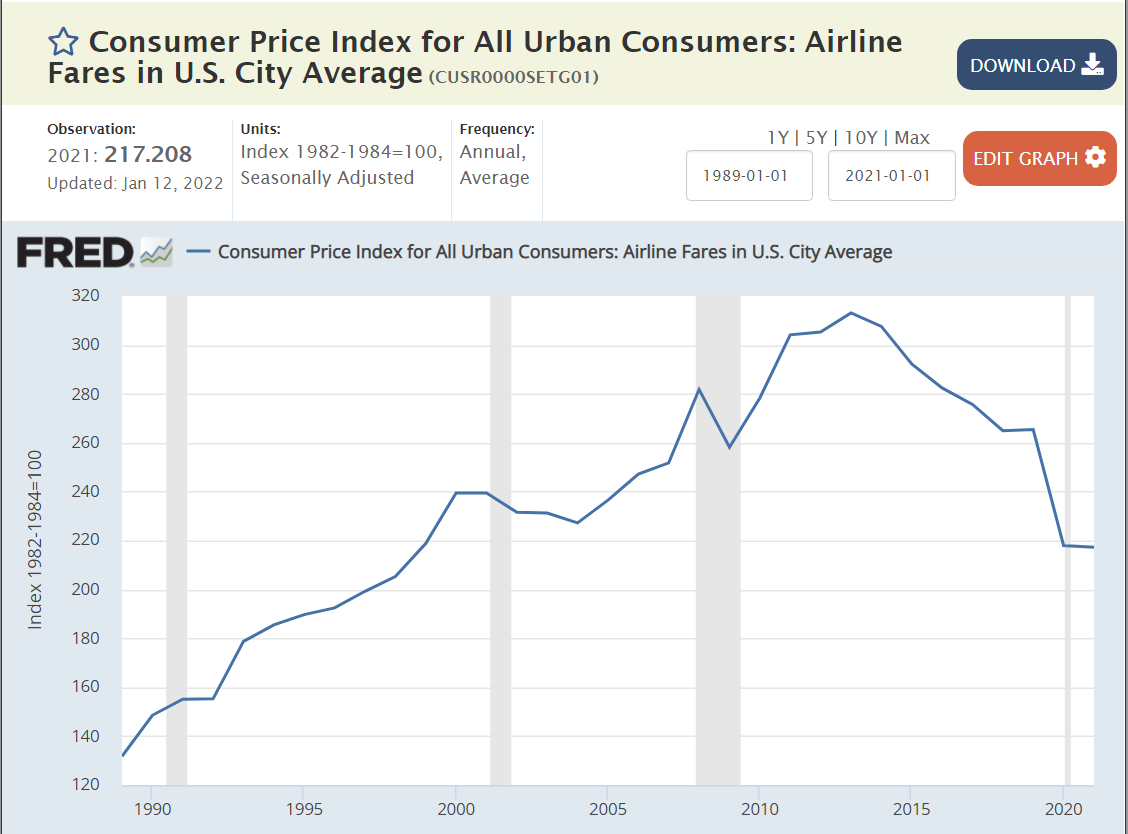
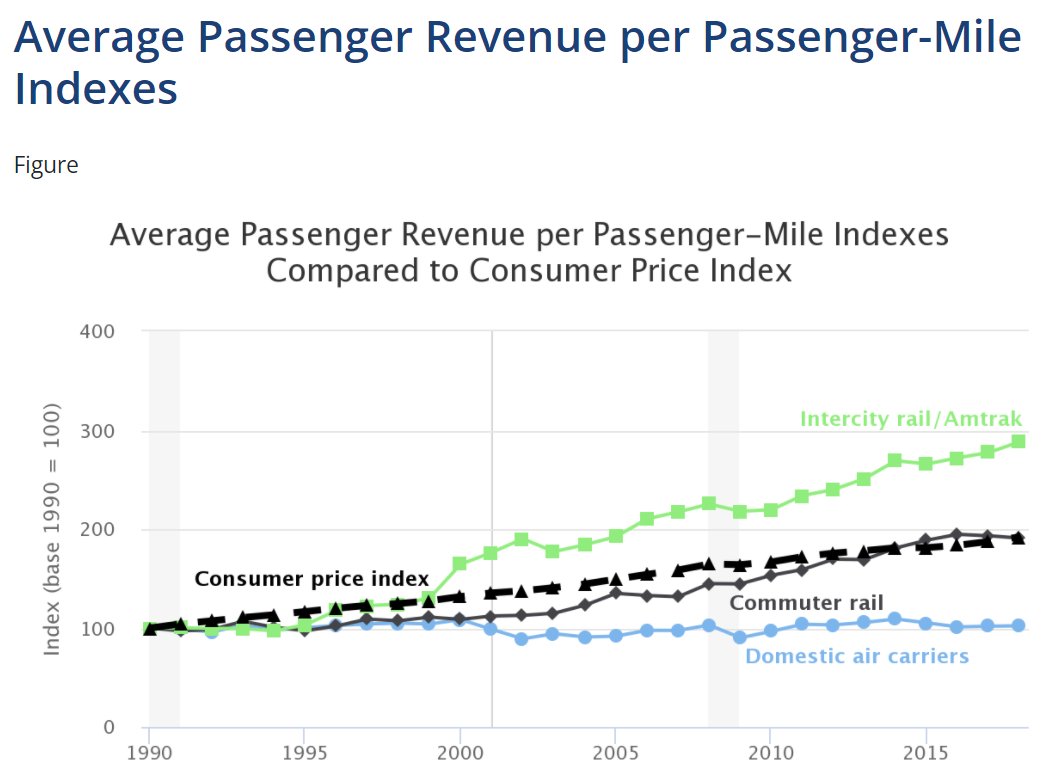
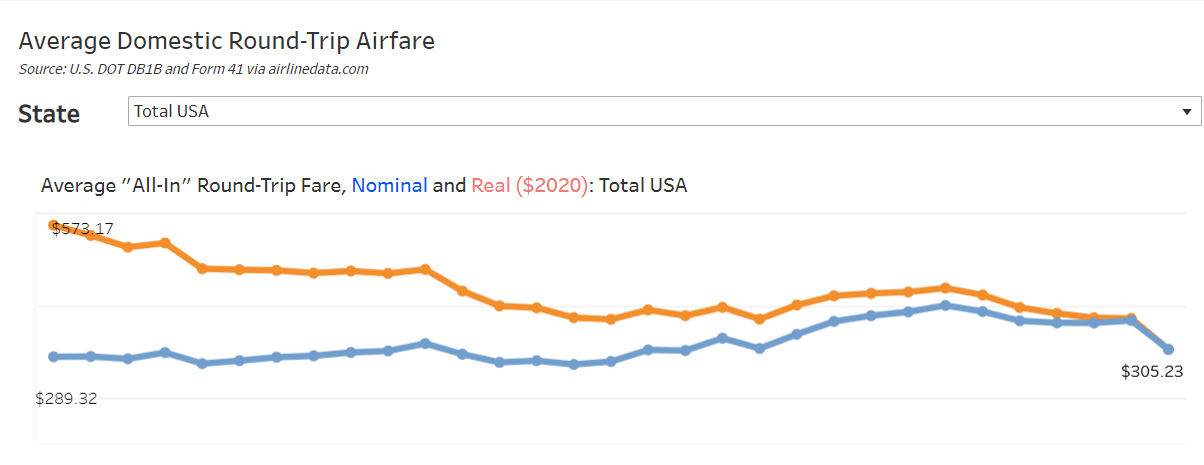
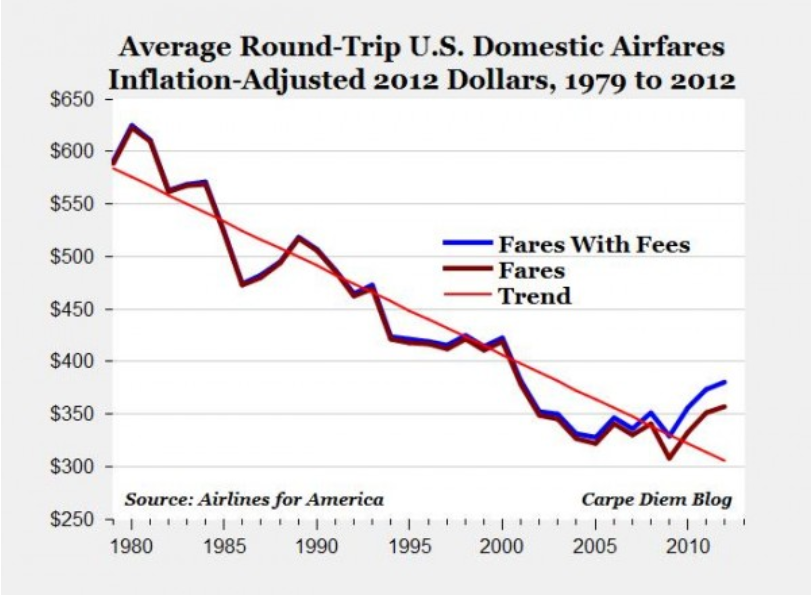
This article combines data from 4 sources with slightly different data. Airfares were flat at the end of the 20th century, but then dropped by 19% by 2004. They remained flat, in real terms, through 2009. Airlines pushed through 8% higher prices in 2010-11 and maintained real fares at the same level through 2014. After 19 years, real airfares were 14% lower than in 1995.
Fares then dropped year after year through 2019, reaching 26% below the 1995 baseline. They have fallen further in the pandemic years to 43% below the level of 25 years ago.
Bureau of Labor Statistics / CPI
The Bureau of Labor Statistics compiles a consumer price index for air travel as part of the overall CPI. It compiles average prices and tries to adjust for changes in the quality of the product.
Real airfares declined consistently throughout the period, but no data source is fully compatible with the 4 summarized above. It appears that the real cost of flying declined by about one-third between 1979 and 1995 as the airline industry was deregulated.
I’ve been flying for business and pleasure for more than 40 years. I’d like to share some of my favorite domestic and international airports.
Cleveland Burke Lakefront: steps from downtown; my boss Ron Diderich used to fly here daily from DTW in 1982.
Sarasota: My first landing in 1974; so much busier today where Sue and I have our winter home.
Indy Exec Airport. I served on the local airport board for 8 years.
Boston Logan is a major NE hub with an ocean approach which I first experienced landing in 1975.
Mackinac Island is a small airport with varied service.
Chicago Midway Airport
Chicago’s Midway Airport is a Southwest hub and used to be a hub for Indy’s American TransAir (ATA). The airport is in a 1 x 1 mile block in Chicago with a very short 5,200 foot long main runway.
New York is a huge US hub; enjoy a Newark approach.
Maui (’nuff said).
Key West; Another Island Paradise
San Diego; more exciting landing than expected.
San Francisco; I observed this approach from the front seat in 1998.
Washington, DC: Reagan. The greatest mainstream US airport approach, every time.
Aspen, CO. A mountain approach and a very exciting takeoff.
Tokyo.
Nice, France.
Old Hong Kong Airport (I first experienced in 1997).