There are few policy choices that have 90-95% positive results compared with 5-10% negative results. Cutting international trade tariffs is one of those “rare birds”.
President Trump “delivered” on his 2016 campaign promises regarding trade deals. He unilaterally increased tariffs on imported aluminum, steel and manufactured goods from China and the rest of the world, including our trade and military allies. As with most “trade killers” (which used to be a minority Democratic party position), he claimed that this would save or restore American jobs. As usual, it had no measurable positive effect. He also claimed that this would lead to a renaissance in American manufacturing. Didn’t happen. He claimed that these actions would make America more self-sufficient in critical military and economic areas. Didn’t happen. Note pandemic issues. Finally, he claimed that these actions would form the basis for “new and improved” trade deals to replace the “awful” deals negotiated by Democrats and Republicans alike for 70 years in the post- WWII era. NAFTA 2 was concluded with minor changes. Small China commitments were obtained to buy things China wanted to buy. But, mostly the response was “HUGE” retaliatory tariffs from China and our allies.
https://en.wikipedia.org/wiki/Trump_tariffs
https://www.npr.org/2021/11/27/1054293073/whiskey-distilleries-europe-tariffs-lift
The “root cause” of the failed results in this situation, and in most other trade fights, is a logical / intellectual error. Proponents of trade restrictions believe that bilateral trade negotiations are a simple “win/lose” game. A real estate deal is a simple “win/lose” game. Bilateral trade deals are more complex. There are many winners and losers in both countries, some direct and some indirect. Higher tariffs or trade restrictions benefit the importing country’s manufacturers and their employees. However, these tariffs typically result in much higher prices for the importing country’s consumers, so the net effect for the importing country is negative. Unfortunately, bilateral trade deals or actions often don’t even help the importing country’s producers. Whatever country is “next most” competitive takes the place of the target country which has been made less competitive by the new tariffs. In the case where a country holds a large share of the global market, neither the “next best” country, nor the domestic producers benefit. The “target” country has such a strong competitive, cost, price advantage that even with added tariffs they are the preferred supplier. This is a very disappointing result for those who wish to take direct action to “save jobs”, but global markets truly matter.
Columnists, journalists and politicians say that Joe can’t reverse the tariffs for political reasons. The American voting public is too unsophisticated to understand complex trade logic. Given Trump’s framing of his actions, this will look like a capitulation to China. The progressive left doesn’t believe in “free” international trade, which undercuts worker’s pay and the environment. American “labor” is a required part of the Democratic Party coalition and opposes “free” trade. Consumers do not link tariffs to goods inflation. American business and agriculture are fully committed to the Republican Party, so will not repay beneficial actions.
https://www.cnbc.com/2021/11/30/removing-us-china-trade-tariffs-would-ease-inflation-jacob-lew.html
https://www.cnn.com/2021/10/03/politics/global-supply-chain-collapse-biden-tariffs/index.html
The American people elect leaders (of either party) to lead. Step up. The benefits of “free trade” are well known, well documented and supported by 90% of professional economists of both parties. Assign Kamala Harris, Pette Buttigieg and Jared Kushner (just kidding) to develop the communications plan for this policy decision.
The American People Benefit Directly: Taxes, Inflation and Jobs
Tariffs are simply taxes with a longer name. Exporters pay a small share, less than one-third of the total. Importing firms pay a slightly larger share, again less than one-third of the total. Consumers typically pay more than one-half of the tariffs in the form of higher prices. This is a tax, plain and simple. Estimates of the taxes paid by Americans for the Trump Tariffs range from $50-80B.
https://www.americanactionforum.org/research/the-total-cost-of-tariffs/
Tariffs provide importers with an excuse, reason, justification to increase prices. This is contributing to the current round of inflation at a level last seen in the 1980s. American consumers are paying $700 annually for these taxes.
https://www.cnn.com/2021/03/24/politics/china-tariffs-biden-policy/index.html
Tariffs are imposed to “save jobs”, but the “indirect” impact is usually larger than the “direct” impact. Domestic manufacturers who use imported products find their costs to be higher and some become uncompetitive. Domestic retailers who now sell more expensive products find their sales lower and reduce their work force accordingly. Target countries impose retaliatory tariffs on domestic export products. This is the main source of job losses. The Trump Tariffs are estimated to have cost Americans 250,000 jobs.
https://carnegieendowment.org/chinafinancialmarkets/83746
https://www.cnn.com/2021/03/24/politics/china-tariffs-biden-policy/index.html
Make American Businesses More Competitive Globally
American businesses pay one-fifth to one-third of the $80B of annual tariffs imposed. This drops straight to the bottom-line. Reduced profits result in reduced capital investments, R&D, product innovation and new markets.
Tariff administration has an overhead cost and it distracts supply chain, logistics and international trade staff from higher value added work.
Tariffs require profit-maximizing firms to accelerate their consideration of import sourcing and domestic production options. Some of this has a minor impact. Some of this activity displaces other higher value-added sourcing projects.
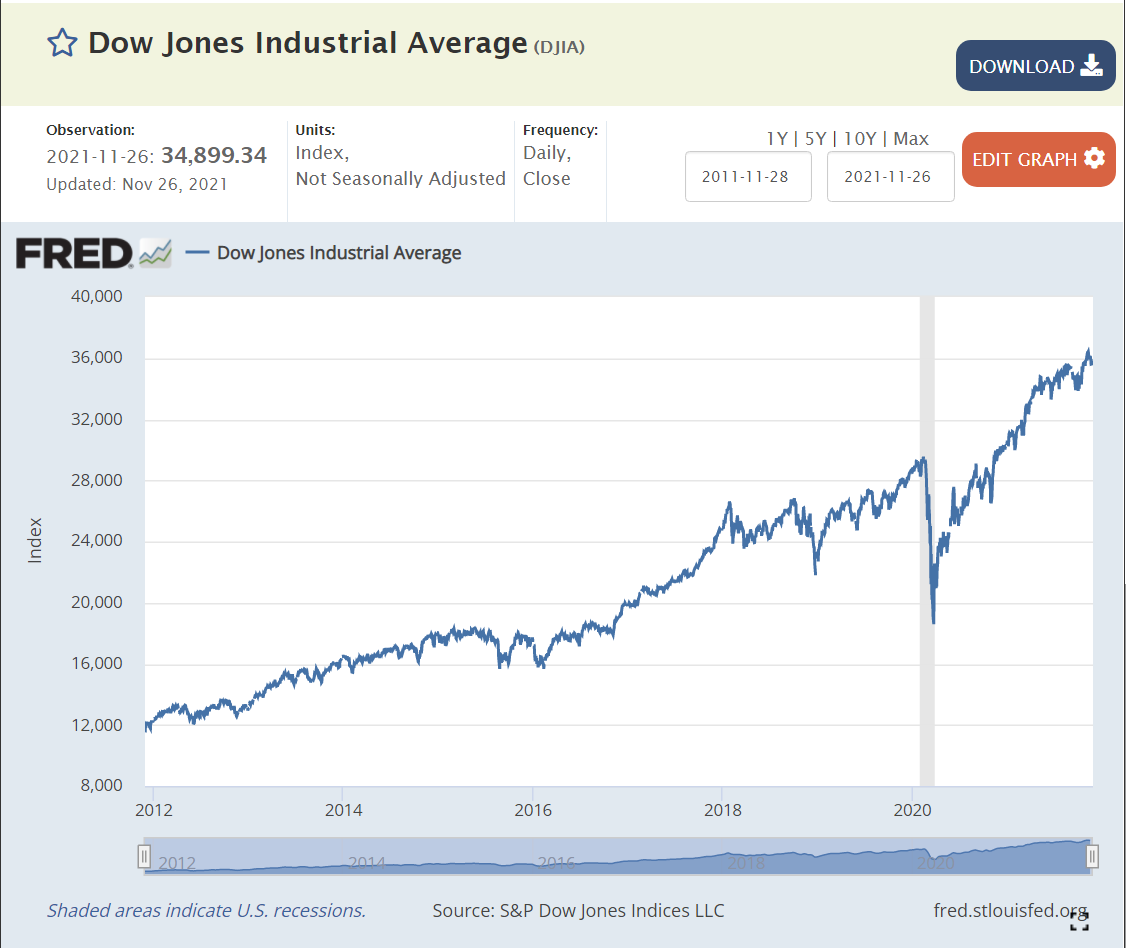
One estimate indicated that 8% of stock market value was destroyed by the Trump Tariffs.
Sharply higher tariffs disrupt existing supply chain relationships and remove some sources as economically feasible sources. In a time of supply chain challenges, tariff make a bad situation even worse.
Farmers were most negatively impacted by the Trump Tariffs. Trump provided temporary subsidies to offset some of the pain, but farmers complained that they were seeing decades old trade lanes being permanently disrupted. Reduced tariffs and reduced retaliatory tariffs might restore these natural trade lanes.
https://www.npr.org/2021/11/27/1054293073/whiskey-distilleries-europe-tariffs-lift
Resume American Trade Leadership that Benefits America
Revert to the 70 year bipartisan American “free trade” strategy that delivered tremendous value for the US and the world. US exports tripled from 4% of GDP in 1955 to 12% in 2007 forward.
https://fred.stlouisfed.org/series/B020RE1Q156NBEA
Restore positive relationships with our historic trading partners.
Re-engage in leadership at the World Trade Organization (WTO) and regional agreements like the Asian Pacific Trade Agreement to establish beneficial trade rules for services and intellectual property.
Conclusion
Reversing the Trump Tariffs can create 250,000 jobs, reverse an $80B consumer tax increase, help American manufacturers and farmers to compete globally, improve supply chain performance, and help the U.S. to craft international trade deals that greatly benefit a country that mostly provides “world class” services.