We’re MUCH Better Off in 2026

Rose Colored Glasses; Man Bites Dog; If it Bleeds it Leads.

Politicians, journalists and influencers of all stripes emphasize the bad, the emotional and the unusual. This burdens us and our society. Allegedly, “it’s bad now, and it was MUCH better in the past”. This eternal NOSTALGIA is a big problem for our society today, leading many people to turn to populists, idealists, authoritarians and charlatans for salvation.

I will outline how much better the United States of America is TODAY than it was in the mid-1970’s. I graduated from high school with the class of 1974. I watched the emotionally mixed American bicentennial celebrations in 1976. I remember Jimmy Carter’s 1979 “malaise” speech in which he said that we, the people, needed to face our challenges directly, especially at a moral level. He was briefly cheered but then criticized for being too negative and pessimistic; an uninspiring leader!

Modern life in the USA is immeasurably better than it was in the 1970’s. It is certainly not perfect. The country has not achieved all that it could have or should have in the last half century. It still faces large global and moral challenges and wonders where it can possibly find the leadership, consensus and engagement to resolve them.

The sheer magnitude of changes in daily life across 50 years is difficult to describe but I hope that my outline will collectively communicate the great scale of improvements we have experienced and the resulting hope and expectation that the next 50 years will deliver the same kinds of positive growth. When we consider the last 50, 100 or 150 years of American life, we should be very optimistic.

Global Threats and Opportunities

  1. The Cold War ended in 1989, relieving the pressure of 4 decades of imminent nuclear destruction. This was a miracle. No war. No revolution. No territories seized. No leaders executed. A quiet end to the threat. The US managed the threat of nuclear terrorism. West Germany embraced East Germany. The European Union welcomed new members. The global economy thrived.
  2. The US established relations with China in 1979, beginning the country’s path to economic prosperity, trade and global influence. The growing trade between China and the world has acted to reduce the threat of conflicts while reducing the cost of goods for all.
  3. The US welcomed the growth of Japan plus the “four tigers” of Hong Kong, Singapore, South Korea, Taiwan, as Asian nations embraced the “Western consensus” of mixed market capitalism, global trade and liberal democracy.
  4. European nations also left behind histories of authoritarian governments or too much socialism to embrace the “Western consensus” and thicken ties through the European Union. Francis Fukuyama prematurely declared “the end of history” but the attractiveness of these successful choices was clear.
  5. The US joined international efforts to reduce tariffs and increase trade leading to a doubling of imports and exports as a share of GDP.
  6. The US adopted a less internationalist position after 9/11/2001, declaring a war on terror, defining the axis of evil, revoking treaty commitments, justifying preemptive war and invading Iraq without UN support. Even with this change, the US largely avoided major military conflicts and losses.
  7. Total immigration to the US grew during this period from 2.3% to 2.9% of the population per decade. Many immigrant groups successfully joined American society.
  8. The US welcomed foreign students to its universities. International tourists increased from 15 to 75 million per year.
  9. The US attempted to resolve the Middle East conflicts with some success, avoiding large scale wars.
  10. The US participated in talks to define and address the threat and impact of global warming. It has taken steps to reduce US carbon emissions.

Politics

  1. Presidents Ford and Carter helped to rebuild confidence in the government after Vietnam and Watergate.
  2. Ronald Reagan established “Conservatism” as a broad political philosophy for the Republican party.
  3. Bill Clinton repositioned Democrats more to the center on economics with his “third way” approach.
  4. Both parties increasingly used wedge issues and either/or choices to polarize parties and choices; although the share of independent voters has grown from 30 to 45%, with the rest evenly split between the two dominant parties.
  5. Perot, Buchannon, Palin and Trump provided social and economic populists with a choice.
  6. The country increasingly accepted racial minorities, women, gays, religious minorities, and immigrants; but the conflict between traditional and modern views was politicized as some could not tolerate the changes and others sought to embed the changes as universal human and legal rights accompanied by social pressures to comply with the dominant “tolerant” view.
  7. Federal government employment was reduced from 5 to 4 million in 50 years, while the population grew by 50%. After Reagan, “government” solutions were inherently suspect. Even Bill Clinton declared “the era of big government” is over.
  8. Total federal, state and local government activities grew a little faster than the economy, with the ratio of tax receipts to GDP inching up from 29% to 32%. The ongoing pressure to “cut spending, taxes and regulations” could not defeat the pressures to address social, political and economic issues and interests.
  9. The top marginal income tax rate was reduced from 70% in 1982 and has remained just under 40% since 1987. Neither party has proposed widespread tax increases.
  10. The Affordable Care Act was enacted in 2010, helping to bring the share of Americans without health insurance down from 20% in 1975 to 8% today.
  11. The US safety net/welfare system has remained intact during this period driving the supplemental poverty rate down from 20% to 15%, while the official poverty rate has declined by just 1%. The share of the elderly (65+) in poverty has fallen from 16% to 8%.

The Economy

  1. Real dollar GDP is 4 times larger at $24 trillion.
  2. US real per capita GDP has remained the highest of all major countries for a century. Continued leadership reflects a dynamically successful economy.
  3. Real per capita GDP has increased by 250% to $70,000.
  4. US fiscal and monetary policy has repeatedly been effective in taming the business cycle and recovering from shocks like the housing crisis and the pandemic.

US Business

  1. Industrial production, including energy, is up by 250%.
  2. The number of business establishments has doubled to 8.6M, providing ownership and employment opportunities in a more specialized, globally traded world.
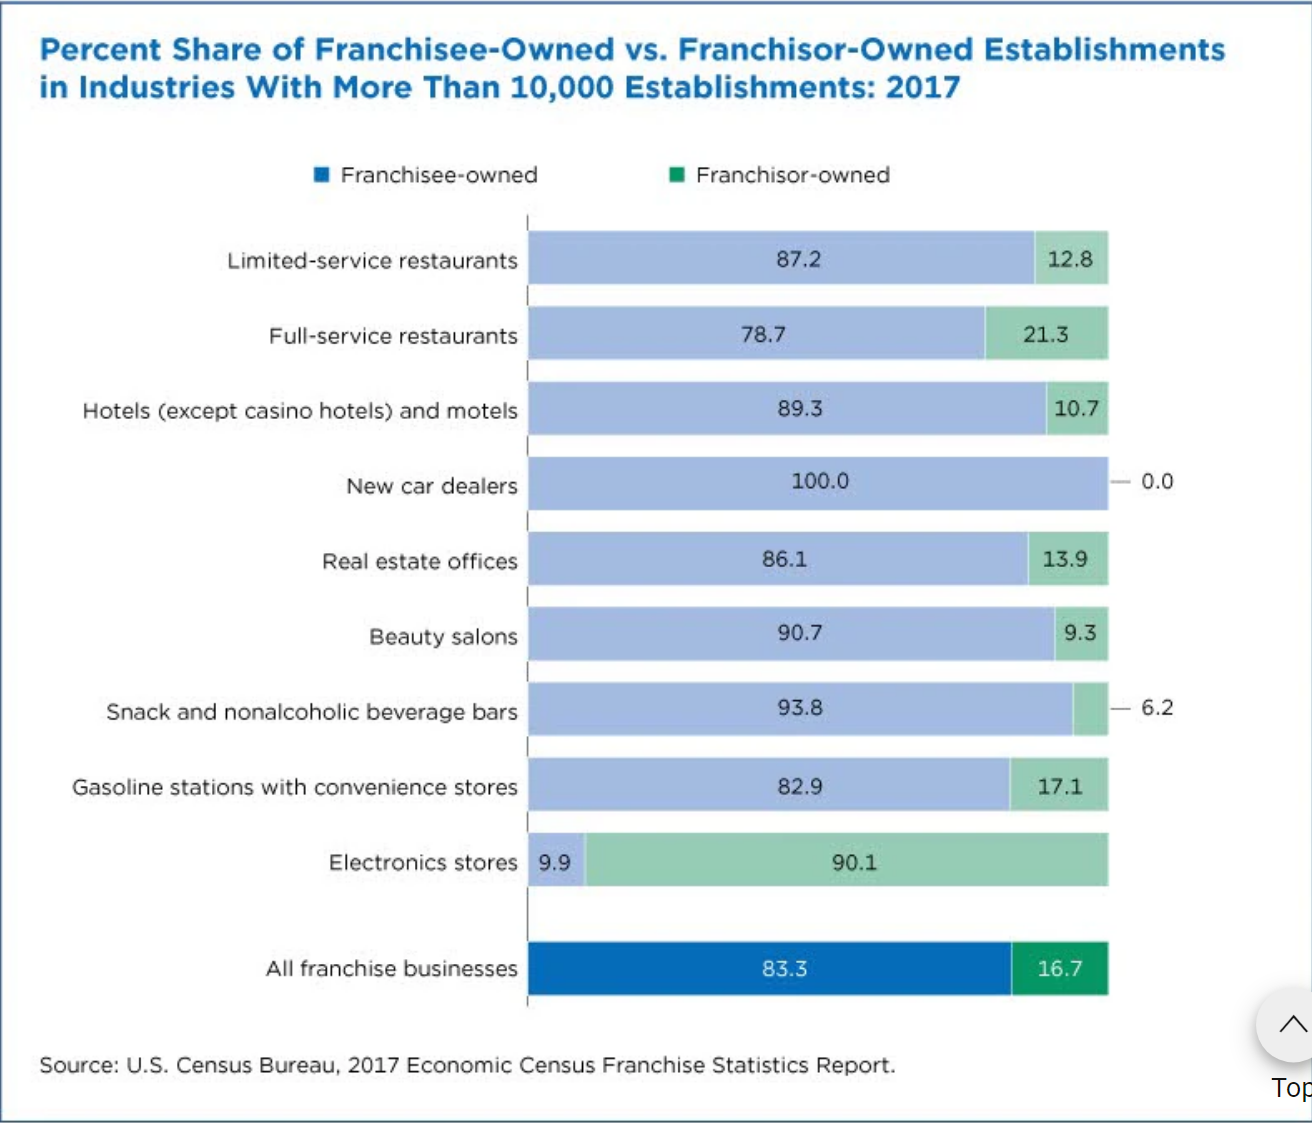
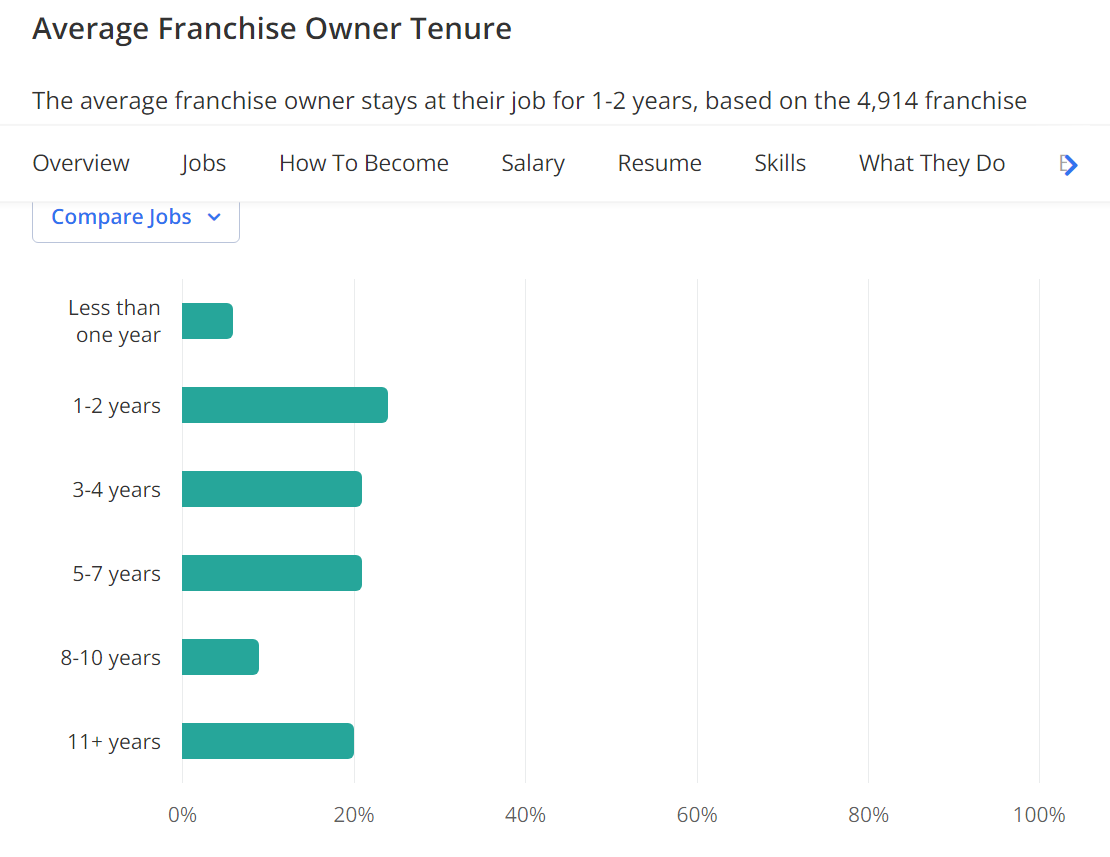
  3. The number of franchise businesses has grown from 375,000 to 800,000+, employing more than 10 million people.
  4. The rate of new business formation and success increased throughout the period, with a new boost after the pandemic.
  5. Businesses responded to the 1970’s “Japanese invasion” and became strategically more focused, measured more effectively, focused on cost reduction, invested in R&D, and applied information technology and process improvement tools. Foreign and domestic competition led businesses to be more cost effective, improve product quality and offer products better tailored to diverse customer wants and needs.
  6. Firms experimented with factory robots by 1975. They now use 380,000 robots, adding 10% more annually.
  7. Auto production in the US has increased from 8 to 10 million units per year.
  8. Farms produce twice as much using 20% less land and 40% less labor.
  9. Businesses adapted to the world of greater international trade by growing or shrinking facilities, markets, products and product lines. They adapted to the new power of consumers and retailers and reduced power of manufacturers. They divested units and rejected the conglomerate model. They rejected vertical integration, learning to outsource all functions where they did not have a competitive advantage.
  10. Firms embraced more effective banking, equity and bond markets to fund their activities. They tapped global sources and private equity. They learned by use financial leverage to increase net earnings and acquire other less dynamic competitors.
  11. Firms changed organizational structures to have fewer layers, less positional power, more staff experts and the ability to use cross-functional (matrix) approaches to core operations, projects and joint ventures.

Education

  1. Preschool/Kindergarten enrollment up from 5 to 9 million. Nearly all part-time in 1975 and mostly full-time in 2025.
  2. High school graduation rate is up from 75% to 85%.
  3. Intelligence test scores have increased by more than 10 points.
  4. Share of young adults who have earned college degrees has doubled from 20% to 40%.
  5. Share of adults with college degrees has more than tripled from 12% to 38%.
  6. Share of young women with a college degree is up from 17% to 45%; shares for men up from 27% to 37%.
  7. Share of degrees in STEM disciplines has grown from 11% to 19%.
  8. Number of college students studying abroad is up by 5 times.
  9. Law school first-year enrollment remains at 40,000, while the population has grown by 50%.
  10. US holds 18 of top 30 global university spots.
  11. The number of annually earned doctorates has doubled.
  12. US accounts for 50% of Nobel prize winners, up from 40% in 1975.

Transportation

  1. 22% of new cars are electric. Self-driving cars are widely deployed.
  2. Fuel milage has doubled from 13 to 27 miles per gallon.
  3. New car defects have dropped by two-thirds.
  4. Air travel miles are up by 5 times.
  5. FedEx 2-pound overnight service was introduced in 1975 for $75. Service is widespread today at $55.
  6. Same day and next day delivery services are available today, making Amazon.com, grocery and restaurant deliveries common. Catalog mail order lead times were 6-8 weeks in 1975.

Energy

  1. The US faced energy crises in 1973 and 1979 that disrupted businesses, emptied filling stations and led to recessions.
  2. The US imported 35% of its petroleum products in the 1970’s. It is a net exporter today.
  3. Energy intensity, the ratio of energy used to GDP, has fallen by 60% since the 1970’s.
  4. LED bulbs last 10 times longer. Lithium-ion batteries last 4 times longer.
  5. Wind power is 10% of electricity generation. Solar is 10% of electricity generation. Solar is the lowest cost source today, accounting for two-thirds of new generating capacity added.
  6. Coal production is the same today as in 1975, down 50% from its 2007 peak. It is declining rapidly.

Environment

  1. Toxic air pollution measures are lower by 65-90%.
  2. The world resolved the threat to the ozone layer.
  3. Percentage of US homes in communities with treated wastewater has increased from 50% to 80%.
  4. State parks acreage has doubled. Federal parks acreage has tripled. Land trust additions are equal to the state parks area.
  5. Total US forest land area has increased from 750 to 800 million acres, while the US population has grown by 50%.
  6. Nesting pairs of American bald eagles have grown 100-fold, from 700 to 70,000.
  7. US (1976) and global (2014) birth rates are half of historical levels, reducing environmental demands.
  8. US is on track to reach 50% reduction in greenhouse gas emissions by 2030.

Health

  1. Life expectancy has increased from 73 to 78 years.
  2. Infant mortality rate has dropped by two-thirds.
  3. Smallpox has been eradicated. Polio remains eliminated. Other diseases close to zero.
  4. Smoking rate is two-thirds lower, down from 37% to 12% of adults.
  5. Death rates down: Strokes 67%. Cancer 25%. Flu/pneumonia 67%. Heart disease 50%+. Liver disease 25%.
  6. US governments, medical industry, businesses and people responded to the Covid-19 pandemic resulting in a death rate that was half of the 1917 Spanish flu. Novel vaccine development and flexible delivery resources limited the death toll.
  7. Abortion rates have fallen by 50% since 1980.
  8. Medical research continues to develop new science and solutions. Cloning and human genome mapping.
  9. In vitro fertilization births have grown from 0 to 100,000 per year.
  10. Modern anti-depression drugs (SSRI-Prozac) are much safer and more effective than their predecessors.
  11. Kidney dialysis extends lives for 550,000 today versus 25,000 in 1975.
  12. Americans have 40 million MRI scans done on 13,000 machines, up from zero.
  13. Laser eyer surgery has grown from an experimental procedure to 800,000 annually.
  14. 50,000 organs are transplanted each year, up from just a few experiments.

Safety

  1. Property crime rate is down by more than 50%. Violent crime rate is one-third lower.
  2. Both the workplace fatality and injury rates are down by two-thirds.
  3. Traffic fatalities per driven mile are three-fourths lower.
  4. Fire incidents have been cut in half while the population grew by half.
  5. Emergency medical services have grown from 2% to 90% of counties; employing 300,000 people, 50,000 ambulances and 1,300 helicopters.

Consumer

  1. Firms have offered consumers much wider options for products in all industries. A typical Walmart Supercenter has 125,000 different SKU’s.
  2. We enjoy year-round availability of most fruits and vegetables today rather than shopping by season.
  3. Clothing and durable goods prices have been cut by half.
  4. The average automobile is 13 years old versus 6, reflecting massive quality improvements.
  5. Car buyers can choose from 15 major manufacturers instead of just 4.
  6. Appliances in more homes: Washing machines (70-85%), dryers (45-82%), dish washers (28-54%), microwave ovens (4-95%). Refrigerators are 25% larger, half price and 75% more energy efficient.
  7. Median new home square footage has increased by half, from 1,500 to 2,200 square feet.
  8. Mortgage loan rates have declined from 8-14% to 4-7%. Real rates are just 2% today.
  9. Total debt service payments (home, car, credit card, student loan) as a percentage of disposable income have declined from 11% to 10%.
  10. Air-conditioned homes have grown from a hot 55% to a cool 95%.
  11. Away from home food spending has more than doubled from 28% to 59% of total food spending.
  12. Household consumption is up from 87% to 92% of disposable income. Savings is down from 13% to 8%.

Leisure

  1. Many television program options. Top 4 network share down from 90% to 30%. Recording and streaming options exist today.
  2. Cable or satellite TV access has grown from 14% to 100%.
  3. The number of feature films released each year has bloomed from 100 to 700.
  4. Music singles are effectively free today. They cost $7.50 each in current dollars in 1975. The transistor radio has been replaced with portable, wearable devices served by playlists, suggestions and feeds.
  5. Real consumer electronics prices have declined by 80-95%. A 21-25 inch color console was $2-3,000 in 1975 in current dollars. A 50-inch tv is available for $500 today.
  6. A 1982 IBM PC cost $10,000 in current dollars. For $2-3,000 today you get 1,000 times the processor speed, 10,000 times the memory and 100,000 times the storage space.
  7. Video rentals boomed in the 1980’s and 1990’s growing into a digital $100 billion industry.
  8. The $5 billion pinball machine sector evolved into the $50 billion handheld and online gaming industry.
  9. Virtual reality equipment is increasingly popular.
  10. Passports are held by half of US citizens, up from 5% in 1975.
  11. Following deregulation, the real price of air travel per mile has glided down by 40-60%.
  12. Hotel room capacity has doubled from 2.4 to 5.3 million.
  13. Pet food consumption has tripled.
  14. American wine production has increased from 250 to 700 million gallons, along with quality.
  15. American brewery count has increased from 150 to 7,000, along with quality.

Wealth

  1. Mutual funds, index funds and 401K’s offer investing to everyone. Percentage of stockholders has grown from 12% to 60%.
  2. The number of retirement plan participants has grown by 250%.
  3. Real dollar retirement plan assets have grown thirty-fold, from $1.6 to $48 trillion.
  4. Homeownership rate increased from 64% to peak of 69% before falling back to 66%.
  5. Family wealth more than doubled for those in the 1st-25th, 26th-50th, and 51st-90th percentiles between 1989 and 2022. Summary data for 1975 to 1989 is not readily available. Real home prices increased by 20% and the real dollar S&P 500 increased by 75% during this period, overall.

Labor

  1. Compounded labor productivity has increased by 150%, more than 2% per year!
  2. Manufacturing, administrative and farm jobs were reduced by 20% of the total during these 50 years. They were replaced by STEM/analysis, management and health care jobs.
  3. Prime age labor force participation increased from 74% to 84%.
  4. Typical unemployment rate declined from 6.5% to 5%.
  5. Share of self-employed workers increased from 9% to 11%.
  6. According to the Gallup Organization, the share of “engaged” workers has increased greatly in the last 20 years.
  7. Real median family income increased by 40% from 1984 to 2024.
  8. There are dozens of expert calculations of real incomes, adjusted for taxes, government benefits, charity, fringe benefits, hours, etc. Most show that 1975-1990 was flat and that 2000-20 showed modest increases.

Society

  1. The US continues to lead the world in charitable giving as a percentage of income, double the nearest country, Canada.
  2. US migration and population growth in the “Sunbelt” impacted local and national economies, politics and society. Texas (13-31M), California (21-39M) and Florida (8-23M) showed the greatest growth and national influence.
  3. Share of adults cohabiting has increased from 1% to 13%.
  4. Teen pregnancy rate has been cut in half.
  5. The share of married couples has declined from 83% to 67% of households.
  6. Parents now invest 20 hours per week caring for children, up from 12 hours in 1975.
  7. Same sex marriage was legalized by the US Supreme Court in 2015.
  8. Female labor force participation rate has increased from 46% to 57%.
  9. The female to male wage discount has been reduced from 35% to 10%.
  10. The number of congresswomen increased from 19 to 155 (7X).
  11. Women today have access to credit and credit cards in their own names.
  12. Black unemployment declined from 15% to 7%, with the excess above whites falling from 7% to 2%.
  13. Black poverty rate has declined from 30% to 18%.
  14. The Black to White income ratio has improved from 60% to 67%.
  15. The share of interracial marriages has increased from less than 1% to 10%.
  16. Percentage of Americans moving per year has declined from 20% to 12%. Interstate moves have declined from 3% to 2%.
  17. Robert Putnam’s “Bowling Alone” shows a 40% decrease in social participation during this time.
  18. Awareness, tolerance and support for “differences” is higher by an order of magnitude: races, nationality, immigration status, physical or mental disability, gender identity, mental health, autism, obesity, and personality.
  19. Hispanic Americans have increased from 6% to 20% of the population.
  20. The percentage of non-Christians, including religiously unaffiliated, has increased from 12% to 35% of the population.
  21. The share of 40-year-olds never married has increased from 6% to 25%.

Computers

  1. Personal computer software and phone apps provide tools for email, calendars, word processing and spreadsheets to everyone today.
  2. Personal computers are in 95% of homes versus 0% in 1975.
  3. More than 90% of jobs today require computer skills.
  4. Home internet access is 92%.
  5. Digital cameras, music, videos, sound and storage make everything portable.
  6. Voice controlled devices and instant language translation.
  7. Today’s 10-day weather forecasts are as reliable as next day forecasts in 1975.
  8. Google search and artificial intelligence provide access to all of man’s writings and promise thought, itself.

Communications

  1. Internet structure and web browser provide access to everything and everyone.
  2. Smartphones integrate computing and communications. 90% ownership rate. Provides photo, filming and navigating capabilities.
  3. Mobile/cellular phone networks and wifi routers offer universal access to the internet and phones.
  4. Social media networks combine the input of many to build and use networks.
  5. Internet allows for open-source software and information creation.
  6. Video conferencing and internet enabled phone/video calls are common.
  7. Voice mail, answering machines, caller ID and 911 were invented.
  8. Digital books have grown to 25% market share.
  9. Annual first class mail per person increased from 240 to a peak of 360 in 2000 before falling to 130 today.
  10. Daily newspaper subscriptions have plunged from 60 to 20 million.
  11. Share of homes with landlines has fallen from 90% to 30%.
  12. A 3-minute long distance call in 1975 cost $8.70 in current dollars. An international Skye call today is 77 cents.

Summary

The world is a better, richer and safer place. Politics has evolved. The economy is 4 times larger. Businesses and education are more effective. Energy is cheaper. Transportation is better. The environment is much better. Health is much better. Safety is much better. The consumer is king. Leisure options and quality can’t even be compared with 1975. Wealth is up. Incomes are up. Society is digesting many large changes. The computer and communications revolutions have delivered miracles and promise more.

We face social, political and environmental challenges. We have more resources than ever before. Based on American history we should be very confident about solving our challenges.

Management Effectiveness Has More Than Doubled in the Last 50 Years!!!!

https://www.gm.com/heritage/collection/chevrolet/1976-chevrolet-chevette

The Chevy Chevette was the best product of the largest and most successful corporation in 1976. [WOWSER] It was marginally better than the Corvair or the Vega. Major US corporations had taken advantage of the post-WWII opportunity to produce for the world and perfected minor changes each year to further stimulate consumer demand. Functional roles in corporations were largely unchanged since the 1920’s. Japanese competition in the auto and consumer electronics industries in the 1970’s caused American corporations to eventually reinvent themselves and move into a world of perpetual change management.

It’s difficult to describe the size and impact of these changes. They were like a compounded series of paradigm shifts. I worked with many organizations from 1975-1989: Koppers, Avery Label, Sherwin-Williams, multiple S&L’s, United Telephone, AmeriTrust, E&Y, Tandy Radio Shack, EDS, IBM, Microsoft, GM, NASA, Zenith, Allison Transmission, City of Cleveland, McCormick Convention Center, Amway, US Navy, US Health & Human Services, Lorain Community College, Baldwin-Wallace University and the University of South Florida.

I completed a finance MBA at Case Western Reserve University in 1984. I joined Ernst & Young as a junior management consultant and learned from Dr. E. Leonard Arnoff, one of the founders of the discipline of operations research.

https://www.informs.org/Explore/History-of-O.R.-Excellence/Biographical-Profiles/Arnoff-E.-Leonard

FEW of the most important concepts and skills of my 35-year professional career existed or were rarely applied in 1984. The smartest academic and business leaders were aware of some of the changes that would shape the next 50 years, but the typical 1984 manager was still working from a 1930’s view of business.

I’ll group the more than 100 HUGE advances into 6 categories.

Strategy

  1. Strategy really matters. A strategy function is needed.
  2. Competitive advantage is critical (Michael Porter).
  3. Companies cannot be all things to all people.
  4. Strategy is a process to focus and facilitate thinking, not a mainly a means of control.
  5. Market leaders have a better chance of winning. Better to be a leader in a small market segment than a follower in a large one. Long-tail opportunities.
  6. In many markets, leading market share (1, 2 or 3) is essential.
  7. Product differentiation is required to avoid commodity pricing.
  8. Universal customer needs of quality, speed, flexibility, value (price and function), information/transaction costs and personal relations/risk management can all be used for product differentiation. A customer centric strategic view is necessary.
  9. SWOT analysis is essential. Strengths, weaknesses, opportunities and threats.
  10. Mission, vision and values must be articulated. Begin with the end in mind.
  11. Firms must choose between equity alone and multiple stakeholder priorities.
  12. Modelling and simulation tools can be used to identify, understand and prioritize the critical dimensions of every firm.
  13. International and startup competition must always be considered.
  14. Professional functions within each firm are increasingly essential.
  15. A 3-way strategic choice must be considered: low cost, product differentiation or customer intimacy.
  16. Successful firms clearly articulate abstract ends and flex the means of attainment (Collins).
  17. The customer and retail interface may have more power than the manufacturer/service provider.
  18. Smaller firms are available to be purchased in a roll-up strategy.
  19. In the end, dynamic, sustainable [moats] strategies have the greatest value.
  20. China matters.
  21. As firms become more strategically driven, the fixed costs of SG&A rose, requiring firms to prioritize growth and market share.
  22. Intangible assets may be more important than tangible assets.

Marketing

  1. Market size is essential. Market share is next.
  2. Marketing research of customer preferences matters.
  3. Branding is vital.
  4. Focus groups can provide separate insights and validate numbers.
  5. The marketing function exists to create value, not just sell things.
  6. Targeted marketing is essential. Products must match differentiated markets.
  7. Some customers value quality and reliability.
  8. Some customers value timely delivery.
  9. Digital marketing channels supplement analog channels.
  10. In the digital world, search engine optimization [SEO] matters.
  11. E-commerce is a competitor to analog delivery.
  12. Internet promotion is a competitor of traditional media.
  13. Individuals’ identity and social interests can be targeted.
  14. Some customers are better targeted by 2-way communications or influencers.
  15. Politicians, regulators and courts increasingly matter, and firms must invest accordingly.
  16. Tariffs matter. Firms must invest to manage them.

Finance

  1. Access to debt, equity and start-up financing is much easier.
  2. Access to global investors is possible.
  3. More efficient markets through mutual funds, ETF’s, derivatives, and efficient trading markets matter.
  4. Portfolio management applies to investments, projects, product lines, channels and new product development.
  5. Marginal costs/benefits apply to every activity and project.
  6. Cash and management accounting perspectives are best used for making decisions, separated from accrual and financial accounting measures.
  7. Price discrimination is a major opportunity in every market.
  8. The formal discounted cash flow analyses apply to many situations.
  9. Activity based costing helps to identify necessary costs at 4 levels.
  10. Corporate and product level costs are subject to cost reduction just like plant/facility and production costs.
  11. The balanced scoreboard system ensures that all levels of economic activity are planned, measured and managed.

Human Resources

  1. Human resources are productive assets; they are not simply “personnel”. They should be managed accordingly.
  2. Required staff skills must be defined, measured and enhanced.
  3. Clerical support skills must be cost-justified.
  4. Analytical skills can be captured in separate positions.
  5. The general concept of meritocracy matters. Exceptions must be justified.
  6. COO’s and CFO’s are not alone. IT, marketing, risk, merchandise and people managers are equally important.
  7. Legal compliance matters.
  8. The role of “managers” is essential. Managing people, tasks and processes. Developing talents.
  9. Highly skilled MBA’s have important roles to play.
  10. Organizational development is a value added function.
  11. Matrix (cross-functional) management is just as important as functional management.
  12. Project teams play a critical role.
  13. Firms cannot cost-justify employing thought leaders in every function. Management consultants can fill in.
  14. Employees can be outsourced.
  15. HR information systems (HRIS) are essential.
  16. Centralized professional services functions are typically more cost effective.
  17. Corporate culture is a strategic asset.
  18. Clearly defining role requirements, recruiting, hiring and performance evaluation greatly improve performance.
  19. Human beings have personalities, habits, talents and motivations that can be leveraged and improved.
  20. Diversity, equity, and inclusion is a worthy investment today.
  21. Workplace flexibility is highly valued by employees.

Information Technology

  1. Basic financial and operations systems can be automated.
  2. Detailed transactional processes can be automated, controlled and improved.
  3. Processes can be documented, standardized and enforced.
  4. Relational database logic can greatly reduce work and errors.
  5. Detailed functional IT subsystems can be developed to improve operations and feed the financial systems. Warehouse Management Systems (WMS), as one example.
  6. Enterprise Resource Planning (ERP) systems can be used to leverage the universal core processes of firms while customizing the details and integrating functional subsystems.
  7. Critical data can be stored in data warehouses for analysis. Big Data comes later.
  8. Reduced IT costs improve access to various tools and systems.
  9. Staff can effectively use personal productivity tools: word processing, spreadsheets, graphs, graphics, email, databases, queries, report writing.
  10. Personal computers allow local use.
  11. The ongoing reduction of computer costs makes them more effective for more employees.
  12. The internet provides access to information, teams, suppliers, customers, markets and others.
  13. Internet search tools provide smart access to information.
  14. Crowdsourced applications provide zero cost tools.
  15. Social media apps provide the opportunity to connect with others effectively.
  16. Smartphones further reduce the cost and limits of accessing all data, functionality and people.
  17. Artificial intelligence provides tools to greatly leverage personal skills.

Operations

  1. Forecasting and statistical techniques refined and easily applied using personal computers.
  2. Complex, multi-level operations planning models widely used.
  3. Supply chain management using daily or real-time information from suppliers, internal operations and customers optimized.
  4. Long-term supplier partner strategies adopted, reducing sales, purchasing, legal and disruption costs.
  5. Professional logistics profession developed, applying the best options for all types of cargo.
  6. Manufacturing outsourced routinely to lowest total costs sources worldwide.
  7. Distribution, logistics, IT, HR, R&D, product development and all functions outsourced (sometimes globally) to leverage specialized skills and focus internal operations.
  8. Operations research tools routinely applied for optimization problems, especially critical paths.
  9. All fixed-cost capacities set at lower percentages, with secondary capacity options, in order to optimize profits, especially in low and high demand situations.
  10. All processes defined, standardized, refined and optimized in order to apply IT and process engineering.
  11. Multiple feedback loops routinely used to improve processes through time.
  12. Lower communications and transportation costs further increased outsourcing activities.
  13. The value of time to customers was identified and turned into a competitive advantage, from 6-weeks mail order to same day to same hour delivery.
  14. Just-in-time production philosophies implemented, and inventories slashed towards zero intentionally to force improvements.
  15. Production processes re-engineered according to process and final goal needs, displacing functional and “like kind” groupings.
  16. Continuous improvement, kaizen quick fixes and full process re-engineering take advantage of global best practices.
  17. Project management discipline created and refined. Agile project management used. Project management offices created to manage portfolios of projects, project managers and subject matter experts from inside, suppliers, customers and consultants.
  18. New product development managed as a portfolio of projects, each within a standard process framework. Firms adopt the “layer cake” view of value as the sum of annuity returns from a series of new products.
  19. Basic insights of modern Total Quality Management or Lean Six Sigma adopted, focused on activity and process variability with unexpectedly large results. Relentless elimination of waste.
  20. The Quality paradigm shift places the process view on par with the finance view.
  21. The variability of actions within a sequence of events [Goldratt] is seen as the critical driver of final results. Processes, measurements, goals, investments, staffing, operations planning and outsourcing are adjusted for dynamic effectiveness.

Summary

Modern firms have cumulatively adopted and leveraged these interrelated capabilities to become strategically driven, self-aware, well-managed and improving through time. The marginal finance/portfolio view together with the process view allow firms to identify, deliver and monetize customer needs while outsourcing functions that are not deemed strategically essential. Firms generally invest more resources in planning, optimization, new product development and risk management today.

The application of these principles has varied by industry. Government, not-for-profit and health care have great improvement opportunities remaining.

Firms may invest in Joseph Schumpeter’s “creative destruction” or they may optimize within existing market structures if they see higher returns from internal process improvements, incremental product development, supplier squeezing, price discrimination, targeted marketing or regulatory capture. In other words, the capabilities for ongoing world-changing improvements exist but may not be applied for the greater good.

Modern History Index

257 items pulled from all arenas of life. Technology dominates, especially in the last century.

Grouping events into 40-year blocks shows 1940-79 as twice as dynamic as other eras.

1450 – 1779 20

1780 – 1819 12

1820 – 1859 16

1860 – 1899 31

1900 – 1939 47

1940 – 1979 99

1980 – 2025 32

Modern History: Communications and Computers

1455 – Printing Press

https://en.wikipedia.org/wiki/Printing_press

1826 – Camera and Photography

https://en.wikipedia.org/wiki/History_of_the_camera

1844 – Telegraph and Morse Code

https://en.wikipedia.org/wiki/Telegraphy

1876 – Telephone

https://en.wikipedia.org/wiki/History_of_the_telephone

1886 – Radio Waves

https://en.wikipedia.org/wiki/Radio_wave

1896 – Motion Pictures

https://en.wikipedia.org/wiki/History_of_film

1920 – Commercial Radio Broadcasting

https://en.wikipedia.org/wiki/Radio_broadcasting

1936 – Universal Computing Machine

https://en.wikipedia.org/wiki/Turing_machine

1939 – Commercial Television Broadcasting

https://en.wikipedia.org/wiki/History_of_television

1945 – Programmable Computer

https://en.wikipedia.org/wiki/ENIAC

1947 – Transistor

https://en.wikipedia.org/wiki/Transistor

1948 – Communications Theory – Shannon

https://en.wikipedia.org/wiki/Communication_theory

1951 – Commercial Computer

https://en.wikipedia.org/wiki/UNIVAC

1954 – Personal Entertainment Device

https://en.wikipedia.org/wiki/Transistor_radio

https://en.wikipedia.org/wiki/Walkman

https://en.wikipedia.org/wiki/Handheld_game_console

1959 – Integrated Circuit

https://en.wikipedia.org/wiki/Integrated_circuit

1962 – Communications Satellite

https://en.wikipedia.org/wiki/Telstar

1965 – Computer Hardware Costs Decline

https://en.wikipedia.org/wiki/Moore%27s_law

1970 – Email

https://en.wikipedia.org/wiki/Email

1971 – Microprocessor

https://en.wikipedia.org/wiki/Microprocessor

1973 – Cellular Phone

https://en.wikipedia.org/wiki/Mobile_phone

1974 – Internet

https://en.wikipedia.org/wiki/Internet

1974 – Personal Computer

https://en.wikipedia.org/wiki/Personal_computer

1977 – PC User Interface

https://en.wikipedia.org/wiki/Apple_II

1979 – Spreadsheet Killer App VisiCalc

https://en.wikipedia.org/wiki/Spreadsheet

1981 – MS DOS operating system for IBM compatible microcomputers

https://en.wikipedia.org/wiki/MS-DOS

1981 – Microsoft Windows

https://en.wikipedia.org/wiki/Microsoft_Windows

1990 – Web Browser

https://en.wikipedia.org/wiki/Web_browser

1998 – Search Engine

https://en.wikipedia.org/wiki/Google_Search

2004 – Social Media

https://en.wikipedia.org/wiki/Facebook

https://en.wikipedia.org/wiki/Social_media

2007 – Smart Phone

https://en.wikipedia.org/wiki/IPhone

2022 – Artificial Intelligence

https://en.wikipedia.org/wiki/ChatGPT

Summary

Electronic, semiconductors and digital. Networked. Integrated. Powerful. Personal.

Modern History: Technology

1760 – Industrial Revolution – Power Loom

https://en.wikipedia.org/wiki/Industrial_Revolution

https://en.wikipedia.org/wiki/Power_loom

1765 – Watt’s Steam Engine

https://en.wikipedia.org/wiki/Steam_engine

1800 – Second Agricultural Revolution

https://en.wikipedia.org/wiki/British_Agricultural_Revolution

1802 – Steam-powered Locomotive

https://en.wikipedia.org/wiki/Steam_locomotive

1821 – Electromagnetic induction – Electric Motor

https://en.wikipedia.org/wiki/Electric_motor

1859 – Pennsylvania Oil Rush

https://en.wikipedia.org/wiki/Pennsylvania_oil_rush

1869 – Transcontinental Railroad

https://en.wikipedia.org/wiki/First_transcontinental_railroad

1869 – Suez Canal

https://en.wikipedia.org/wiki/Suez_Canal

1879 – Edison’s Practical Electric Light Bulb

https://en.wikipedia.org/wiki/Electric_light

1882 – Commercial Electricity Generation and Distribution

https://en.wikipedia.org/wiki/Electricity_generation

1886 – Alternating Current Distribution and Motors

https://en.wikipedia.org/wiki/Alternating_current

1886 – Internal Combustion Engine – Benz

https://en.wikipedia.org/wiki/Internal_combustion_engine

1902 – Air Conditioning – Carrier

https://en.wikipedia.org/wiki/Air_conditioning

1903 – Wright Brothers’ Airplane

https://en.wikipedia.org/wiki/Wright_brothers

1905 – Electric Home Appliances

https://en.wikipedia.org/wiki/Home_appliance

1907 – Synthetic Plastics / Bakelite

https://en.wikipedia.org/wiki/Plastic

1914 – Panama Canal

https://en.wikipedia.org/wiki/Panama_Canal

1915 – Home Refrigerators

https://en.wikipedia.org/wiki/Refrigerator

1927 – Nonstop Transatlantic Flight

https://en.wikipedia.org/wiki/Transatlantic_flight

1935 – Commercial Air Travel

https://en.wikipedia.org/wiki/Douglas_DC-3

1956 – Interstate Highway System

https://en.wikipedia.org/wiki/Interstate_Highway_System

1958 – Commercial Nuclear Power

https://en.wikipedia.org/wiki/Nuclear_power_in_the_United_States

1960 – Laser

https://en.wikipedia.org/wiki/Laser

1960 – Third Agricultural Revolution (Green)

https://en.wikipedia.org/wiki/Green_Revolution

1961 – Manned Space Flight

https://en.wikipedia.org/wiki/Yuri_Gagarin

1968 – Boeing 747

https://en.wikipedia.org/wiki/Boeing_747

1969 – Moon Landing

https://en.wikipedia.org/wiki/Apollo_11

https://en.wikipedia.org/wiki/Space_Race

2012 – Wind Energy – largest US new power source

https://en.wikipedia.org/wiki/Wind_power

2020 – Solar Energy – cheapest power source

https://en.wikipedia.org/wiki/Solar_energy

Summary

Energy, transportation and manufacturing continue to advance. See separate posts for communication, computers and biology.

Modern History: Business & Economics

1602 – Dutch East India Company, limited liability corporation, global trade

https://en.wikipedia.org/wiki/Dutch_East_India_Company

1776 – The Wealth of Nations from markets, specialization and trade

https://en.wikipedia.org/wiki/Adam_Smith

1817 – Comparative advantage drives international trade

https://en.wikipedia.org/wiki/David_Ricardo

1865 – Gilded age economic expansion and inequality in the US, laissez faire

https://en.wikipedia.org/wiki/Gilded_Age

1867 – Trade unions legalized in the United Kingdom

https://en.wikipedia.org/wiki/Trade_unions_in_the_United_Kingdom

1910 – Scientific management, Frederick Taylor, Taylor method

https://en.wikipedia.org/wiki/Scientific_management

1911 – Breakup of the Standard Oil Company – anti-monopoly power

https://en.wikipedia.org/wiki/Standard_Oil_Company

https://en.wikipedia.org/wiki/The_History_of_the_Standard_Oil_Company

https://en.wikipedia.org/wiki/Standard_Oil_Co._of_New_Jersey_v._United_States

1913 – Federal Reserve Bank created

https://en.wikipedia.org/wiki/Federal_Reserve_Act

1913 – Industrial assembly line- Ford

https://en.wikipedia.org/wiki/Assembly_line

1929 – Great Depression

https://en.wikipedia.org/wiki/Business_cycle

https://en.wikipedia.org/wiki/Great_Depression

1933 – Securities and Exchange Commission regulates financial markets

https://en.wikipedia.org/wiki/Securities_Act_of_1933

1936 – Modern macroeconomics is outlined

https://en.wikipedia.org/wiki/John_Maynard_Keynes

1939 – Silicon Valley begins with Hewlett-Packard, product and financing innovation

https://en.wikipedia.org/wiki/Hewlett-Packard

https://en.wikipedia.org/wiki/Silicon_Valley

1942 – Creative Destruction is an essential part of effective capitalism.

https://en.wikipedia.org/wiki/Joseph_Schumpeter

1947 – Military industrial sector, defense complex created

https://en.wikipedia.org/wiki/Military_production_during_World_War_II

https://en.wikipedia.org/wiki/Military%E2%80%93industrial_complex

https://en.wikipedia.org/wiki/Military_budget_of_the_United_States

1948 – Japanese companies start modern manufacturing based upon statistical insights.

https://en.wikipedia.org/wiki/Toyota_Production_System

1950 – The study of “sequence of events” leads to modern project management.

https://en.wikipedia.org/wiki/Critical_path_method

https://en.wikipedia.org/wiki/Timeline_of_project_management

1952 – Henry Markowitz formalizes modern portfolio theory.

https://en.wikipedia.org/wiki/Modern_portfolio_theory

1955 – Destination theme park travel begins – Walt Disney

https://en.wikipedia.org/wiki/Disneyland

https://en.wikipedia.org/wiki/Disney_Experiences

1955 – Enclosed Shopping Mall

https://en.wikipedia.org/wiki/Shopping_center

https://en.wikipedia.org/wiki/Shopping_mall

1956 – Intermodal shipping container and freight transport

https://en.wikipedia.org/wiki/Intermodal_freight_transport

1958 – General purpose credit cards

https://en.wikipedia.org/wiki/Credit_card

1958 – A meritocratic work environment was dominating, and critics objected.

https://en.wikipedia.org/wiki/The_Rise_of_the_Meritocracy

1962 – Product and process standardization, franchising take off

https://en.wikipedia.org/wiki/History_of_McDonald%27s

1962 – Discount retailing, big box stores, category killers arise.

https://en.wikipedia.org/wiki/History_of_Walmart

1968 – For profit health care.

https://en.wikipedia.org/wiki/HCA_Healthcare

1970 – Income inequality begins to grow again in the US

https://en.wikipedia.org/wiki/Income_inequality_in_the_United_States

1971 – Discount air travel, standardized routes and aircraft

https://en.wikipedia.org/wiki/History_of_Southwest_Airlines

1973 – How much is a financial option worth?

https://en.wikipedia.org/wiki/Black%E2%80%93Scholes_model

1973 – Reliable express delivery is founded.

https://en.wikipedia.org/wiki/FedEx

1974 – Tax-advantaged individual retirement accounts

https://en.wikipedia.org/wiki/Individual_retirement_account

1975 – Index funds and mutual funds simplify and lower transaction costs of investing.

https://en.wikipedia.org/wiki/The_Vanguard_Group

1978 – Executive stock options provide high levels of tax-advantaged compensation.

https://en.wikipedia.org/wiki/Employee_stock_option

1979 – Monetary policy can stop inflation, at a cost.

https://en.wikipedia.org/wiki/Paul_Volcker

1980 – Junk bonds provide financing for riskier companies and tools for investors.

https://en.wikipedia.org/wiki/High-yield_debt

1980 – Michael Porter clarifies the effective use of business strategy to compete in markets.

https://en.wikipedia.org/wiki/Competitive_advantage

1984 – Eli Goldratt offers a “theory of constraints” as a way to understand and manage complex systems effectively, leading to true “lean manufacturing” and “lean operations”.

https://en.wikipedia.org/wiki/Theory_of_constraints

1994 – On-line retailing, everything is in stock, and available soon.

https://en.wikipedia.org/wiki/History_of_Amazon

2007 – Great Recession highlights the ongoing risks of financial deregulation.

https://en.wikipedia.org/wiki/Great_Recession

Summary

Process standardization. Financial innovation. Highly focused strategies. New business forms. Markets and international trade deliver desired products, lower prices and competition. A role for government regulation remains. The macroeconomy can be managed to reduce the impact of business cycles and shocks.

Good News: Franchising Opportunities

Today, 3,400 US franchisors support 800,000 franchisees with 9 million employees grossing $1.7 trillion of annual sales and 3% of US GDP.

https://www.franchisedirect.com/information/is-your-franchise-fit-for-the-us

Rationale

Franchising provides an opportunity for qualified individuals to own a business and earn equity-like rewards, without outstanding industry expertise, with lower business failure risk, requiring relatively modest equity investments and the opportunity for advantageous bank and small business loans.

Franchising provides the owner of a product or service concept with the opportunity to expand using “other people’s money”. It facilitates geographic and international expansion leveraging locally knowledgeable managers/investors. It allows differentiated products, services and systems to be replicated quickly and consistently. It provides legal agreements that ensure that the franchisor’s brand is enhanced and not damaged by the franchisee’s operations. It provides a system that strongly aligns the interests of local managers/owners with those of the central business.

History

Franchising has experienced several “boom and bust” periods, fraudulent deals and changing relations between franchisors and franchisees through time. Initial growth began in the 1850-1920 period together with the growth of the manufacturing and transportation industries. Automobiles, farm equipment, sewing machines, service stations, auto parts, pharmacies, soft drinks and train stop/car hop restaurants lead the way originally using the product franchising model. The depression interrupted the growth of franchising. Automobile dealers, service stations and soft drink distributors accounted for 80% of franchising before the depression.

Franchising accelerated again after WWII with fast-food restaurants leading the way, accompanied by a diverse set of laundry, hotel, rental car, real estate and convenience stores. These businesses were often still tied to products or patented equipment. However, McDonalds (1955) offered the first business format franchises which provided greater opportunities in a growing, travelling society.

Business format franchising “includes not only the product, service, and trademark, but the entire business format itself: a marketing strategy and plan, operating manuals and standards, quality control, and a continuing process of assistance and guidance.”

With rapid growth came accounting fraud by franchisors, one-sided contracts, overlapping deals, pyramid schemes and conflicts between franchisors and franchisees. The Energy Crisis of the 1970’s bankrupted a large share of service stations. State and federal regulations enacted in the 1970’s ensured that standard disclosure agreements were used, allowing potential franchise owners to work with their lawyers to ensure that they understood the deals they were making.

https://www.tasanet.com/Knowledge-Center/Articles/ArtMID/477/ArticleID/1251790/Where-It-All-Began-The-Evolution-of-Franchising

https://www.entrepreneur.com/franchises/entrepreneur-franchising-the-big-bang/66000

https://en.wikipedia.org/wiki/Franchising

Growth

Data on the franchising industry is not standardized. Two industry associations and the US Census Bureau provide somewhat inconsistent data. Nonetheless, the growth of franchising after the “bust” in the 1970’s is amazing. The number of establishments has grown from 375,000 (1973) to 420,000 (1988) to 530,000 (1990) to 775,000 (2021). Total employment has grown more slowly, from 7 million (1988) to almost 10 million (2017). Sales has grown much faster from $160 billion (1975) to $350 billion (1980) to $530 billion (1985) to $1 trillion (2004) to $1.3 trillion (2007) to $1.5 trillion (2012) to $1.7 trillion (2017).

https://www.latimes.com/archives/la-xpm-1990-09-27-fi-1859-story.html

https://www.entrepreneur.com/franchises/entrepreneur-franchising-the-big-bang/66000

https://www.census.gov/library/stories/2021/12/franchising-is-more-than-just-fast-food.html

Varied Opportunities

https://www.census.gov/library/stories/2021/12/franchising-is-more-than-just-fast-food.html

Leading sectors by annual earnings include senior care ($155K), real estate ($153K), personal services ($126K), business services ($122K) and pet services ($119K).

https://www.entrepreneur.com/franchises/the-highest-earning-franchise-categories-according-to/417572

Entrepreneur Magazine has been publishing its “Franchising 500” rankings since 1980.

https://www.entrepreneur.com/franchises/directory/franchise500-ranking

The fast-food restaurant industry remains the “killer app” for franchising.

https://www.statista.com/statistics/190330/employees-of-us-franchise-establishments-by-business-line-since-2007/

Franchisee Demographics

Strategic Emphasis in 2023

Sustainable resources; operations and marketing.

Nearer international and local supply chain sourcing.

Simpler operations and automation. Resilient, recession-proof.

Multiple brand retail locations.

Technology, digital operations.

Marketing/social media capabilities.

Home delivery services.

Personalized products and customer service.

Generation and minority group niche marketing and growth.

Fitness, health, and wellness services.

Home improvement services.

Food and restaurants recover.

Increasing role for multi-unit franchisees.

https://www.forbes.com/sites/forbesfinancecouncil/2023/01/04/franchising-trends-to-be-on-the-lookout-for-in-2023/?sh=969cf8949e91

https://www.franchising.com/guides/current_trends_in_franchising.html

https://www.linkedin.com/pulse/6-franchise-trends-watch-2023-teri-barber/

https://topfranchise.com/articles/trends-in-franchising-for-2023/

https://blog.gitnux.com/franchise-trends/

Good News: Auto Choices

U.S. Auto Market Share by Manufacturer

Mfgr1970198019902000201020162020
GM39443528191719
Ford28202423161515
Toyota2689151416
FCA159121491312
Honda3671099
Nissan2549896
Hyundai11544
Kia1343
Subaru111234
Volkswagen6312332
Daimler112232
BMW1222
Mazda121222
Mitsubishi121
Volvo1111
Porsche Audi2
Tesla2
1% Offerings Count6111315131416
Top 4 % Share88797974605962

2020 U.S. Auto Sales Figures by Brand | GCBC (goodcarbadcar.net)

Top Vehicle Manufacturers in the US Market, 1961-2016 – knoema.com

Animated chart of the day: Market shares of US auto sales, 1961 to 2018 | American Enterprise Institute – AEI

In 1970, GM owned a 39% market share in the US with its 6 brands. It now sells less than one-half at 19%. Ford sold 28% and now sells about one-half as much at 15%. Chrysler-Lincoln-Mercury-Jeep has done better, selling 12% in 2020 versus 15% in 1970.

In 1970 there were only 6 firms with 1% or greater market share. Today, there are 16 firms.

In 1970, the top 4 cornered the market with 88% market share. That has declined to 62%.

In the last 50 years, 11 new firms have earned 1% or greater market share. Consumer options are 3 times as great as in 1970!

A similar change has taken place for most manufactured goods. Legacy high cost American and European manufacturers have lost market share. Asian manufacturers have gained significantly (Japan, Korea, China, Taiwan, SE Asia, India). Latin American and African manufacturers have recently started to provide a fourth option.

For consumers, this is great news. More choices. More competitors. Lower prices. Improved products.

Compare the 2021 Honda Accord LX sedan with the 1970 Chevy Impala option to get a sense of the improved features available on a standard “family sedan” today versus 50 years ago.

2021 Honda Accord Prices, Reviews, and Pictures | Edmunds

Chevrolet Impala (fourth generation) – Wikipedia

Good News: Labor Productivity from 1970 to 2020, A Personal Perspective

Nonfarm Business Sector: Real Output Per Hour of All Persons (OPHNFB) | FRED | St. Louis Fed (stlouisfed.org)

I formally retired this Spring at age 65. I started working in 1966 at age 10 as a newspaper delivery boy. I’d like to reflect on the big changes in the economy during these 5 decades.

The US Bureau of Labor Statistics tracks the real output per hour in the nonfarm business sector, or “labor productivity”. The media reports this number as it has “real” and “political” importance. The average annual improvement has been 1.9%. That is a 95% increase in 50 years, nearly a doubling, on an arithmetic basis. However, productivity compounds geometrically, just like compound interest, so the 2020 worker is actually 159% more productive. Or, the 1970 worker was 39% as effective as the 2020 worker!!! The 2020 worker delivered 5 units of output for every 2 units of output in 1970!!! Expressed in these terms, it’s clear to see this is a really important measure.

The annual productivity increase has ranged from -1.6% (1974, when I finished high school) to 4.5% (1992). 3 times below 0% and 3 times above 4%. The measured productivity growth increases and decreases through time. From 1970-76, labor productivity grew by 2.4% annually, a very good result. This was the end of the post WWII boom period. Japanese and European competition, oil cartels, sleepy consolidated industries, environmental laws and stagflation disrupted this progress. The next 13 years (1977-89) were a time of transition (disco). Labor productivity grew by just 1.4% per year, despite the early positive effects of the computer revolution. 1% per year lower doesn’t look like much, but it means that output in 1989 was 13% less than it would have been if the country had maintained it’s early 1970’s productivity improvements. The impact of the “Reagan Revolution” in freeing American capitalism from regulations and taxation was not clear during his presidency. The next 8 years (1990-97) showed some improvement, to 1.7% annually, but not a true revolution that either Bush or Clinton could celebrate. The next 13 years (1998-2010) were the golden years for improved labor productivity, averaging 2.9% annually, DOUBLE the improvements from 1977-89. The later Clinton years and the whole George W Bush presidency witnessed these results. The next 6 years (2011-16) reflected the slow recovery from the Great Recession with labor productivity growing by just 0.7% annually, half of the poor 1977-89 time frame. Productivity growth started to recover in the last 4 years, averaging 1.7%.

Economists tend to focus on the role of “capital” in driving labor productivity. In essence, if workers have more or better machines and computers, they will produce more per hour. In very rough terms, about one-half of labor productivity improvements come from better tools.

How Capital Deepening Affects Labor Productivity (stlouisfed.org)

The economists who try to measure the output part of labor productivity (real GDP) try to be consistent and conservative. That means that they understate real GDP. They don’t include the value of reduced pollution. They try to adjust for the improved quality of goods and services, but count only the obvious benefits. In a world dominated by services, this is a major gap. They make no attempt to estimate the benefits of less time spent buying goods and services. They make no estimate of the value of shorter delivery times. They are unable to account for the benefits of transparent and deep markets for goods and services.

Finally, they do not account for the value of product variety, broader consumer choices and customized goods. The fact that modern products more exactly fit consumer needs adds no value to GDP. By the 1990’s firms understood the universal customer value framework (QSFVIP) outlined by Deming, Juran, Shingo, Schonberger and others.

Amazon.com: Building a Chain of Customers eBook: Schonberger, Richard J.: Books

Firms understood Marshall Field’s dictum to “give the lady what she wants” and pursued it with a vengeance in order to gain market share, fight imports and improve margins. Based on my experience, firms devoted at least as much time to delivering upon these “soft”, qualitative, unmeasured productivity factors throughout the last 50 years. Hence, true productivity growth may have been twice as high as officially reported.

What changed in 50 years?

Secretaries and administrative assistants disappeared. Managers and professionals learned to do their own “paperwork”.

Clerks disappeared. Fewer transactions. Lower transaction costs. Standardized transactions. Automated transactions. No data entry operators.

All processes were subject to measurements like Ford’s assembly line.

More “analysts” working to improve all functions. Not just chemistry and engineering specialists. Financial analysts, marketing analysts, pricing analysts, logistics specialists, forecasters, inventory specialists, brand managers, compensation analysts, trainers, quality specialists, process engineers, systems engineers, professional purchasing analysts, etc.

Documentation revolution. Policies and procedures. Standardization. Say what you do.

Quality/process/TQM/lean 6 sigma revolution. Every activity can be defined and improved. Do what you say. Improve.

Process management via Goldratt’s theory defined in “The Goal”.

Import substitution due to lower transport, finance and transaction costs.

Outsourcing and specialization. Finance, accounting, HR, engineering, IT, facilities, marketing, advertising, logistics, distribution, legal, labor, manufacturing, design, project management, testing, returns, maintenance, leasing, equipment rental, etc. Stick to your core functions.

Flatter organizations. Fewer middle management layers.

New product introduction as a well-defined process that can be improved and outsourced.

Business viewed as a portfolio of products and channels and markets.

Competitive banking. Competitive equity markets. Venture capitalists. Bankruptcy processes. Leveraged buyouts. Asset based financing. Leases. Portfolio theory. International funds flows.

Reduced barriers to international trade. Tariffs. Regulations. Lower shipping costs due to containerization. Rule of law reducing costs like letters of credit. Fax machines. Reduced foreign travel costs. Japanese supplier partner concepts.

Improved suppliers. Supplier partnerships. Supplier measures. Contracts. Supplier improvement plans. Less bidding, negotiations or transactions.

Capital allocation/investment within firms. Basic ROI/NPV education. Portfolio of products. New products, new channels, new brands, process improvements, supplier improvements. Improved supplier opportunities. Acquisition value. Improved project management and risk management.

Jack Welch view: be number 1 or 2 or else. Walmart or niche service positioning, not JC Penney or Sears or Kmart. Firms dedicated their products to what customers would willingly buy.

Benchmarking to world class standards. Belief that reaching this performance level is possible and required.

Computerization of all processes. Transactions. Planning. Scheduling. Forecasting. Controls. Budgets.

Immediate communications. Supplier transactions. Product development. Project management. Inventory management.

Digital replacement of analog publishing.

Role of network effects. Clear standards.

Internal planning and scheduling tools.

Improved current and futures markets for all commodities and business inputs.

Reduced costs for transportation, agriculture, manufacturing, minerals and standardized inputs.

Reduced construction costs through design, standardization, sourcing, project management tools.

Greatly improved hiring frameworks and tools (fill the bucket). Management development training. Employee evaluation and feedback tools.

Social support for necessary “downsizing” at larger firms during economic downturns.

Basic productivity improvements from Microsoft Office tools: spreadsheets, word processing, publishing, web publishing, forms, database structure, queries, reporting, projects, etc.

Internal planning, analysis and control tools. Activity based costing. Balanced scorecard.

Much of the productivity improvements of the last 50 years have been due to improvements in “administration”. The lean 6 sigma quality revolution points to continued improvements in the future, perhaps with a lesser measured impact.

Breakthrough improvements in chemistry, biotechnology, physics, nanotechnology, DNA, plastics, materials, communications and energy may be required to drive productivity improvements in the next 50 years.

I’m an optimist. Science delivers opportunities. Profit oriented firms in competitive market find and apply these opportunities. Output per labor hour will be 150% higher again in 2070 (5/2 X). That means that workers in 2070 will be more than 6 times as productive as those in 1970!

Good News: U.S. Air Travel Climbs.

YearAir-Miles10 Year % Change
196033
1970118258%
198021986%
199035964%
200053148%
20105555%
201975436%

• U.S. passenger-miles in air traffic 2007-2020 | Statista

U.S. Passenger-Miles | Bureau of Transportation Statistics (bts.gov)

Revenue Passenger Miles for U.S. Air Carrier Domestic and International, Scheduled Passenger Flights (RPM) | FRED | St. Louis Fed (stlouisfed.org)

BTS | Table 1-37: U.S. Passenger-Miles (umich.edu)

Since 1970, US air travel has grown by 4% annually, year after year after year.

Air travel in 2019 is more than 6 times as large as 1970 and more than 20 times as large as 1960 when the term “jet-setters” was coined.