For each measure, we’ll list the Hamilton County rate, the Indiana rate and a letter grade primarily comparing Hamilton County with the Indiana average but also considering the national average.
Primary care physicians per 100K: 140 vs 67, A+.
Hospital beds per 1,000: 1.8 vs 3.3, (US avg is 1.9), B.
Population per “other” (nurse practitioner) primary care providers: 920 vs 830, C-.
Population per mental health care provider: 580 vs 530 (US avg is 340): D.
Population per dentist: 1,350 vs 1,700 (US avg is 1,380), B.
Access to park or physical recreation facilities: 90% vs 77%, A-.
Uninsured adults: 5% vs 10%, A+.
Food insecurity: 7% vs 11%, A.
Limited access to healthy foods: 5% vs 9% (US avg is 6%), B.
Health Outcomes
Life expectancy: 81.6 vs 76.5 (US avg is 78.5), A.
Deaths per 100K: 710 vs 965, A+.
Premature deaths per 100K: 215 vs 420, A+.
Reporting poor or fair health: 9% vs 15%, A.
Poor physical health days per month: 2.5 vs 3.3 (US avg is 3.0), B.
Poor physical health one-half of the time: 7% vs 10%, A.
Low birth weight: 7% vs 8%, B.
Arthritis hospitalizations per 10K: 33 vs 33, C.
Hip fractures per 10K aged 65+: 56 vs 62, B.
New lung cancer cases per 100K: 46 vs 72, A+.
Total cancer rate per 100K: 442 vs 457, C+.
Total cancer death rate per 100K: 126 vs 163 (US avg is 144), A-.
Mental Health
Poor mental health days per month: 3.9 vs 4.9, A.
Frequent mental distress: 13% vs 16%, B+.
Medicare beneficiaries with depression: 20% vs 21% (US avg is 18%), C-.
Insufficient sleep: 27% vs 36%, A.
Suicide deaths per 100K: 9 vs 15, A+.
Summary
Subjectively, health resources combine for a solid B+ or A-. Health outcomes are clearly rated A. Mental health is A. US News & World Report rates Hamilton County as 8th best nationally of the counties it tracks. County Health Rankings lists it as the healthiest county in Indiana. Hamilton County operates Riverview Health. Its health department effectively managed several rounds of covid vaccines.
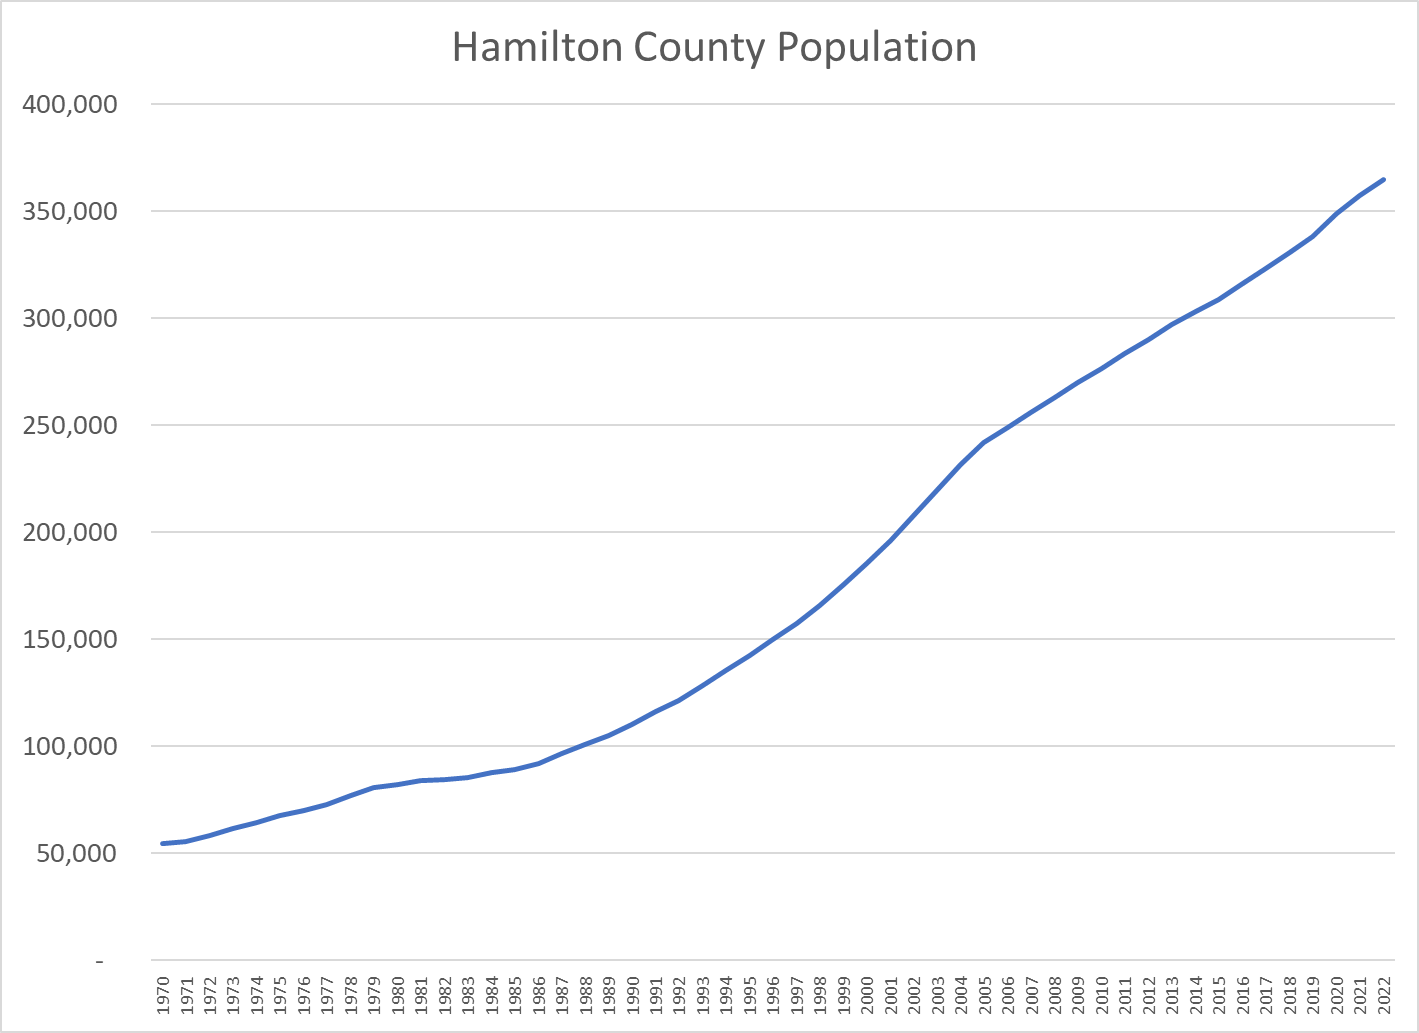
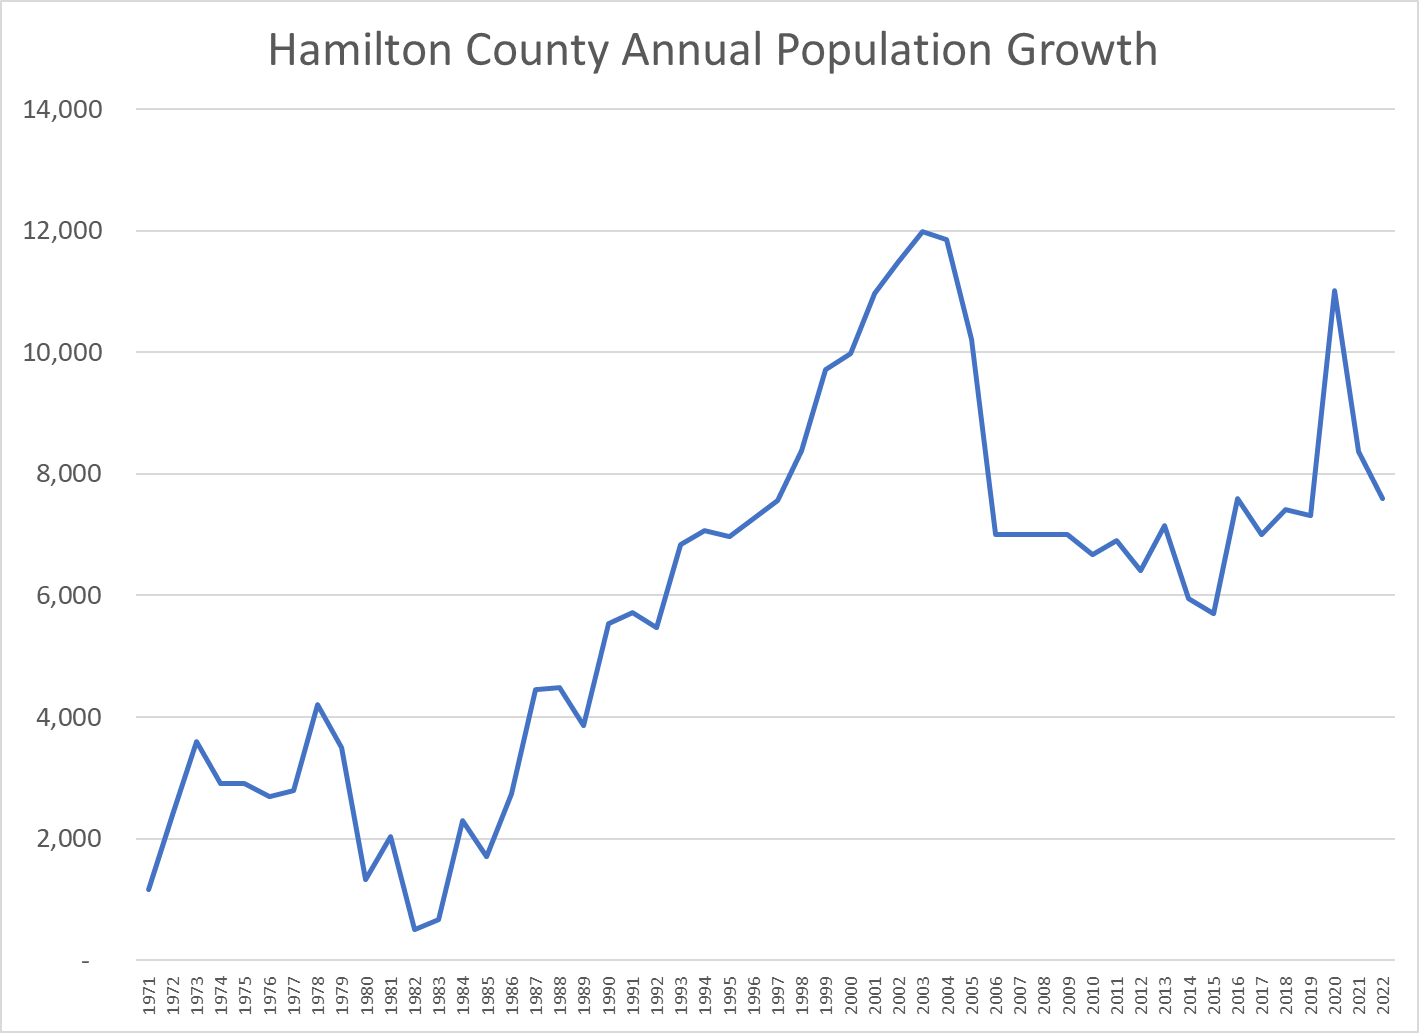
Hamilton County’s population has grown by at least 7,000 per year for 30 years. Growth peaked at 10,000 per year from 1999-2005, decreased to 7,000 in the aftermath of the Great Recession and has since increased to 8,000 per year.
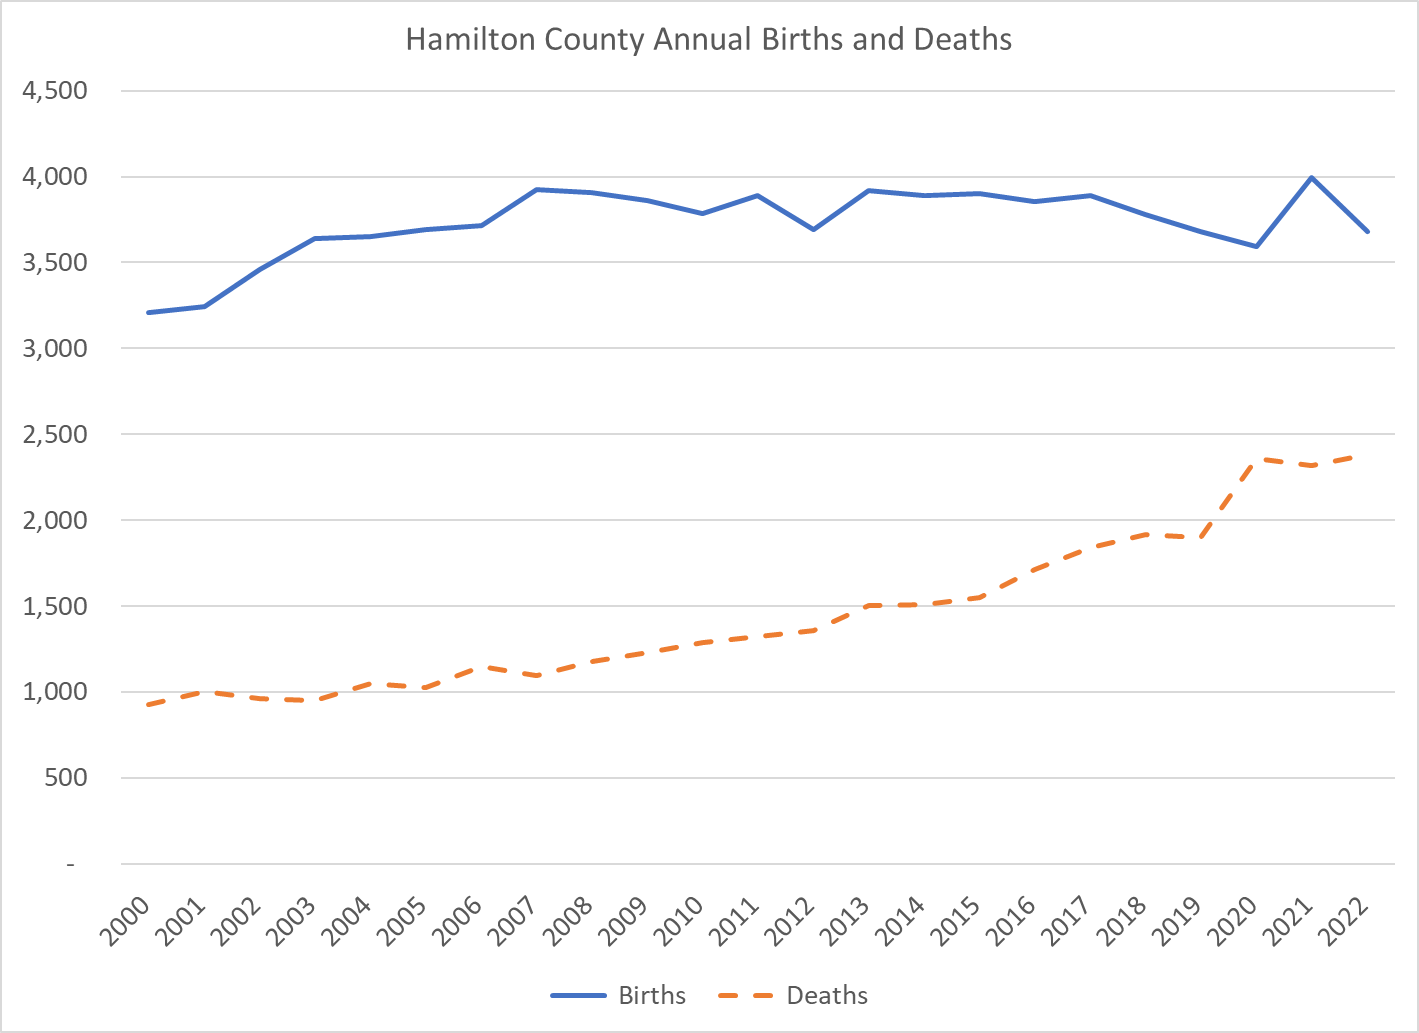
The county has enjoyed a natural increase of about 2,000 per year, with 4,000 births per year and 2,000 deaths per year. Annual net in-migration has averaged 6,000 in the last decade. Hamilton County loses roughly 3,000 residents to other states and 2,000 students to attend major universities. It gains about 4,000 international immigrants, 1,000 from Illinois, 1,000 from other Indiana counties and 5,000 from nearby Marion County.
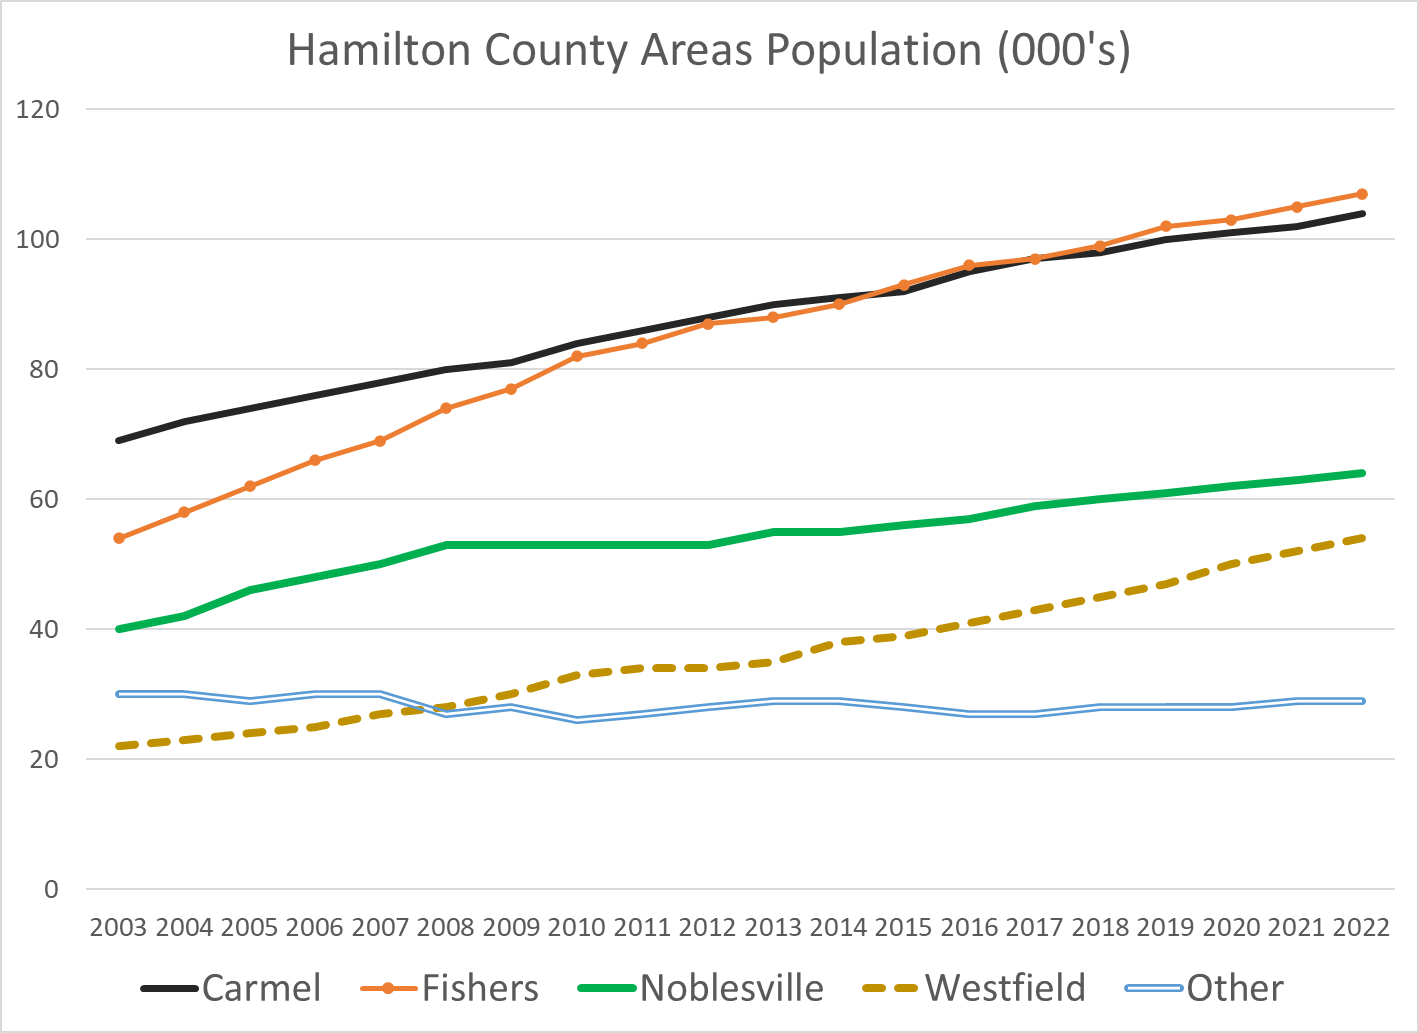
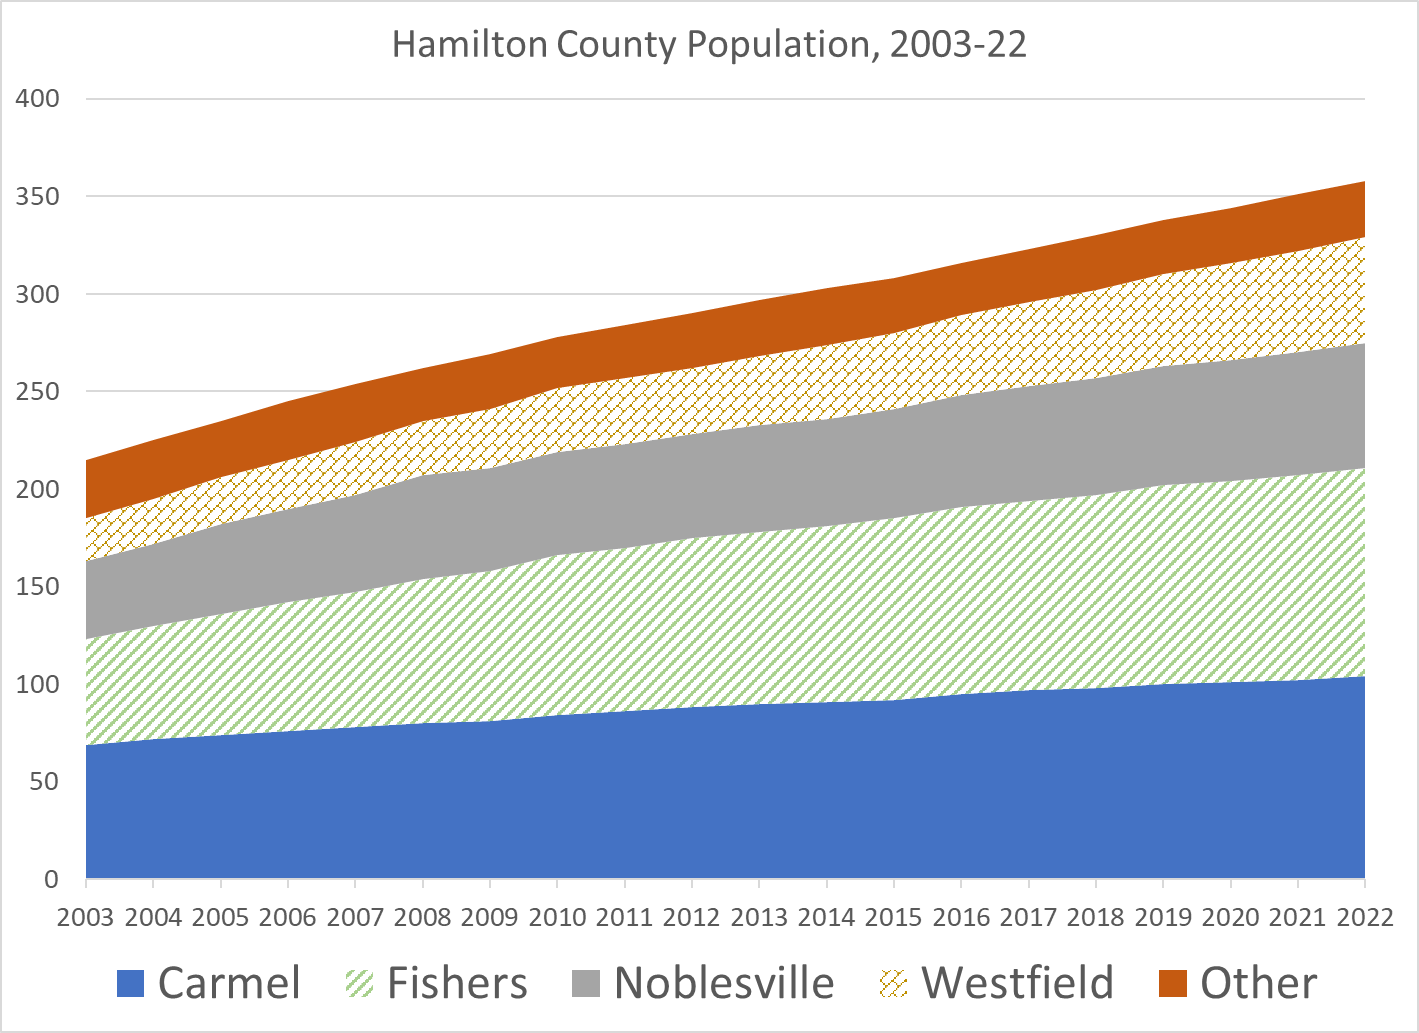
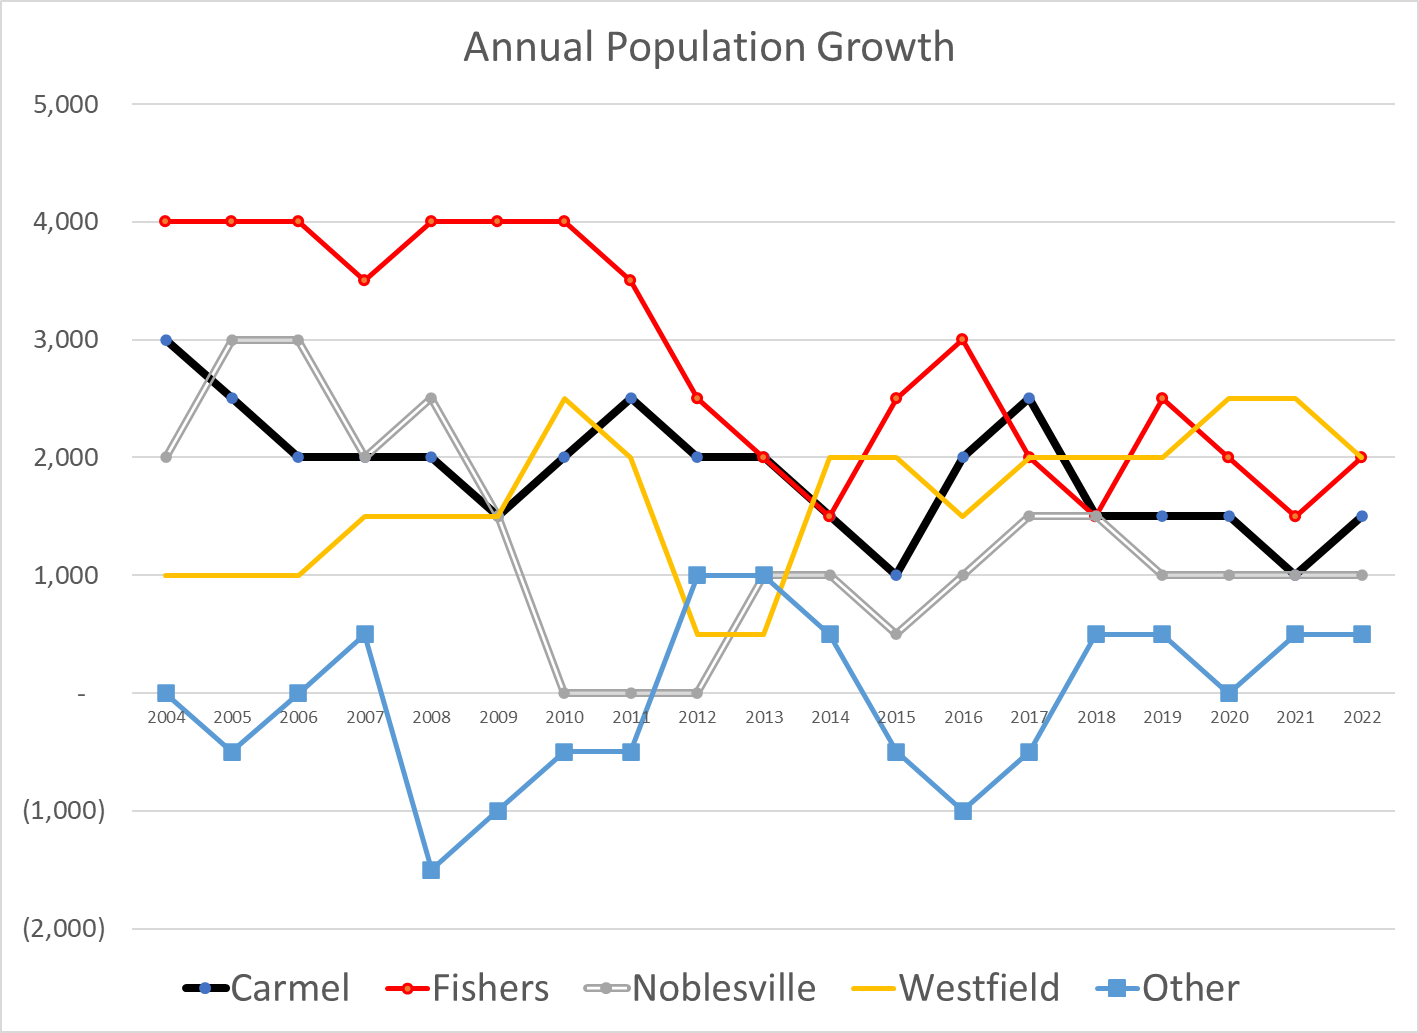
Four major cities contribute to Hamilton County’s rapid growth. Carmel was the early leader. Fishers grew even more rapidly in the 2000’s. Noblesville has continued its steady growth of 1,000 new citizens annually. Westfield has joined Carmel and Fishers in adding 2,000 residents per year, showing a higher percentage growth rate on its lower base.
The 2020 census results were significantly higher than the 2018 state of Indiana forecast update. The 2018 forecast shows Hamilton County in 2050 at 528,000 people rather than 567,000 with growth of 180,000 rather than 219,000. It has Indiana at 7.3 million instead of 7.7 million people in 2050.
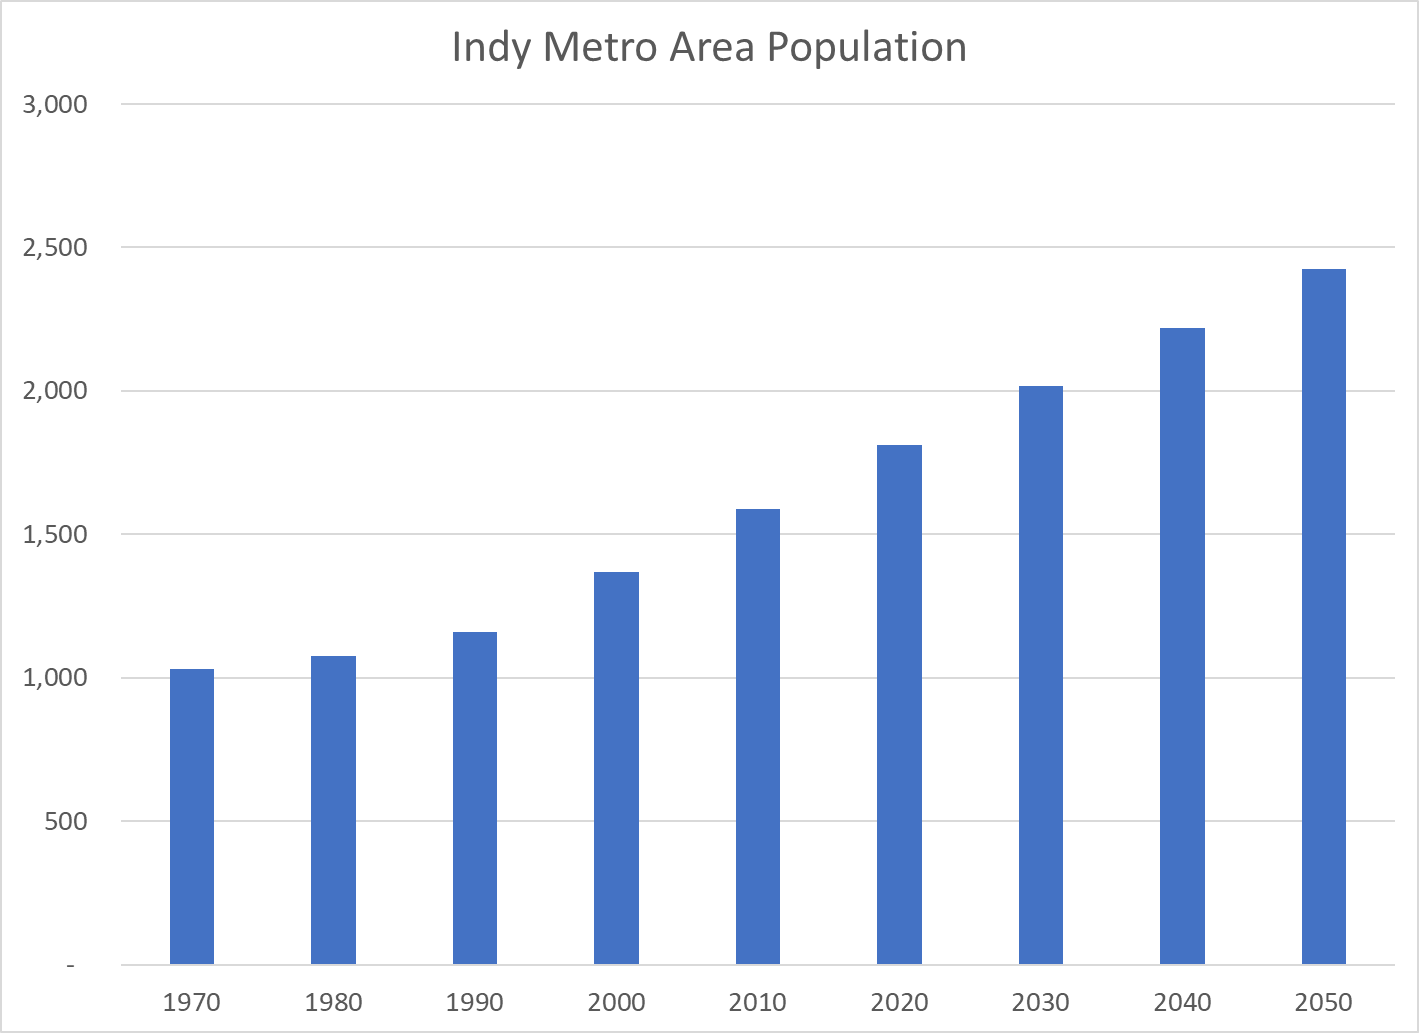
The metropolitan Indianapolis area is expected to continue to experience solid growth rates for the next 3 decades.
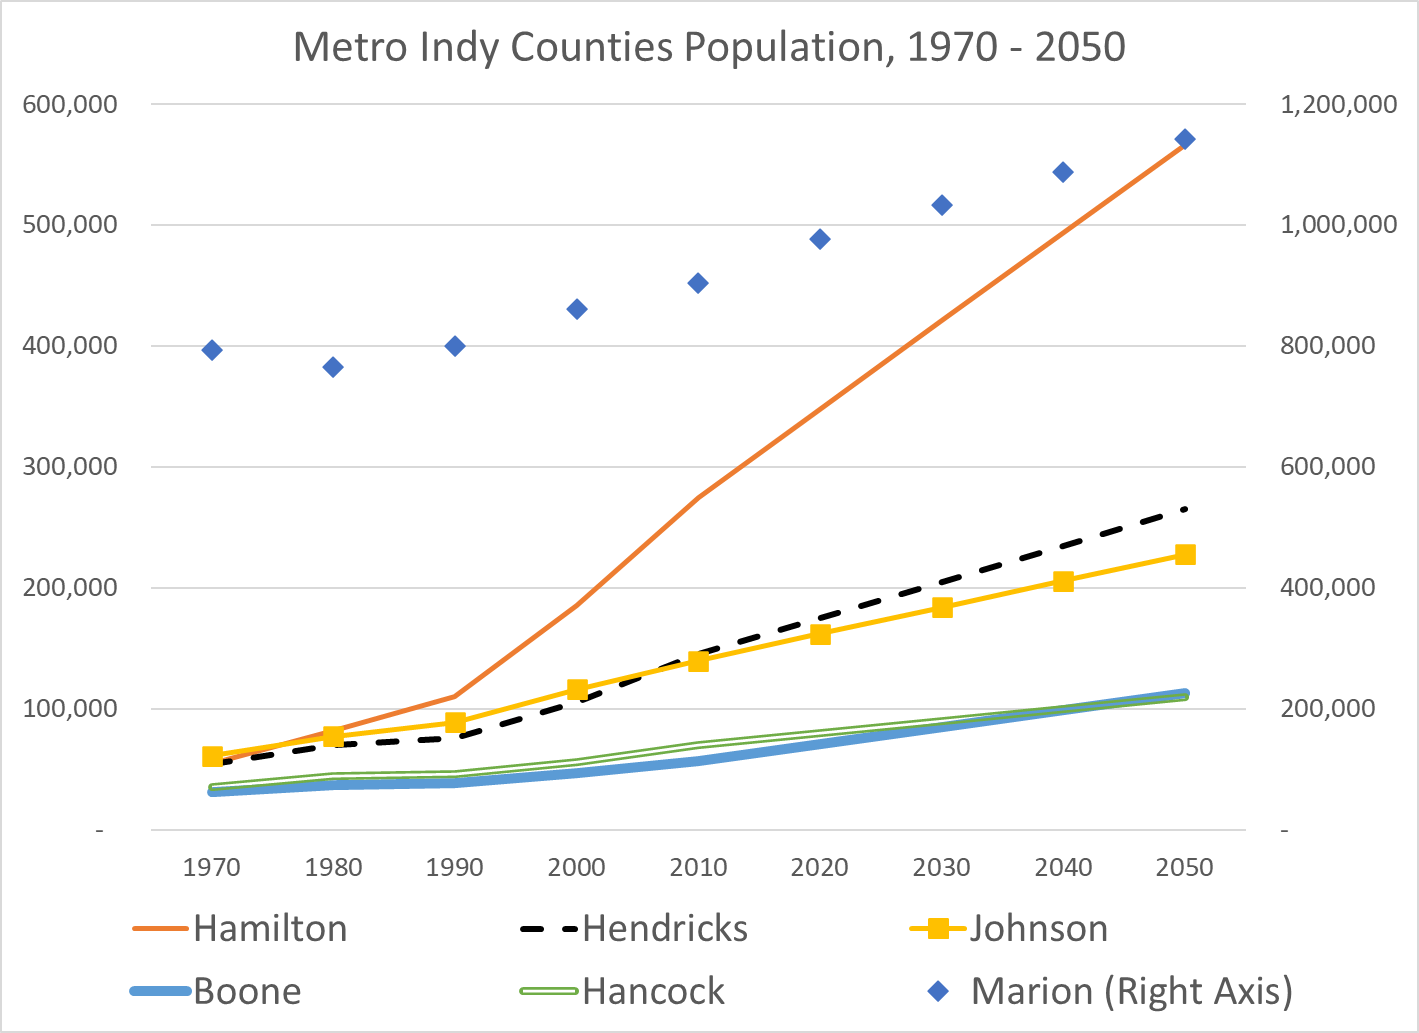
In 1970, Hamilton County had 55,000 citizens and ranked 21st of Indiana’s 92 counties. It doubled in size to 110,000 by 1990, ranking 11th largest and joining Madison, Delaware, Tippecanoe, Vigo and LaPorte as “major” counties. By 2000 Hamilton County contained 185,000 people and was ranked the 6th largest in Indiana. Hamilton continued to grow by 75,000 per decade, passing Elkhart and St. Joseph counties for 4th place by 2010. Based on these trends, Hamilton will pass Allen County by 2030 and Lake County by 2040 to become the second largest Indiana county, trailing only Marion County.
Hamilton County has grown as part of the Indy Metro area. Marion County has averaged growth of 60,000 people in the last 3 decades. Hamilton County is forecast to maintain its 73,000 per decade growth rate. The other four suburban counties are forecast to maintain their combined 80,000 per decade growth rate.
Summary
Hamilton County has enjoyed annual population growth of 7-8,000 for the last 30 years and can reasonably be forecast to continue such growth for the next 30 years. The growth of the Indy Metro area stands out versus slower growing areas in Indiana and the Midwest. Hamilton County’s four major cities continue to attract new residents and the county’s northern areas remain available for managed development within short commuting distances of the existing economic centers throughout the county. Economic growth has a tendency to be self-reinforcing. As Hamilton County approaches one-half million residents it will focus more on “managing” such growth.
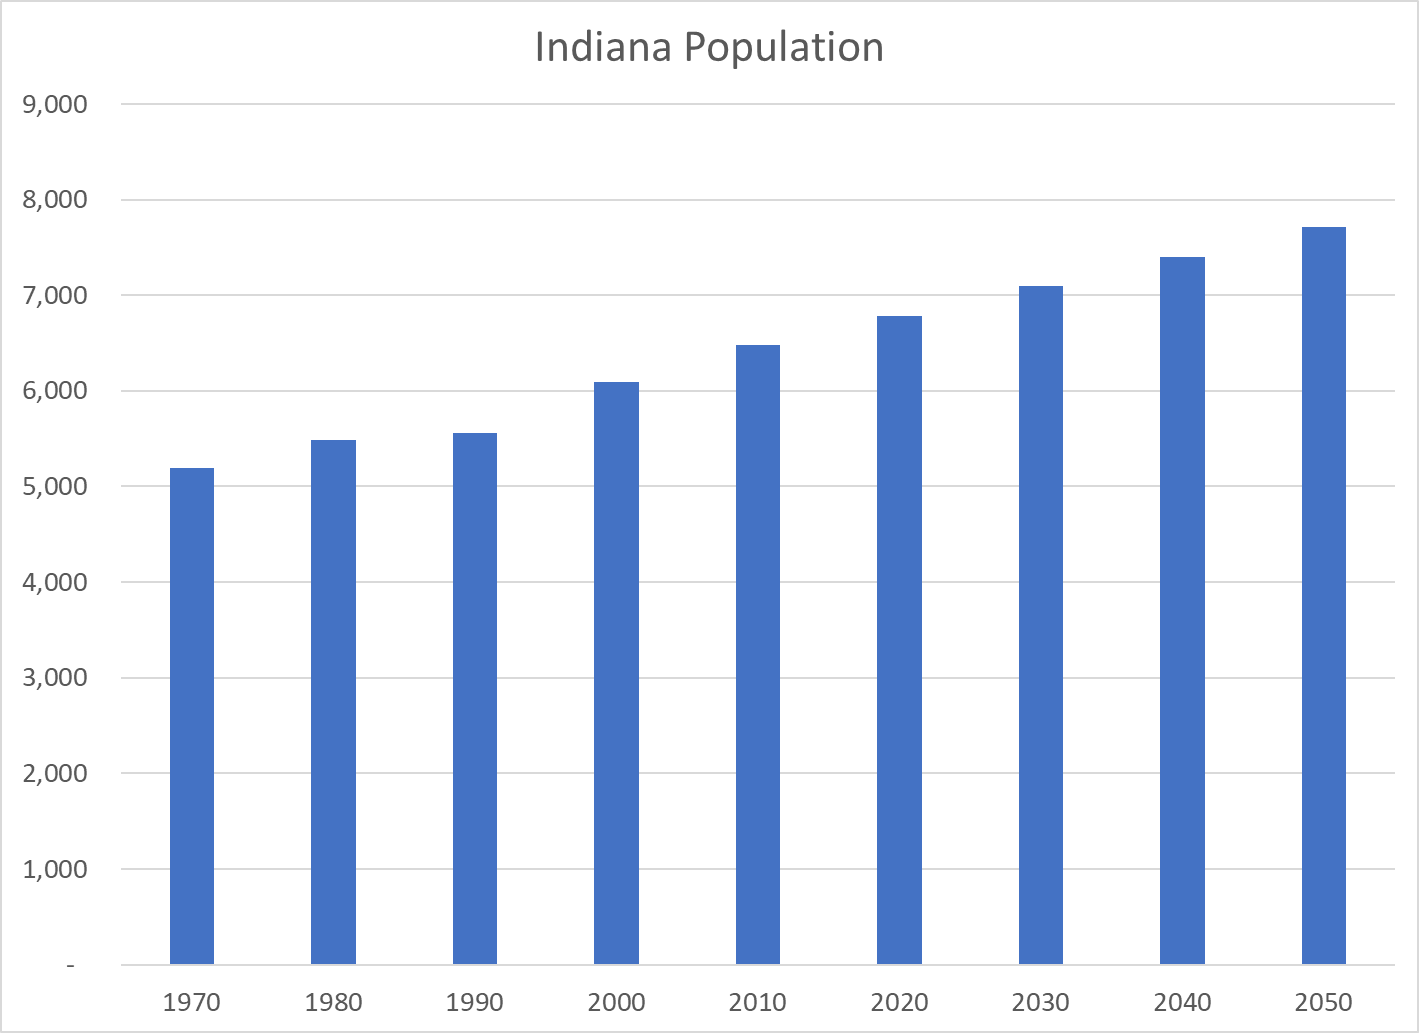
The last official forecast of Indiana’s population was made in 2012, estimating growth from 6.5M in 2010 to 7.5M in 2050. The actual population was a little higher than this forecast in 2020. My forecast is for 7.7M in 2050.
Indiana was and is an agriculture and manufacturing intensive state. Population growth slowed in the 1970’s and 1980’s before recovering in the 1990’s. Indiana added 1.2M people in the 30 years from 1990 to 2020, growing by 7% per decade, about one-half of the national average, but faster than its neighbors.
I expect the 2010-2020 growth levels to continue for the next 3 decades.
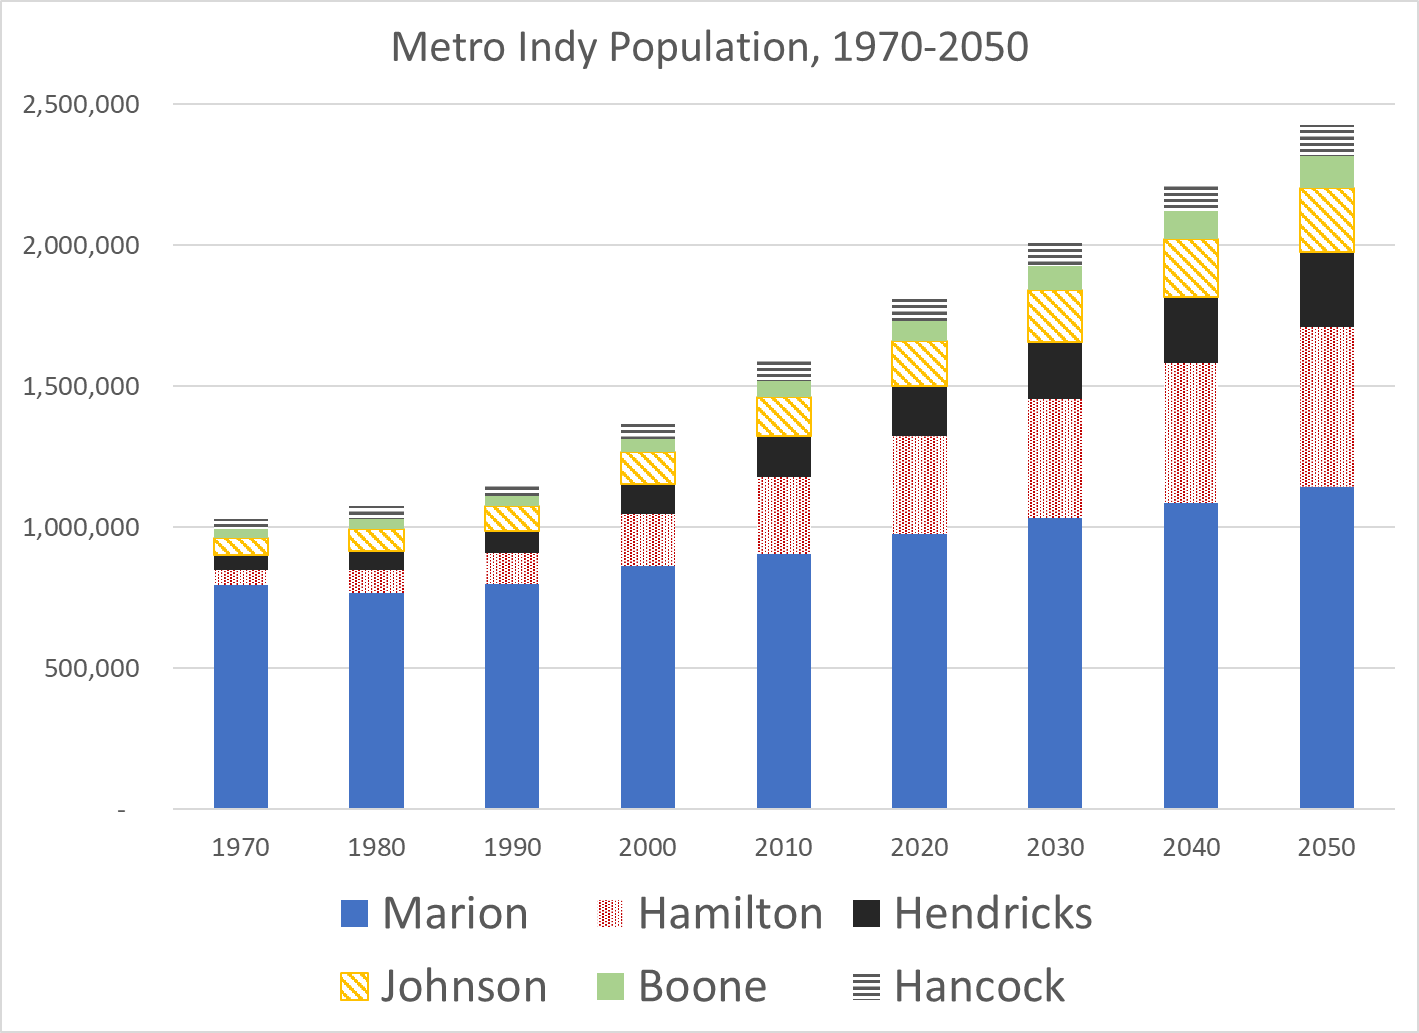
Indianapolis (Marion County) is the only major city in Indiana. It was also manufacturing intensive at the end of the 20th century. Its population growth stagnated in the 1980’s and 1990’s before recovering.
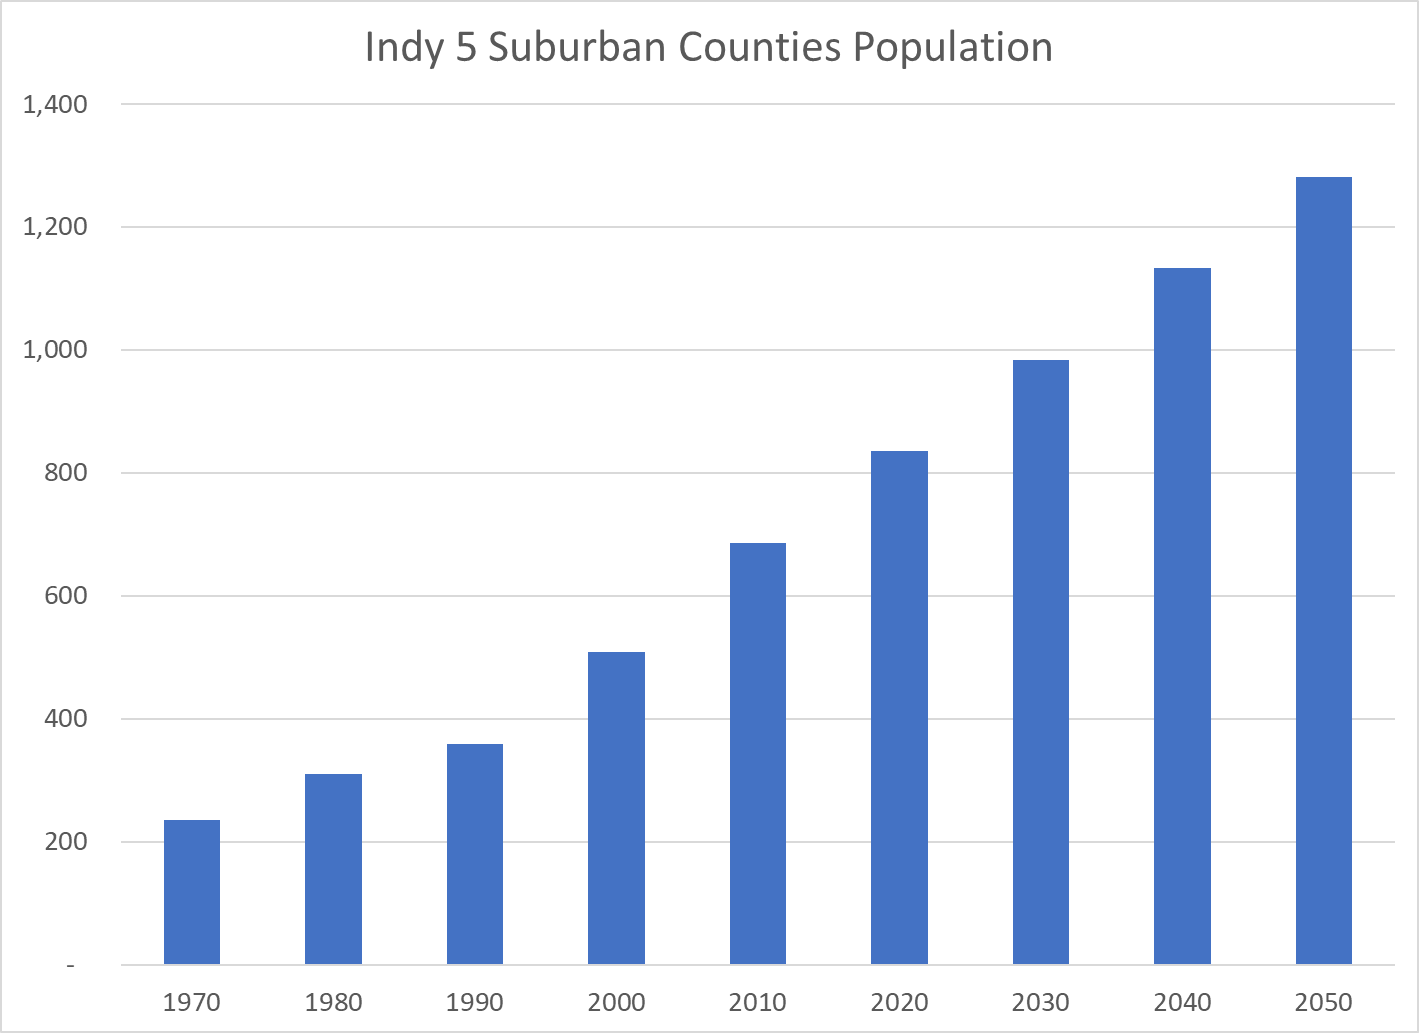
Indy’s suburbs were immaterial in 1970, but have grown to be nearly as large as the main city in 2020.
The total Indy metro area grew by 80% from 1990 to 2020 and is expected to grow at the same rate for the next few decades.
Like metro areas across the country, Indianapolis has grown much faster than the rural counties of Indiana.
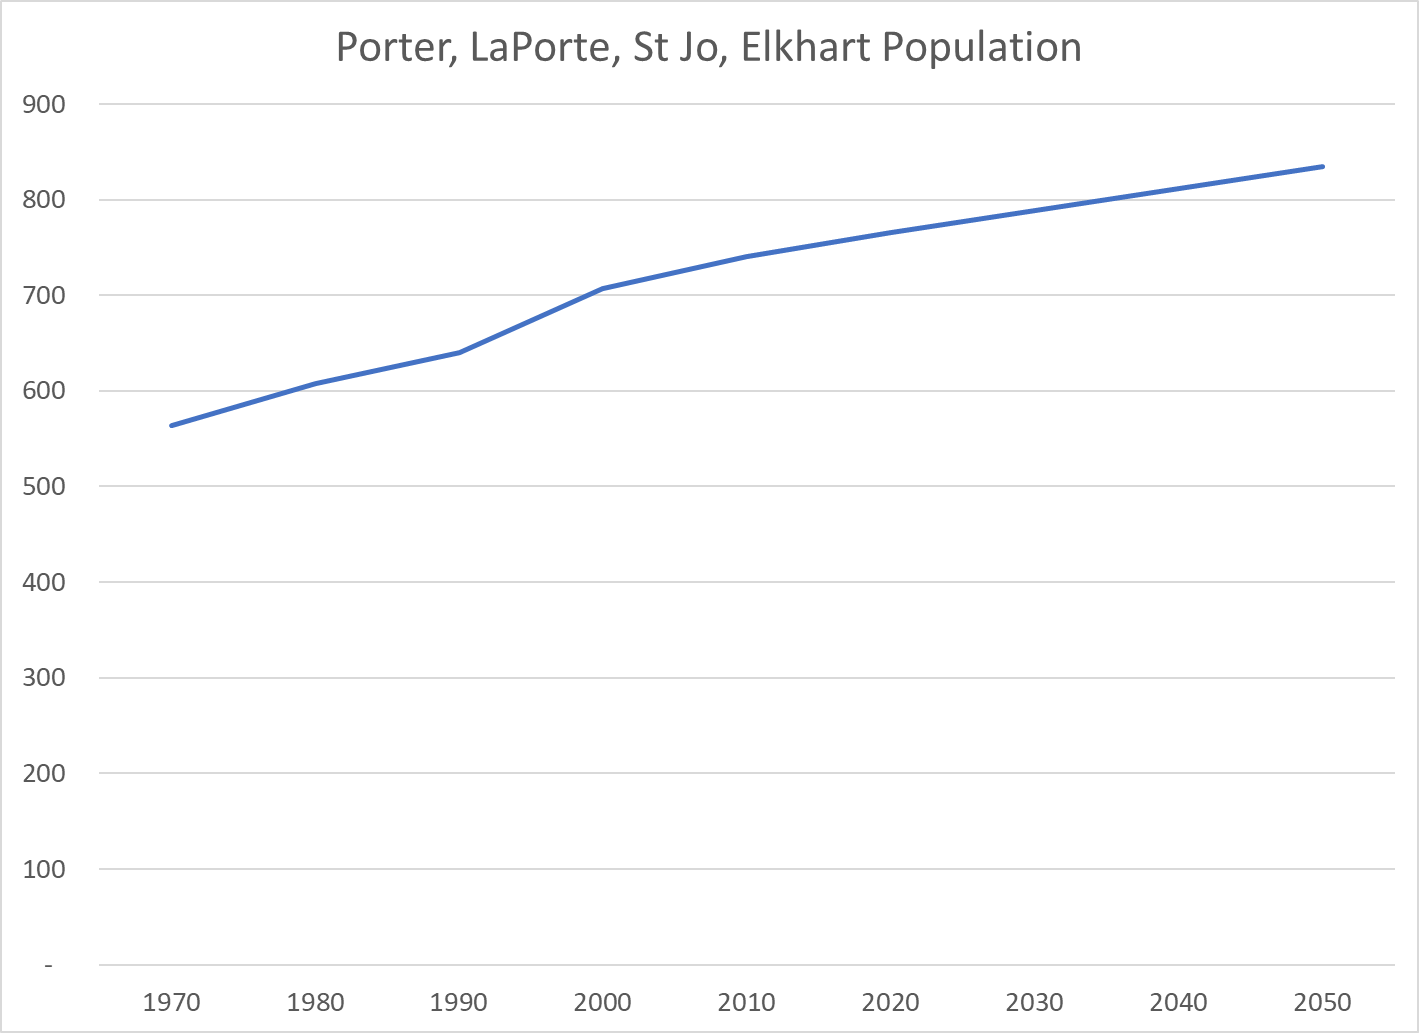
Lake County (Gary) in the northwest corner of Indiana is the second largest metro area of Indiana. Its population dropped drastically from 1970 to 1990 and has slowly recovered. This manufacturing intensive area is not considered a highly attractive Chicago suburb, but it has found sources of growth.
The four counties east of Lake County are a separate economic area and have grown since 1970 at a reasonable pace.
The I-90 corridor’s population was the same size as metro Indianapolis from 1970-1990, but their growth paths diverged afterwards.
Historically, Ft Wayne has been the third largest Indiana city. It was also a manufacturing leader, which slowed its growth in the 1980’s and 1990’s. It has since recovered and established a strong growth rate.
Indiana has 6 other minor cities that have collectively accelerated their growth since 1990. Tippecanoe and Monroe Counties benefit from their state universities. Columbus (Bartholomew) is a manufacturing leader supported by its proximity to IU and Indianapolis. Clark County is a suburb of Louisville. Evansville (Vanderburgh) has struggled to find a new economic engine due to its small size and remote location, despite the extension of I-69. Terre Haute (Vigo) has also been slow to find new engines of growth to replace its historic manufacturing strengths.
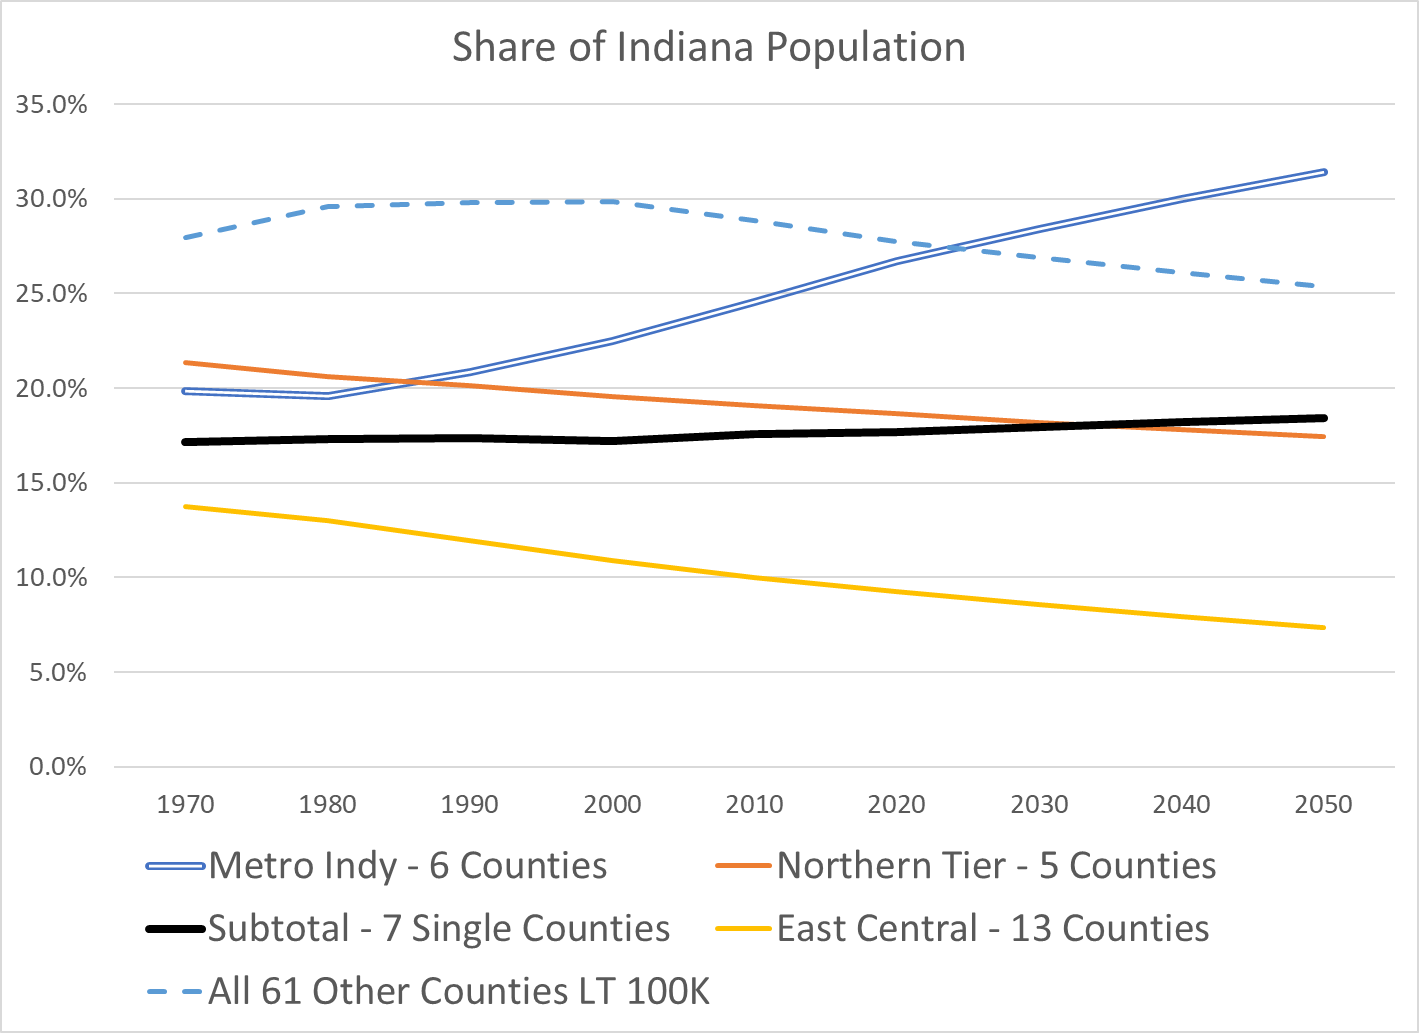
These 18 larger counties (of 92) have collectively driven almost all of the population growth in Indiana for the last 30 years. These trends are expected to continue for the next 30 years.
A broad swath of 13 counties north, east and northeast of Indianapolis have seen population declines in the last half century and will likely experience further declines. The natural gas boom, Wabash River transportation advantage and national road (US 40, I-70) advantage drove manufacturing in these areas in the early twentieth century. General Motors grew and then declined. The Ball Corporation grew and declined. Muncie was the subject of the famous Middletown sociology studies of the typical American community and this area, and the greater Indianapolis area have remained targets of marketing and political research studies. Logansport, Peru and Wabash along the river. Marion, Anderson and Muncie. Hartford City, Portland, Randolph, Richmond, Connersville, Newcastle and Rushville. The 61 other Indiana agricultural counties managed to grow slowly from 1970 to 2000 but found their limits afterwards.
In the modern world, local economies must find “critical mass” in order to succeed. Metro Indy is doing well. The I-90 corridor near Notre Dame is surviving as are the other mini-metro areas. The other 74 counties are stagnant.
Hamilton County, Indiana is north of Marion County and Indianapolis. It has grown seven-fold since 1970, from 54,000 to more than 365,000 people. It now ranks in the top 7% as the 209th largest county of the 3,142 in the US. It is the fourth largest of Indiana’s 92 counties, trailing Marion (Indianapolis), Chicago’s suburban Lake County and Allen County (Ft. Wayne) which it will surpass for third place in 2029.
The county has averaged a 7,800 person annual increase since 1990 and has maintained a 7,500-person annual increase in the last decade.
Growth reached a peak of 12,000 per year prior to the Great Recession, dropped back to 7,000 per year and has slowly grown to 8,000 per year.
As a growing suburban area, the county has benefitted from a younger population with relatively more births and less deaths. This demographic advantage has decreased through time.
On average, this natural increase advantage has provided 2,000 additional people each year for the last two decades. The net in-migration level was over 8,000 before the Great Recession, dropped in half to 4,000 before recovering to about 6,000 people per year.
The US Census Bureau’s American Community Survey (ACS) attempts to measure the annual migration flows between all 3,142 counties! It’s survey techniques generally require a 3-5 year sampling period to have statistical reliability. The US Census Data and the Indiana Vital Statistics Data (Births and Deaths) show an implicit net in-migration to Hamilton County from 2011-20 of 4,575 annually. The ACS reports just 3,124. The actual increase is 144% of the surveyed increase.
Hamilton County’s population ranged from 283-346,000 between 2011-20, for an average of 314,000. Inbound migration averaged 23,600 per year or 7.6% of the population. Outbound migration averaged 20,400 per year or 6.6% of the population. On average, the county’s population turns over every 15 years. The net in-migration in the ACS survey was 3,100, a little more than two-thirds of the implicit 4,600 net in-migration per year. I compared the 2011-2015 and 2016-2020 data and found that they were generally consistent. I believe that the proportions reported are generally accurate.
International In-Migration
ACS reports an annual average of 1,800 international immigrants. This is 59% of the net 3,100 figure; quite material. On an annual basis, this is just 0.6% of the county population, but for a decade it is 6%. 61% of Hamilton County’s international immigrants report Asia as their home continent.
Total US Migration
Net in-migration to Hamilton County from the US is a positive 1,300 per year in the ACS survey, perhaps 1,900 including the 1.46X factor. Net domestic net in-migration is two-thirds the size of international net in-migration; 0.4% annually or 4% per decade.
48 States Aside from Indiana and Illinois
Net in-migration to Hamilton County from the other 91 counties in Indiana plus Illinois averages 3,004 per year, essentially equal to all of the total net in-migration. Net in-migration to Hamilton County from the other 48 states is a negative 1,700 per year, roughly one-half of the positive overall net in-migration figure. Hamilton County receives minor positive inflows from the adjacent states of Ohio, Michigan and Kentucky. It sends 1,000 residents to Texas each year and receives just 400 in return. Texas accounts for one-third of Hamilton County’s net out-migration aside from Indiana and Illinois. Hamilton County exports 1,200 residents annually to Florida but an equal 1,200 return each year.
Chicago, Illinois
In the last decade 1,500 people annually moved to Hamilton County from Illinois (Chicago) and just 700 returned the favor. Hamilton County received a net 800 residents from Illinois each year in the past decade. This is one-fourth of the net in-migration to Hamilton County. Many Hamilton County college graduates make Illinois their first professional home, so the flow of experienced professionals from Chicago to Hamilton County is probably more than 1,500 per year.
Marion County, Indiana (Indianapolis)
Hamilton County’s Carmel, Fishers, Westfield and Noblesville claim that they are “edge cities” somewhat independent of Indianapolis. In the last decade a net 3,300 migrants from Marion County chose to make Hamilton County their home each year, accounting for more than ALL of the ACS survey’s 3,100 annual increase. Marion County has nearly 1 million people and continues to grow slowly despite this 0.3% annual leakage to Hamilton County.
College Students
Hamilton County school graduates have very high college attendance rates. Hamilton County exports 2,600 students each year to IU, Purdue and Ball State and receives 1,000 back, for a net out-migration of 1,600 per year, about one-half of the net in-migration figure.
Indiana
Hamilton County has a minor net in-migration from sparsely populated Boone County to its west (300/year). It’s net in-migration with the 8 nearby counties, including Boone, is a 500 loss. Hamilton County is an attractive suburban destination, but net net it loses 500 residents annually to nearby counties other than Marion.
Setting aside Marion County and the 3 university counties, Hamilton County attracts 500 new residents annually from the other 87 Indiana counties.
Summary
Hamilton County enjoys a 2,000-person annual natural population increase due to its relatively young age profile. Half of its 6,000-person annual net in-migration is driven by international immigrants attracted to its schools, amenities, services and culture. Most of its remaining growth is driven by nearby Marion County residents who are seeking the same results. Hamilton County is attracting residents from Chicago as retirees, commuting residents or transplants. Hamilton County loses about 2,000 college students each year who migrate into a national labor market. This is an opportunity for further population growth. It also shows that the net 3,100 growth per year figure understates the attractiveness of this county to all potential migrants.
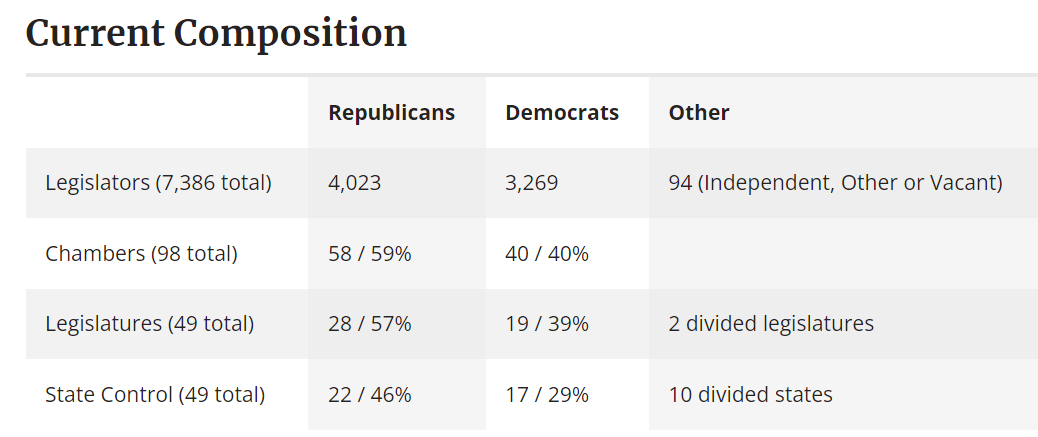
For most of the 20th century, states outside of the “Solid South” had a competitive two-party system and mixed party results for the three bodies of government. In President Obama’s first midterm election in 2010, Republicans added ten new state trifectas, managing all 3 elected branches of government. Democrats have fought back, increasing their count of trifectas in the last 5 years. Political analysts assert that this increased clustering of results at the state level is due to the increased polarization of the electorate and the “nationalization” of political issues at the state level. Proponents of a federalist delegation of powers to the state level hope that this will result in greater experimentation in state policy results and tests of the effectiveness of those partisan policies.
State level trifectas allow political parties to implement policies that they prefer, without regard to the opinions of the opposition. They also allow ruling parties to pass laws that signal their support for their constituents’ political preferences. They can deliver on their election promises. Many of these laws address partisan or “wedge” issues: abortion, gun control, marijuana, unions, wages, health care, education, the environment and infrastructure.
Democrats have a small advantage in the number of people represented by trifecta governments.
2022 Election Helped Democrats
The 2022 election was better than expected for Democrats. They were especially pleased to achieve trifecta status in Maryland, Massachusetts, Michigan and Minnesota (what are the M odds?).
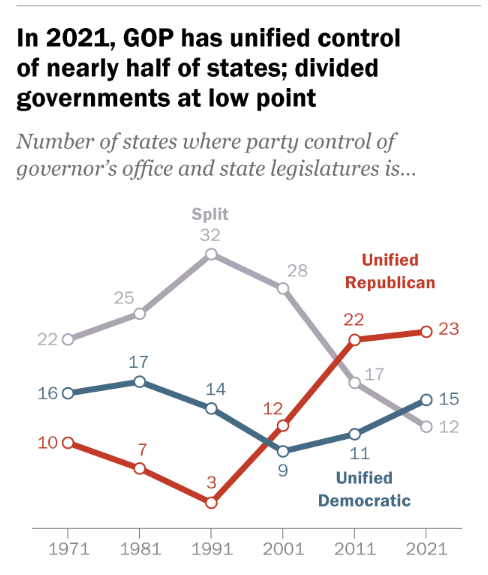
During the 1970’s and 1980’s, Democrats held 15 trifectas, mostly in the South, while Republicans held a little more than 5. In the 1994 midterm election during Bill Clinton’s first term, Republicans won handily at the national, state and local levels. Democrats lost 10 trifectas which they would not recover until 2008. Republicans added a dozen trifectas and led the Democrats by 16-8 for most of the next decade.
In George Bush, Sr.’s second mid-term election in 2006, Democrats recovered most of their losses at the state level, gaining a 15-10 lead in trifectas.
The Republican gains during Obama’s first midterm election in 2010 were historic, creating a 23-11 Republican lead in trifectas and setting patterns of state control that have largely continued since. Analysts pointed to the economy, health care, the tea party, immigration, race, scandals and Republican election investments at the state level.
Ballotopedia provides year by year trifecta data which allows us to show how the Republican party has built and maintained its dominance in the last 25 years and how the Democratic party has shown signs of strength in the last 5 years.
Republican State Trifectas Maintained Since Year …
1995- Utah, Idaho, North Dakota and South Dakota
1999- Nebraska and Florida (except 2010)
2003-5 – South Carolina, Georgia and Texas (9 cumulative)
The Republicans got started earlier and were more effective at “locking down” states, but the left versus right political alignment in the country has allowed Democrats to partially “catch up” recently.
The two parties have a similar number of states at risk of losing their trifecta status. Montana, New Hampshire and Arizona for the Republicans (3). Maryland, Massachusetts, Michigan and Minnesota for the Democrats (4). Based on history and trends, Democrats (2) hope to see Nevada and Vermont join their trifecta team. Republicans (5) have even more candidates in Kansas, Louisiana, Kentucky, Wisconsin and North Carolina.
Summary
39 of 50 state governments are controlled by a single party. This pattern is likely to continue. States are using this power to shape election rules and ensured continued local political party control and are making policy choices that make the differences between red and blue states more distinct.
Finkam won 36% of the primary vote versus 32% each for Woody Rider and Fred Glynn. Her 4,595 vote total was just 400 higher than her two opponents. Finkam and Rider are experienced city council persons who have mostly supported the pro-growth, pro-density, pro-investment, pro-debt, pro-quality of life policies of 28-year mayor Jim Brainard. The mayor has been able to pursue a moderate, activist strategy as a Republican in this high income, growing suburb because he has delivered positive results. Finkam emphasized transparency and governance improvements in her campaign. Glynn campaigned and voted as a “fiscal conservative”, previously winning district elections for county council but losing elections for mayor and state representative. Rider was endorsed by Mayor Brainard and mostly campaigned on a continuation of the mayor’s policies, even though he had opposed the mayor on a number of issues historically.
Carmel has 63 precincts. Finkam won 25 while Rider and Glynn each won 19. This was a true three-way election. Finkam exceeded the neutral one-third of the vote in her winning precincts by 480 votes while Glynn beat the 33.3% benchmark by 323 votes and Rider gained 158 net votes in his winning precincts. In her 25 winning precincts, Finkam mostly pulled extra votes from Glynn. In Glynn’s winning precincts he earned 284 votes above the neutral level, reducing Rider’s votes by 188, but Finkam’s by just 96. In Rider’s winning precincts he earned an extra 193 votes, reducing Glynn’s votes by 158 and Finkam’s by just 34. To summarize, Finkam won the most precincts, and she won a few extra votes in the precincts that she did win. She and Rider both won votes from Glynn while Glynn mainly took votes from Rider.
Finkam enjoyed an average winning margin of 29 votes in her winning precincts compared with 23 for Glynn and 16 for Rider.
Finkam’s top 10 winning precincts delivered 518 extra votes versus 430 for Glynn’s top 10 and 238 for Rider’s top 10.
Two measures of “clearly winning” precincts mostly provide the same results. I used the standard deviation of percentage votes earned and the standard deviation of votes won above the one-third expected level to determine “clear” precinct winners.
Finkam clearly won 12 precincts, Glynn 10 precincts and Rider 5 precincts. Finkam clearly lost just 5 precincts while Gynn lost 12 and Rider lost 9. On a net basis, Finkam clearly won 7 precincts, Glynn lost 2 and Rider lost 4.
In a close 3-way race, two candidates can win more than one-third of the votes. Carmel has 63 precincts so 21 is the minimum required for a win. Finkam earned at least one-third of the votes in 39 precincts compared with Rider’s 26 and Glynn’s 24.
Finkam had the fewest 3rd place finishes, losing 17 districts, compared with 21 for Rider and 25 for Glynn.
Another way to slice the vote is to compare the number of votes versus a neutral 33.3% finish. The distribution of votes at the precinct level points to 15 extra or short votes as a material win or loss. Finkam earned a dozen such wins and just 4 losses by this measure. The net vote result in these precincts was 297, indicating that vote differences in just one-fourth of the precincts delivered her win. Glynn had 8 positive and 12 negative precincts with a net loss of 114 votes. Rider had 3 winning and 10 losing precincts, resulting in a loss of 142 votes.
Finkam’s precinct votes were most opposed to Glynn’s, with a negative correlation (R) of -0.60. Her correlation with Rider was a much lower -0.39. Glynn and Rider reported a middle level correlation of -0.52.
Rider’s 5 clearly winning precincts were broadly scattered. Foster Grove, Northwood Hills, Windemere, Lennox Trace and Westfield. He was competitive in most precincts but did not have a clear winning pattern.
Glynn leveraged his strengths around his home and campaign history near 106th and Keystone. He strongly won 7 precincts in this area: Orchard Park, The Woodlands, Holaday Hills and Dales, Homeplace, College Plaza, Chesterton and Carolina Commons. He also won 3 older areas of Carmel: west of Clay Terrace, 136th/Guilford = Old Meridian/Main Street and Thistlewood at 136th/Spring Mill.
Finkam’s strength was in the newer and wealthier areas north of Main Street (131st Street). She won Cool Creek North and Foster Ridge in the central area of Carmel. On the west side, she won Hunter’s Knoll, Spring Mill Ponds, Spring Mill Streams, Spring Mill Farms and Kingsborough. On the east side she won Plum Creek Farms, Avian Way, Settlers Ridge, Cherry Tree Grove, Briarwood and Legacy at 146th/River Road.
Carmel’s voting precincts can be divided into 9 geographical areas using 116th and 131st/Main Street to divide vertically and Spring Mill Road and Keystone/Carey Road to divide horizontally. By this split, Finkam won 4 regions (W, N, NE and NW), Glynn won 4 regions (C, S, SE and SW) and Rider won a single region (E). Finkam won a very strong 44% of the vote in the northeast, gaining 258 votes, mostly at the expense of Glynn. She also won a solid 39% in the northwest, winning 65 votes, mostly from Glynn. Glynn had a strong showing in his home South area, earning 46% and 142 votes, but his advantage was divided between lost votes by Finkam and Rider. He also earned a strong 39% share in the Southeast, but these extra 58 votes were mostly taken from Rider. Glynn had small wins in the Central district, taking 17 votes from Finkam and in the Southwest district, capturing 26 votes from Rider. Finkam’s fourth winning district mainly took 38 votes from Glynn. Rider’s single winning district was a near tie with Finkam, taking a total of 92 votes from Glynn.
Overall turnout was just 19.7% in Carmel in this municipal election. 86% of voters cast ballots for the Republican mayor’s race. This makes the ratio of Republican primary voters to registered voters just 16.4%, or one out of six registered residents.
Turnout in the precincts won by Finkam, Rider and Gynn varied materially from 18.3% to 16.0% to 14.2%, respectively. If the precincts all had 16.4% Republican primary voter turnout, Finkam would have lost 62 votes and Glynn would have earned 76 additonal votes, a small fraction of the 400 vote margin.
Rider and Finkam together won 68% of the vote, confirming that two-thirds of Carmel voters generally approve of the retiring mayor’s general strategy and policies. Finkam was able to solidly convince the northern subdevelopment residents that she would do a better job than Woody Rider.
Democrat Miles Nelson was elected to the city council in 2019. He is running for mayor this year. Carmel has become more Democratic in the last 20 years. I don’t think that a majority of Carmel voters will reject the path of the last 3 decades.
Conservative, suburban, small town Indiana Carmel elected Jane Reiman and Dottie Hancock as women mayors from 1980-1992. I think that Sue Finkam gets a small advantage as a woman candidate in this environment.
Debra Jenks was appointed to the New College of Florida board on January 6, 2023 by Florida Governor Ron DeSantis as part of his attempt to re-engineer the small public liberal arts honors college.
Debra is a 1980 New College grad, earning an Economics degree with a senior thesis on “Railroads”, sponsored by Dr. Dana Stevens. She earned a law degree from Lewis & Clark College and has practiced law in Florida for several decades.
Debra Jenks has been active in her local legal profession, serving as President of the North County section of the Palm Beach Bar Association in 2008.
Robert Harvey continued with his separate legal practice after their marriage, but they worked together for 7 years from 2015-22.
Securities Attorneys
What does a “securities attorney” do? Robert and Debra were quoted as saying “For us, it means we’re either defending financial advisors and brokerage firms against lawsuits filed by customers or actions taken against them by regulators, or we’re representing customers. Firms must arbitrate disputes between each other. As a litigation firm, we defend our clients once the regulators like FINRA, the SEC (Securities and Exchange Commission), and state regulators come after them.”
What is Enterprise Florida, Inc? A separate organization used to promote Florida business. What is the Florida Opportunity Fund? A subsidiary that invests on behalf of the state of Florida.
There have been historical political battles about having a separate organization not directly accountable to the legislature and questions of spending and excessive compensation and political appointments. It appears that the governor and legislature found mutual ground in 2022 and revised the governing statute and agreed upon direct and indirect budgets.
Debra Jenks and Robert Harvey are active political supporters of Florida Governor Ron DeSantis. Stakeholders of New College of Florida should consider this regarding her service on the Board of Trustees.