
Today we look back at the depression, the war and its aftermath as largely irrelevant to modern society, economics, trade, politics and character. Au contraire. There is much to learn from the experiences of key figures from the mid-thirties through the mid-sixties.
Category: leadership
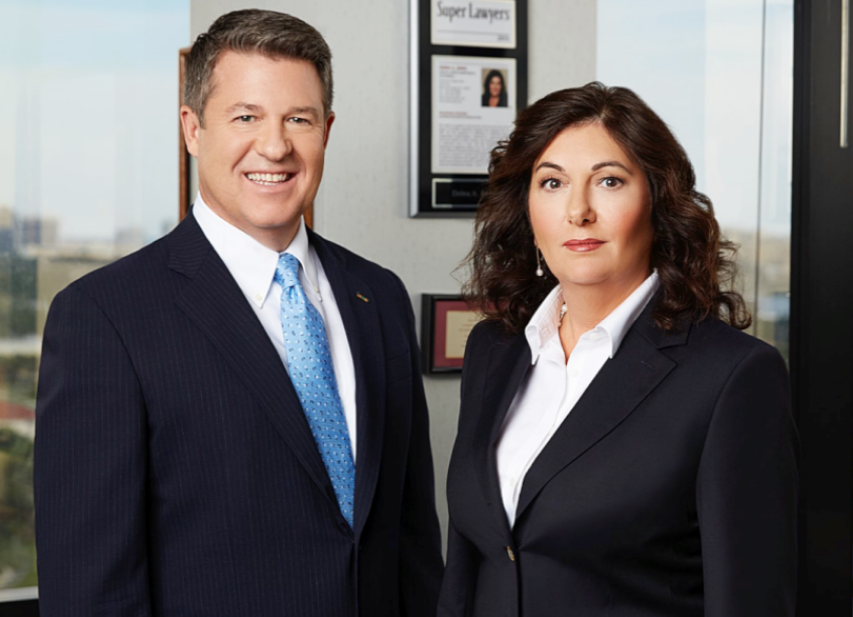
New College of Florida Board Chair: Jenks & Harvey LLP, Power Couple
‘https://bizpacpbc.com/west-palm-beach-power-couple-judge-the-judges/
Debra Jenks was appointed to the New College of Florida board on January 6, 2023 by Florida Governor Ron DeSantis as part of his attempt to re-engineer the small public liberal arts honors college.
Debra is a 1980 New College grad, earning an Economics degree with a senior thesis on “Railroads”, sponsored by Dr. Dana Stevens. She earned a law degree from Lewis & Clark College and has practiced law in Florida for several decades.
Debra Jenks has been active in her local legal profession, serving as President of the North County section of the Palm Beach Bar Association in 2008.


https://www.linkedin.com/in/robert-harvey-44190610/details/experience/
Robert Harvey continued with his separate legal practice after their marriage, but they worked together for 7 years from 2015-22.
Securities Attorneys
What does a “securities attorney” do? Robert and Debra were quoted as saying “For us, it means we’re either defending financial advisors and brokerage firms against lawsuits filed by customers or actions taken against them by regulators, or we’re representing customers. Firms must arbitrate disputes between each other. As a litigation firm, we defend our clients once the regulators like FINRA, the SEC (Securities and Exchange Commission), and state regulators come after them.”
https://www.finra.org/arbitration-mediation
Judicial Nominating Committee (JNC) Members
Debra was first appointed to the 4th District Court of Appeals Judicial Nominating Committee in 2012 and has served as its Chairperson.
Robert was first appointed to the 15th Circuit Judicial Nominating Committee in 2015.
Political Donors
Their law firm donated $1,000 to the DeSantis campaign. (page 17)
Federalist Society Members
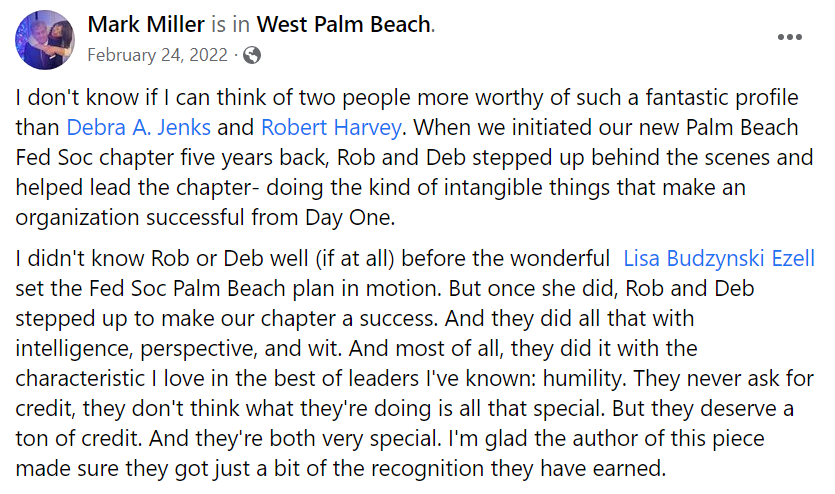
https://www.facebook.com/groups/196338439232/
https://en.wikipedia.org/wiki/Federalist_Society
Political Appointees of Governor DeSantis
For Debra, see the first link for her January, 2023 appointment. For Robert:

https://www.linkedin.com/in/robert-harvey-44190610/details/experience/
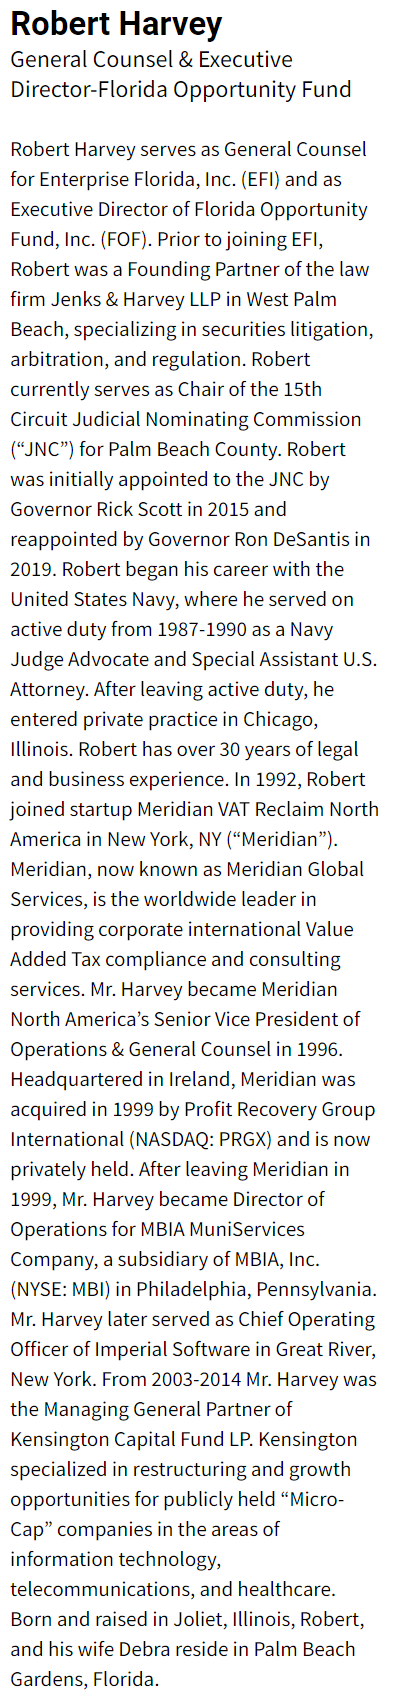
https://www.enterpriseflorida.com/about/efi-leadership/
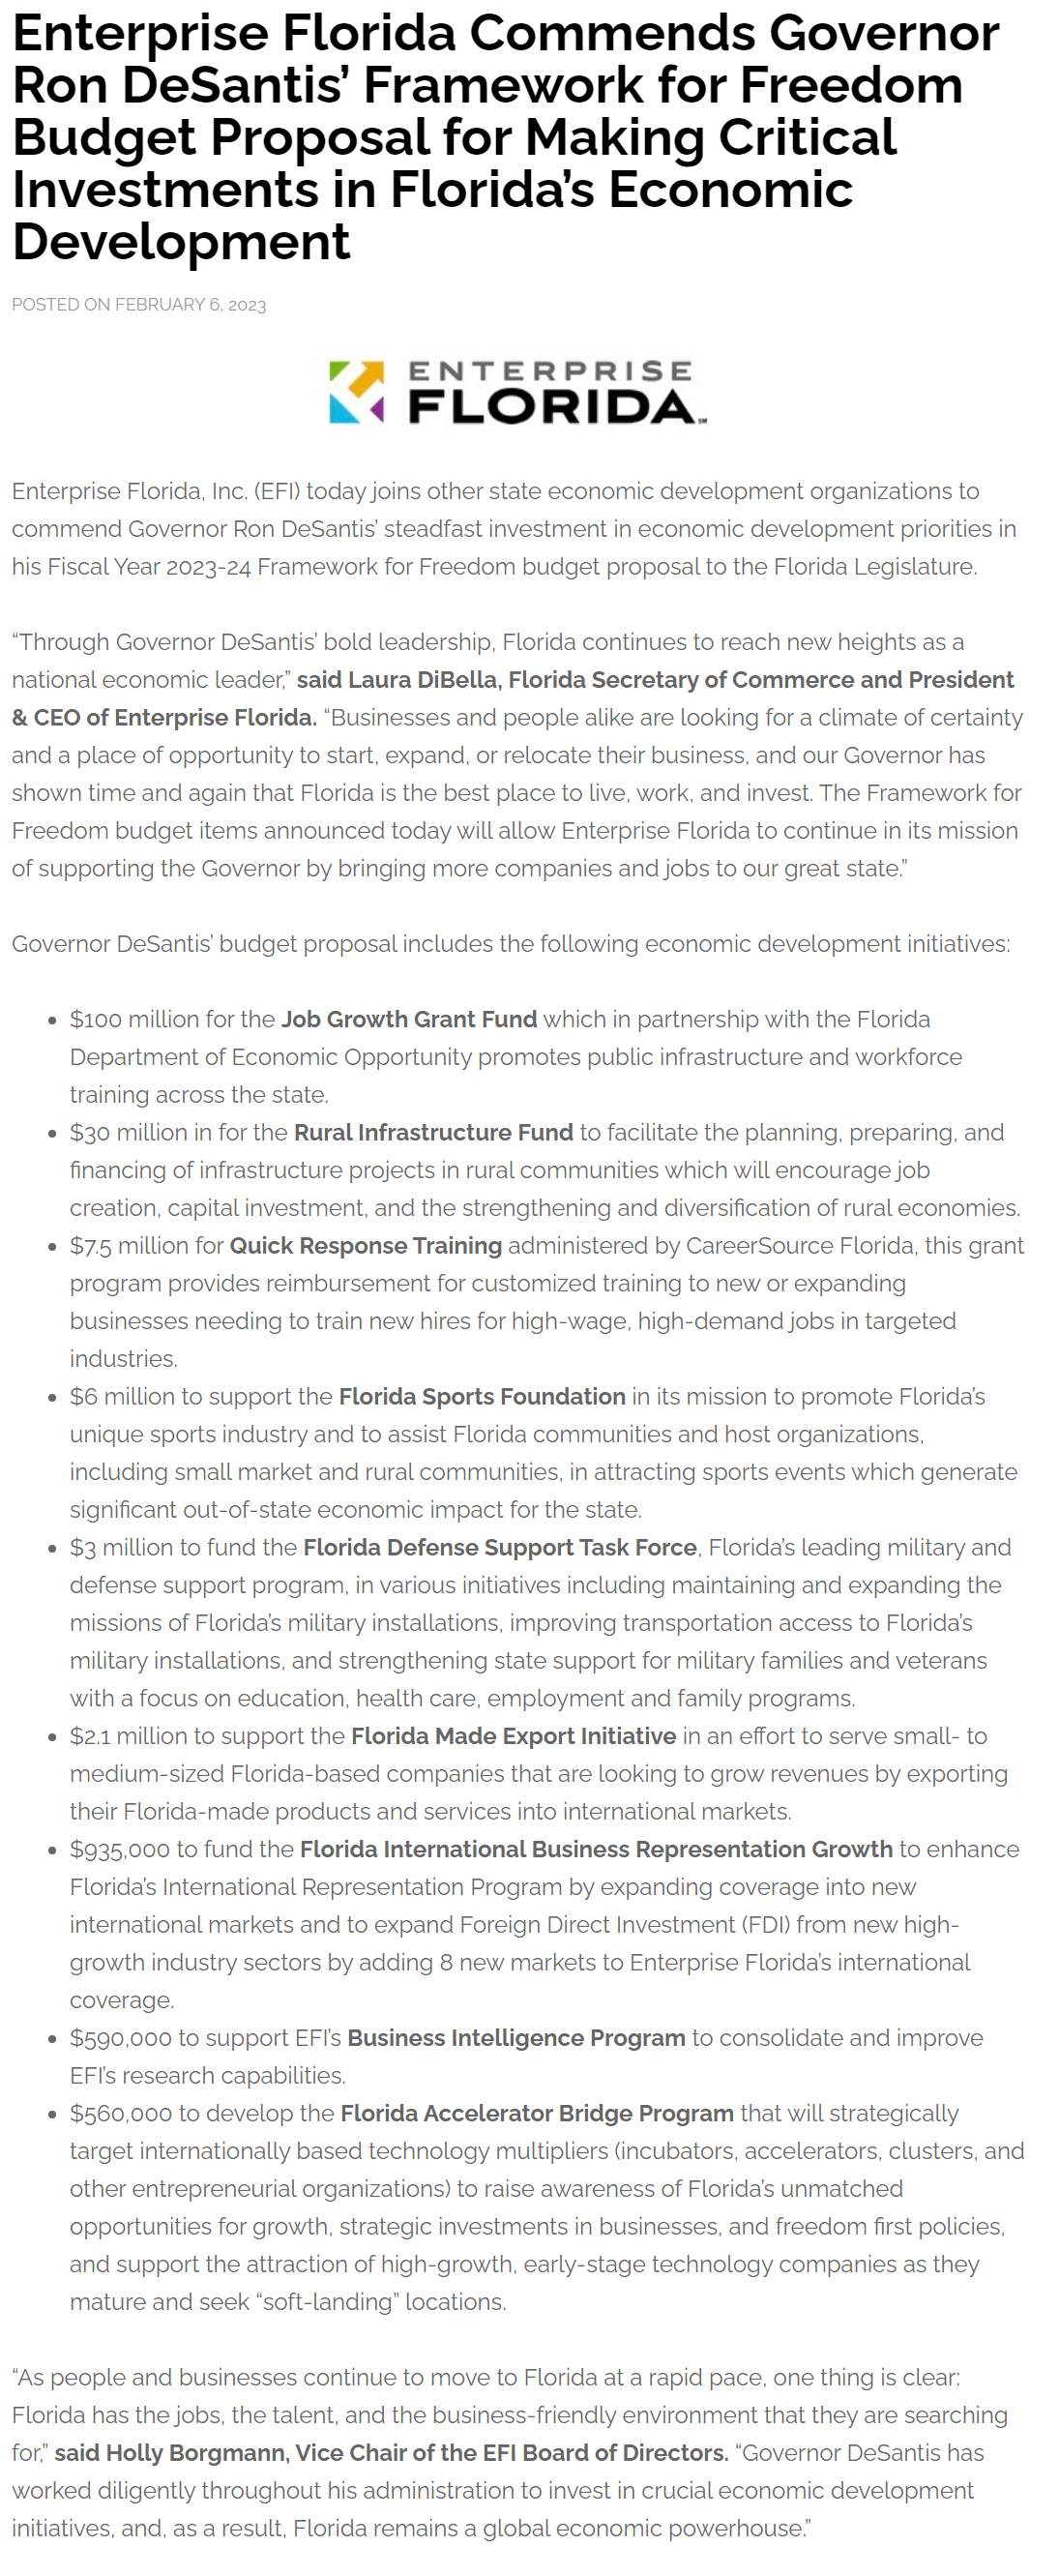
What is Enterprise Florida, Inc? A separate organization used to promote Florida business. What is the Florida Opportunity Fund? A subsidiary that invests on behalf of the state of Florida.
There have been historical political battles about having a separate organization not directly accountable to the legislature and questions of spending and excessive compensation and political appointments. It appears that the governor and legislature found mutual ground in 2022 and revised the governing statute and agreed upon direct and indirect budgets.
Employee compensation is not recorded on the state’s central website.
https://salaries.myflorida.com/
https://www.enterpriseflorida.com/about/transparency/
The governor describes this as a miraculous organization.
https://www.enterpriseflorida.com/about/
Summary
Debra Jenks and Robert Harvey are active political supporters of Florida Governor Ron DeSantis. Stakeholders of New College of Florida should consider this regarding her service on the Board of Trustees.
“We are a duo”.
https://www.sportsnet.ca/nhl/video/ovechkins-backstrom-star-hilarious-life-insurance-commercial/


DeSantis’ Revolutionary Board Appointments

During 2021-22, Florida Governor Ron DeSantis appointed 29 people to various Florida state college and university boards.
They included 8 business leaders, 3 real estate professionals, 5 doctors, 3 lawyers, 2 accountants, 3 educators, a banker, a farmer, a government leader, a not-for-profit leader and a public relations leader.
The 11 news articles emphasized the nominees’ professional and civic achievements. None mentioned any strategic agenda or revolution desired by the governor.
22 men and 7 women.
Every nominee was a Florida resident, with most highlighting their long ties to the state. One was touted as a “fifth generation” Okeechobee resident. Most highlighted their Florida college degrees. A handful listed experience with national US firms or military experience. Many listed their other board of director experience. Only 3 had obvious political roles in their biographies. Dr. Madhu Sasidhar, president of Cleveland Clinic, Port St. Lucie is the only nominee with limited Florida ties.
A Revolution Only at New College of Florida
The governor’s office, board nominees, journalists and advocates from both parties highlight that the 6 recent 2023 appointments to New College of Florida’s board are intended to “revolutionize” the small (700 student) college in Florida.
The governor is only revolutionizing one institution. This appears to be for national political purposes. Florida voters, visitors, alumni and politicians need to consider what their response would be if the governor, of his own accord, decided that it was time to “revolutionize” an institution that they attended or supported.
https://news.ufl.edu/2021/02/governor-appointed-bot-members/
https://www.sjrstate.edu/press2021/21-buchanan-board.html
New College of Florida, Founded 1956-64

A Very “New” Educational Program for 1964
The “contract system” replaces distribution requirements. Students cooperate/negotiate with a faculty sponsor to define their “program of study”, term by term. Foreign language requirements gone. Western civilization gone. Religion gone. Humanities gone. Science gone. Each student will have a “major” in order to graduate, but the first 1-2 years can be very flexible. The student-faculty relation/interaction is essential. Starting with just 100 “high potential” 18-year-olds in 1964.
Narrative evaluations replace letter grades. Pass, fail or incomplete. Faculty try to clearly define “mastery” up front for each course, tutorial or project. Real feedback is provided in person and in writing regarding progress and “opportunities for improvement”. Faculty and students are fellow learners, but standards are high; basically elite graduate school level.
Many independent study projects are required for all students. Tutorials with significant “independent study” components are offered by faculty to cover subjects not frequently offered. Students are encouraged to ” define their program of study, including the creation of interdisciplinary majors.
A senior “honors thesis” is required for graduation. The ability to research and write at a high level is required. Students must pass an oral examination of their thesis and related “major” program of study. Quasi-graduate school for undergraduates.
https://en.wikipedia.org/wiki/New_College_of_Florida
Economic Context Circa 1960
The US is leaving behind the pains of the 1930’s and 1940’s, enjoying more than a decade of solid economic growth. The business cycle is still very relevant. Rapid and extended post-war growth was unexpected once the economic demand of the war fell off. General economic growth into the future is now generally expected by 1964. The Keynesian economic model and policy prescriptions appear to be working. But true poverty continues in both urban and rural areas, especially among the elderly. Union-management relations remain tense, with strikes and labor actions frequently in the news.
Social Context
This is a conformist period where most individuals are willing to “go along to get along” in a world that is generally deemed positive by most. Religious attendance increases and conformist symbols on money “in God we trust” and the pledge of allegiance are adopted in the context of the Cold War. There is no 4th religious “Great Awakening”, but Pentecostal and fundamentalist churches see rapid growth. The Roman Catholic Church works through the second Vatican Conference to reform, update, reorganize and modernize the church. Mainstream Protestant churches are at the peak of their membership and influence. Liberal Paul Tillich is the representative theologian, emphasizing “matters of ultimate concern” and “the courage to be”. “Rock and Roll” music grows as an expression of teenage independence, but the “British Invasion” is yet to come. Racial justice is growing as a major topic, south and north. National and regional politicians take small steps forward on race as liberal judges take controversial larger steps ahead.
Global Context
The Cold War is topic A, B and C. The threat of nuclear war is omnipresent with students learning to “duck and cover” and citizens and communities building “bomb shelters”. Oppenheimer and other scientists who wish to “limit” further development are sidelined by the military and national leaders. Eisenhower warns about the power of the military-industrialist complex as he retires. The United Nations fills some global functions and Europe begins its long journey of integration. The US builds NATO into a strong alliance and supports the recovery of Germany, Japan and Europe through the Marshall Plan. Imperial/colonial holdings are released around the world within the context of the Cold War. Military technology continues to advance. The US is shocked by Soviet rocket, nuclear and satellite advances and invests in programs to recapture the lead. Displaced people and immigrants are resettled. Limited food production, oil availability and unlimited population growth are highlighted as a new Malthusian challenge. The pain is mostly felt in the “less developed” world, but policy elites highlight the risks. The Peace Corps is founded.
Political Context
Truman rode FDR’s goodwill to victory in 1948. Eisenhower accepted the New Deal and governed in a low-key, centrist manner for two terms. Populism and McCarthyism (nationalism) were largely eliminated in the 1950’s, but the existential threat of “Red” communism in Russia, China and its allies remained as a major political debate. Modern conservativism began with the academic scribblings of Russel Kirk (1953), the voice of William Buckley (1955) and the political moxie of Barry Goldwater and Ronald Reagan. However, John Kennedy squeaked out a narrow win over Richard Nixon in 1960 and provided that time with an idealistic, progressive, academically supported New Frontier and Camelot.
Intellectual Context
Some academics were walking away from the party line Marxism of China and the USSR by 1960 as the shortcomings of the economic, political and social systems were becoming apparent. They were very focused on the French existentialism of Sartre and Camus. In the shadow of “mutually assured destruction”, this was not surprising. The structuralism and post-modernist philosophies emerged at this time but did not quickly impact American cultural life. Universities were growing rapidly in this period, fueled by the GI Bill and the coming Baby Boom freshmen.
Public intellectuals were still a significant part of national debates about politics, technology, the economy and culture. The mainstream media provided print, radio and TV stages for public debate.
https://www.smithsonianmag.com/history/what-happened-americas-public-intellectuals-180963668/
https://magazine.nd.edu/stories/where-have-all-the-thinkers-gone/
The “popular” intellectual debate was largely focused on the eclipse of the individual versus the power of the group, whether that group was society, advertisers, corporations, neighbors, property developers or government.
https://en.wikipedia.org/wiki/The_Power_Elite
https://en.wikipedia.org/wiki/The_Organization_Man
https://en.wikipedia.org/wiki/The_Man_in_the_Gray_Flannel_Suit
https://en.wikipedia.org/wiki/The_Lonely_Crowd
https://en.wikipedia.org/wiki/Vance_Packard
Book
https://en.wikipedia.org/wiki/The_Catcher_in_the_Rye
The continued growth of science and technology as practical applied science and theory was also a major concern at this time. The split between scientists and the humanities scholars was emphasized. The changing view of “science” as a firm, fixed, objective body of work conducted by objective scientists was also called into question.
https://en.wikipedia.org/wiki/The_Two_Cultures
https://www.theguardian.com/science/2012/aug/19/thomas-kuhn-structure-scientific-revolutions
Birth of New College
The local (Sarasota and Florida) and national founders of the college were shaped by the context of the period. In hindsight, it is clear that they worried about growing “individuals” who could resist the power of the various social and organizational forces that demanded compliance. This was not a left- or right-wing political initiative. These were business, government and university elites doing their best in a patriotic American way to shape a new institution in a growing city, state and country.
60 years later, it’s not clear that these founding principles were “leaning left”. The focus was on the individual, not on the community, society, nation, state, religion, history or culture. The founders: well-minded business, religious and academic elites, emphasized this dimension of education because they believed that a simple, patriotic, conventional, practical, productive, well-defined, professional, feasible, traditional model of education was simply inadequate. It’s 1960. Two dozen successful people got together to form a new college in a resort town. They did a quick SWOT analysis (strengths, weaknesses, opportunities and threats) of colleges and universities. They chose to innovate. Let’s “reach for the moon”. We want to attract the “best and the brightest”. (Ouch).
https://en.wikipedia.org/wiki/The_Best_and_the_Brightest
College freshmen today (1960) are unduly shaped by society’s expectations. Let’s “turn them loose”. Young people are much more mature today due to their exposure to the “mass media”. They are very well educated in many high schools. Faculty and administrators are also much more highly qualified to lead the education process. Let’s fully engage them in the learning process.
This was an idealistic birth process only possible in a positive period of confident national growth.
I don’t see any incompatibility between New College’s historical educational program and associated learning environment with Florida Governor DeSantis’s stated desire to improve the critical thinking skills of students, making them less influenced by “trendy” philosophies. I believe that New College already provides a solid base in those skills. The burden of proof is on new trustees or new programs of study to better deliver the desired results.
Trust in the DOJ and the FBI

Republican Trust in the DOJ Has Improved Significantly Since 2015
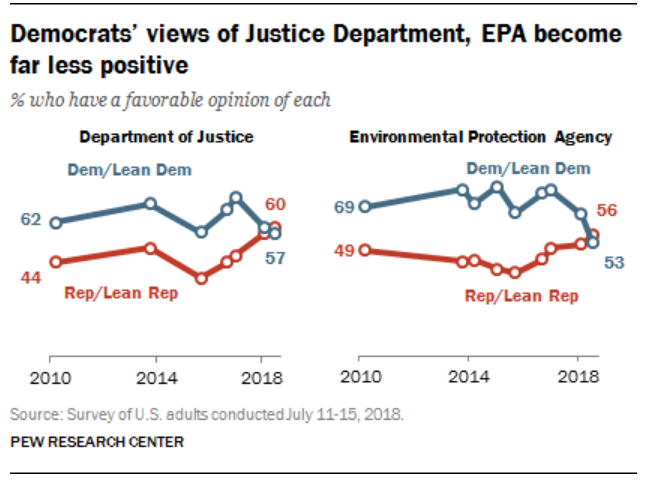
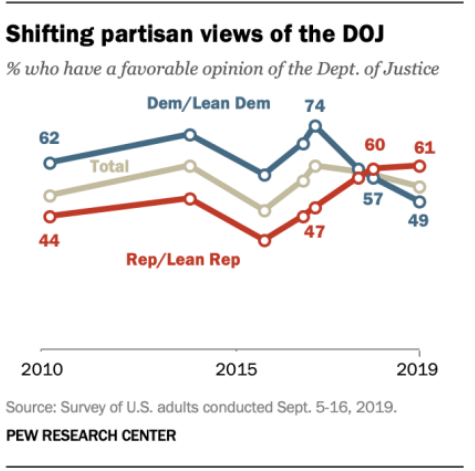


Trust in the Department of Justice (DOJ), overall, has been relatively flat. Republican support has increased while Democratic support has dropped.
Historically, Republicans Strongly Supported the FBI

Historically, Republicans have been conservative, supporting the police, military, FBI, defense, “law and order”, criminal justice and “black and white” law enforcement. While the DOJ and some other federal agencies have been staffed by left-leaning coastal elites, the FBI has been staffed by more conservative leaning individuals.
https://www.politico.com/story/2016/11/fbi-donald-trump-base-230755
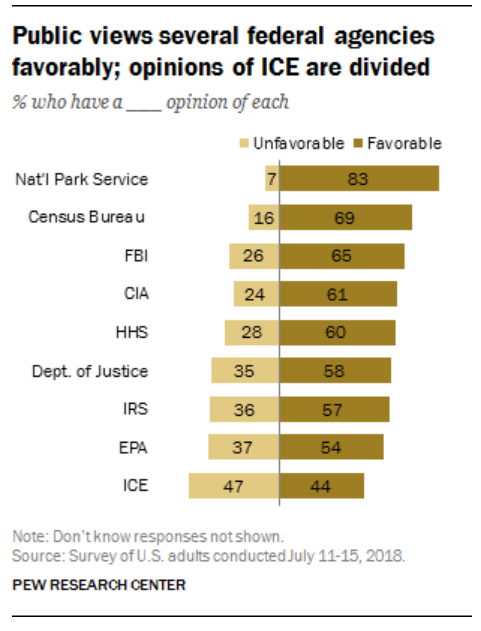
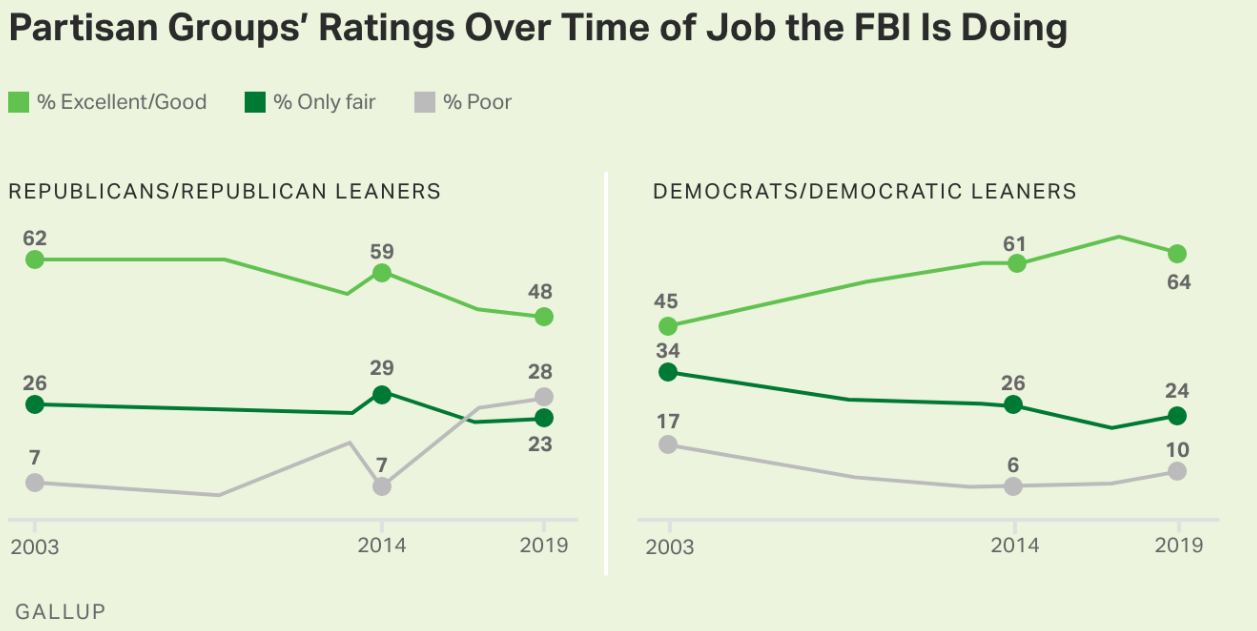
Overall Support for the FBI has Remained High, but has Become Polarized


Different survey questions produced different results, but the FBI is one of the most respected federal agencies.
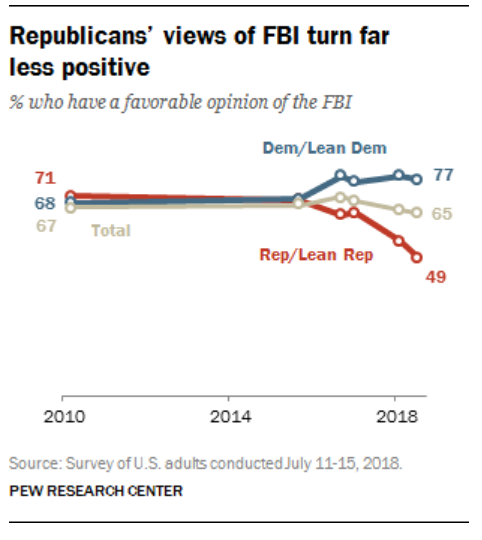
Trump’s 2018 Attacks on the FBI Drastically Reduced Republican Support for the FBI (see above and below)

The Republican versus Democratic split widened.
https://www.vox.com/latest-news/2018/2/3/16968372/trump-fbi-republican-poll-confidence

Republican’s Response to Trump’s Claims Were Severe


https://www.politico.com/story/2018/02/03/conservatives-fbi-trump-republicans-389076
Republicans Were Much Less Supportive of the FBI in 2019 versus the Democrats

Context: Americans’ Belief in or Trust of Institutions Has Been Declining for Decades
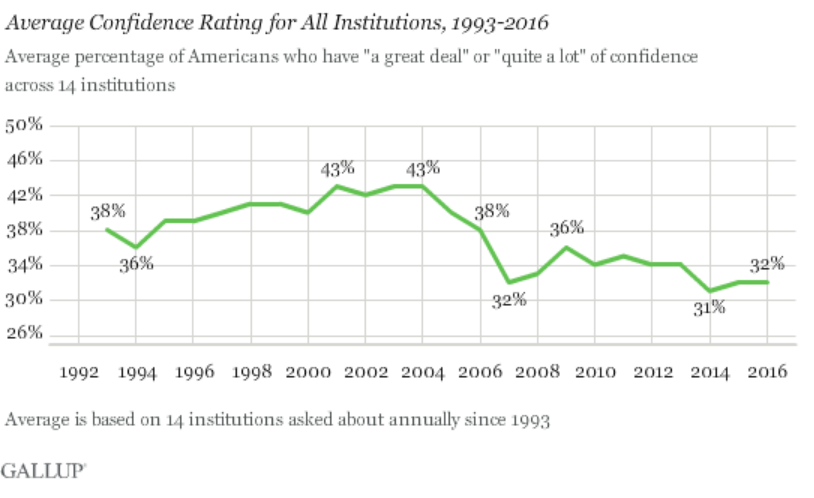

Huge 10% drop in the middle of George W Bush’s presidency. 5 institutions with 10% or greater drops in support.
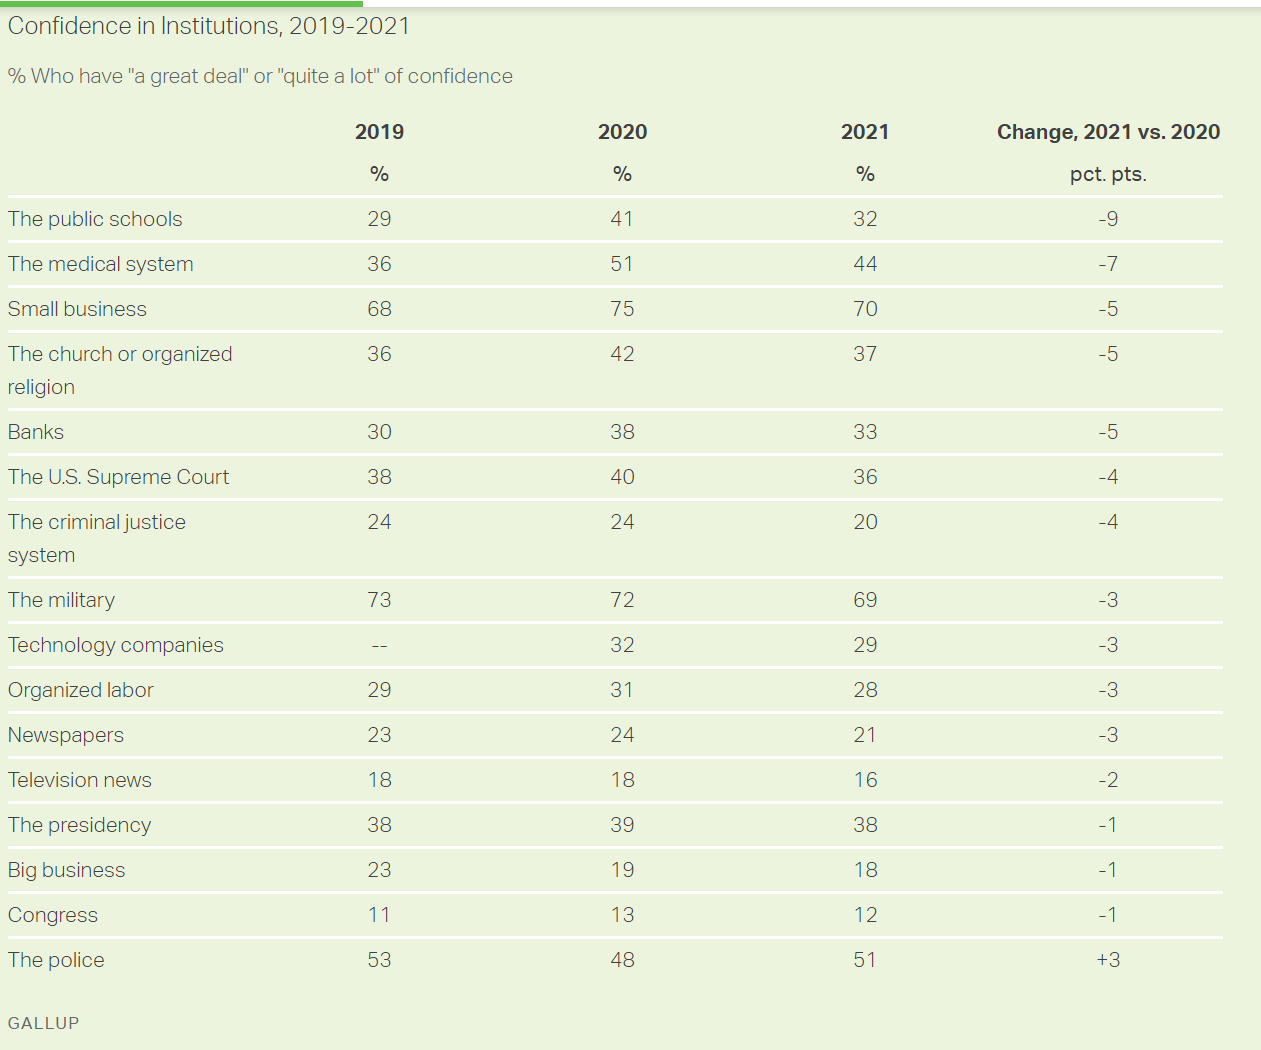
Widespread further decline in support of “institutions” during the pandemic.
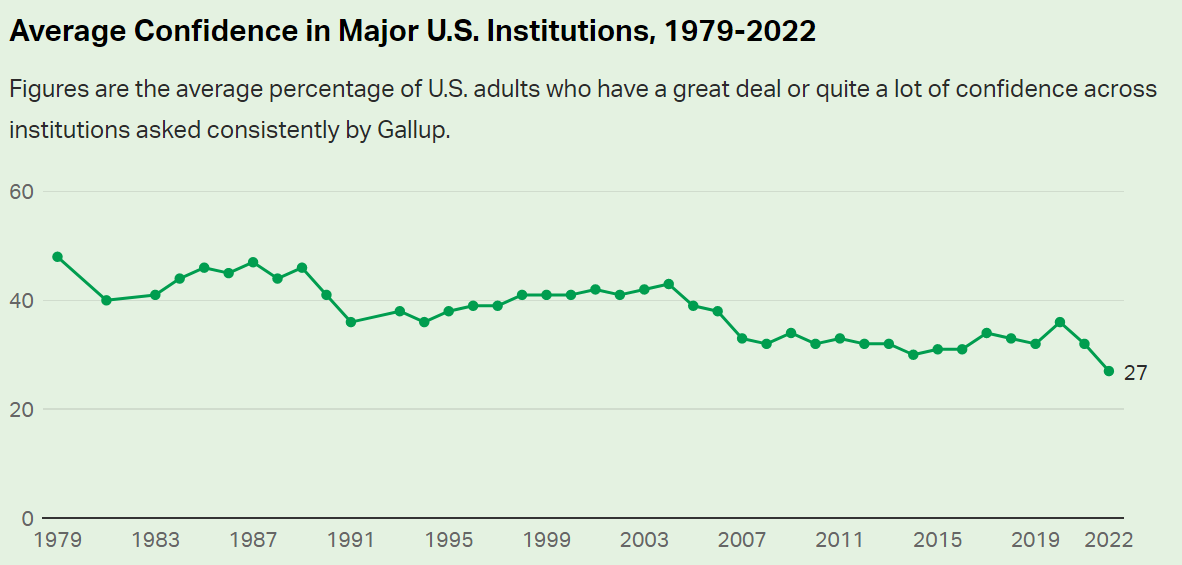
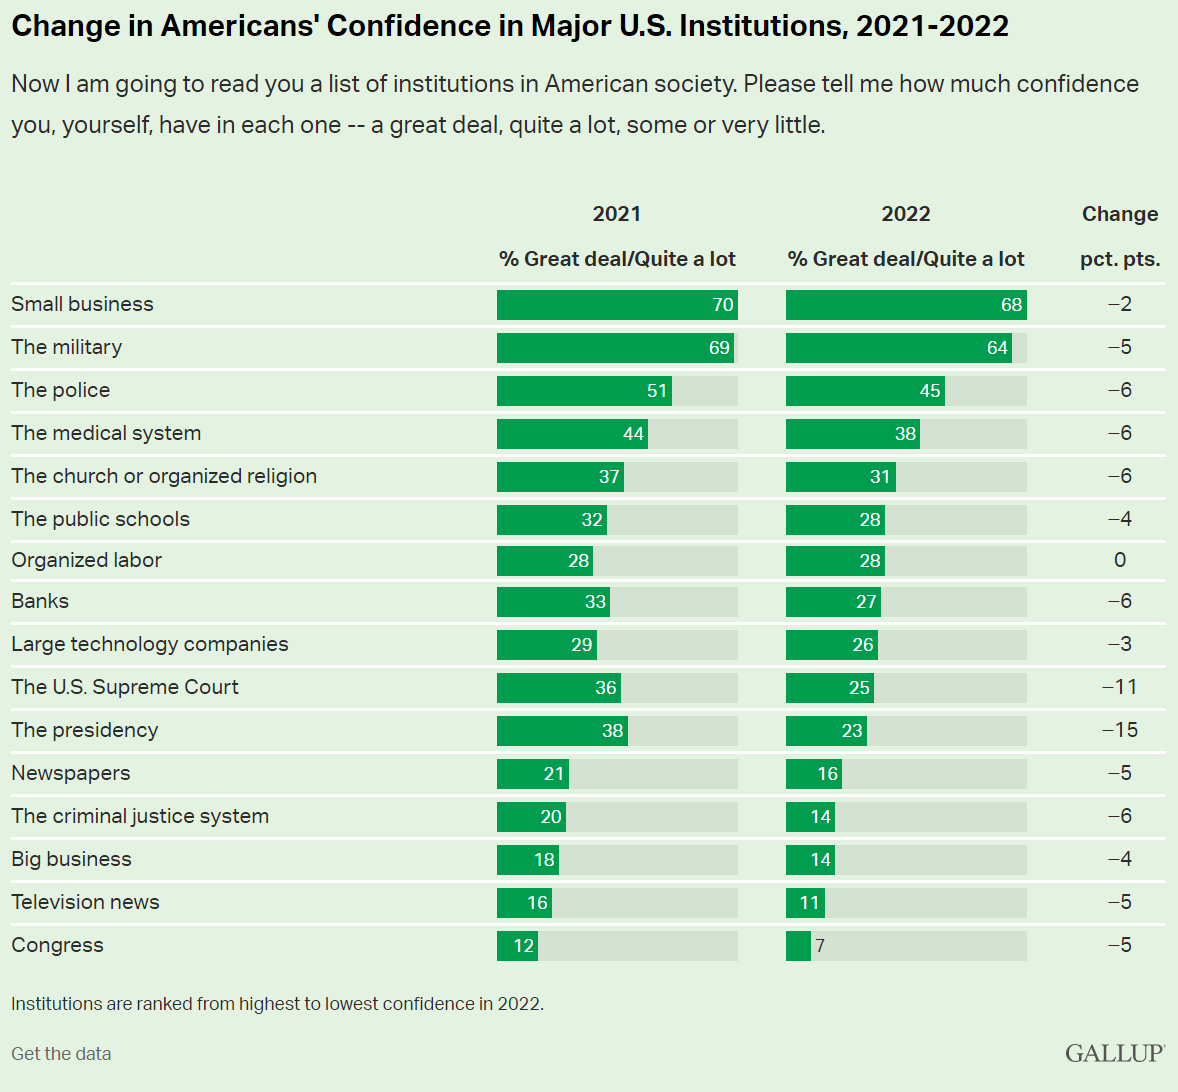
The broad decline continues in 2022. Can it continue?
I’m Very, Very, Very Scared
538 has a similar article but refuses to link directly. Worth your time to query and copy.
“What Happens When Americans Don’t Trust Institutions?”
If only one-quarter of Americans trust in its basic institutions, how can we have democracy and capitalism and “western civilization”? If “everything is broken”, then we need a dictator or a revolution. Really? Really? Really?
I have to blame the 16 year-old me for some of this. In 1972, we were all opposed to “the man”, “the organization man”, “the establishment”, etc. We were children of the hard-won victory of democracy and capitalism against fascism and imperialism and communism. We believed in progress, science, growth and possibilities. We were skeptical about the Vietnam war, the military, McNamara and his whiz kids, General Curtis LeMay, big corporations, compromises, limitations, bureaucracy, bigness (small is beautiful), population growth, technology, etc. Many of us deeply believed in a romantic idealism or utopianism, making stodgy historical institutions so irrelevant.
Fast forward 50 years and I (we) possess a fundamentally conservative view, embracing the need/value of institutions and channeling our inner Edmund Burke to emphasize the value of the accumulated wisdom of society.
https://en.wikipedia.org/wiki/Edmund_Burke
So, the overall decline in trust of American institutions is a real challenge. The decline in trust in the FBI is clearly (IMHO) a Trump driven result. This, too, is a real challenge to our democracy. Do we (I) really believe that the leadership and staff of the FBI have abandoned their democratic principles which we have lived and supported for almost 250 years? I don’t think so. But the decline in trust/belief in all institutions combined with the increasingly politically polarized view of individual institutions makes this a reasonable view for many of our fellow citizens. We have much, much work to do in order to preserve our institutions, government and society.
Good News: US Workers Are Much More Engaged at Work

https://www.gallup.com/workplace/352949/employee-engagement-holds-steady-first-half-2021.aspx
In the last 20 years, 40% more employees are “engaged” at their workplace and one-sixth less are “disengaged”. American employers have bought into claims by Gallup and others that “engaged workers are productive workers” and made the investment in building culture, training managers, measuring managers and work teams and attending to basic employee satisfaction dimensions. Firms have made these changes out of self-interest, believing that the investment in helping employees to be engaged will pay off.
While 26% or 36% “engaged” may seem like poor numbers, consider that the global average in Gallup surveys is just 20%. Gallup defined “engaged” at a high enough level in their survey to ensure that corporations would see the low numbers and turn to Gallup and other organizational development consultants for help.
Note that even with 36% engaged, that means that 64% are un-engaged or actively dis-engaged. Hence, the “Great Resignation” is not unexpected in a tight labor market.
How Did They Do It? (Firms Improve Workplaces)
Gallup points to 4 factors.
https://www.gallup.com/workplace/284180/factors-driving-record-high-employee-engagement.aspx
More companies now take culture and management seriously, from CEO to front-line workers, making real, sustained changes as they did with total quality, lean six sigma operations and branding. Firms define mission, vision and values and operationalize these “soft” dimensions in performance reviews, promotion and retention.
Second, firms focus their organizational development efforts on front line managers, the people who impact the most employees. Good front-line managers are then prepared to be good middle managers, so this makes sense. Companies embrace organizational behavior research which says that managers must consider both task and people dimensions. Managers must be the responsible parties, adjusting their style and decisions to the situation. Gallup published a book that helps to train managers in applied situational leadership.
Other consulting firms and authors provide training materials and seminars to help managers be more effective.
Third, firms take communications seriously, overcommunicating, teaching communications, reviewing communications, etc.
Fourth, firms hold managers accountable for results. These measured results include employee satisfaction. Firms have learned to use 360-degree feedback systems to identify very weak managers, help average managers to develop and promote the most effective managers to greater responsibility and impact.
Most firms employ some version of “The Balanced Scorecard”, ensuring that managers are evaluated on, and therefor focus upon all four dimensions: earnings/mission, customer satisfaction/sales, operations effectiveness, asset management (including human resources).
Higher Paid Employees are More Satisfied
How Does Gallup Measure Engagement?
Gallup statisticians crunched numbers from prior work to identify a small number of questions that are correlated to results such as turnover, productivity, sales, profits, etc. The Q12 survey is disarmingly simple. It can be administered monthly for all work teams and employees. Once managers are trained to understand the meaning of the results, opportunities for improvement are straightforward. Once employees see that managers are responding to their feedback, a positive feedback loop can be started. Q12 is not a “magic bullet”, but the questions touch on dimensions that employees truly value and improvements in management performance are noticed by employees.
https://www.gallup.com/workplace/356063/gallup-q12-employee-engagement-survey.aspx
PostScript: Engagement Fell Back a Bit in Late 2021
https://www.gallup.com/workplace/388481/employee-engagement-drops-first-year-decade.aspx
We Are All Specialists Now
Apologies to Richard Nixon for paraphrasing his famous Keynesian quote.
Two years after starting a mid-career search, I remain impressed by the greatly increased emphasis on perfectly matching an individual’s professional and industrial experience to an open position. Hiring managers, recruiters and HR managers have all adopted this approach. This is partly because of the abundance of candidates and partly due to the risk averse environment caused by the slow economic recovery. It is also due to the improved results of the “fill the bucket” approach to hiring where specific requirements are listed and then proven from actual experience and multiple interview responses.
However, I think there is something deeper involved. Professional and industry specialization has continued to increase through time. The discussion of outsourcing, virtual project teams and individual agents has died down, but these innovations have become a growing reality. Successful firms increasingly focus on smaller niches of product, geography and comparative advantage. Increased industrial and professional fragmentation is required for success. The trend will continue.
How did I miss this? As usual, paradigms act as blinders. In high school in the 1970’s I was taught it was important to be “well rounded”. At a liberal arts college, I learned that great minds and thoughts were academic, abstract and universal. In business school, I learned that an MBA provided the necessary skills for a lifetime of career success. I later discovered the competitive advantages of being a “general manager” from John Kotter’s influential work.
My teachers were correct in promoting the personal and professional value in developing broad knowledge, thinking skills and a professional base. They did not foresee the modern world of global competition, where firms are forced to specialize and make economically rational decisions far beyond those envisioned by Adam Smith and David Ricardo who outlined these principles long ago.
“General Managers” are now merely a declining specialization. Some top-end MBAs with broad consulting experience can move from industry to industry and be successful. A few individuals can specialize as “strategic advisors” to presidents. But even in these fields, the trend is toward specialization. Firms will pay for experts in a narrow tax, legal, technical or IT field only when in-house experts do not exist or others cannot complete a project well enough.
Professional services firms have always paid lip-service to industry focus. In the last two decades, led by IT firms, they now specialized by industry and technology equally. Clients expect staff to understand their business.
Industrial and professional specialization will be required for future employment. Individuals, firms and universities will adapt to survive.
Professional Branding
Anyone who has searched for work in the last decade has learned about the importance of the 15 second elevator speech and fine-tuning their personal brand.
Many have rejected this sales and sound-bite oriented approach to career progress as being undignified, unprofessional and personally demeaning. Most have learned that this approach is required for even a scrap of success.
Modern recruiters and counselors advise that “it’s not about you”. It’s about what a hiring manager or screener are seeking. A generalist brand, multiple professions, multiple industries or a complex story are deal-breakers. Hiring agents are seeking an exact match. A Swiss Army knife has no perceived value.
Job seekers are well-advised to network broadly, but to focus on opportunities with a clear match of experience to requirements. Hiring managers want to be sure that professional skills and experience are solid. Degrees, majors, certification and prior job titles provide 90% of the evidence. It is a rare recruiter or hiring manager who will really dig deeply into technical skills. Interviewers also know if they are seeking a specialist or generalist within a profession. Candidates should tailor their resume, cover letter and answers to one or the other. A state and local tax specialist is hired for very different reasons than a division controller.
Most businesses strongly prefer candidates to demonstrate mastery of a single profession, even for entry-level positions. General management majors are handicapped in the job search.
In addition to being technically proficient, most firms want applicants to be dedicated to and knowledgeable about their industry. There are many reasons. Learning industry jargon, technology and the basis of competition takes time. Industry veterans truly believe that their industry is different and special. Sharp managers understand that turnover is lower for industry specialists. Most industries have a well-established culture and a leading function (merchants, scientists, deal-makers, architects). Like most clubs, they prefer to hire familiar faces.
A wide range of professional, industry and project experience is of great value within a firm. Unless an individual is able to sell very specialized technical skills or are seeking work through a consulting firm, they must stay focused on a simple story line when searching for a new firm. “Cost accountant – heavy manufacturing” sells well. “Management accountant with project success in various industries” sends vague signals.
A specialized industry and professional brand is required today.
World-Class Operations Summarized
The classic and current classroom texts on operations excellence tend to become too technical, specialized or applied. Quality, process, lean, six sigma, supply chain management and other buzz words compete for supremacy. Modern operations management can be distilled into eight simple insights.
The results of activities vary in ways that can be described and predicted by statistics and probability distributions. Variability is inherent in human and natural activities. Reducing variability is as important as improving efficiency or effectiveness. Fail-safe solutions are especially valuable. Confusing inherent variability with true exceptions/trends is common, but leads to wasted efforts.
Processes are everywhere. Inputs are processed into outputs. Improving the links in a process may be more important than optimizing component steps. Processes cut across natural functions and require different management. The broad outlines of product development, sales and operations are similar across diverse organizations, allowing rapid definition and optimization.
Most importantly, self-improving systems can be constructed by defining simple goals, measures and feedback loops. The cumulative effect of incremental plus breakthrough improvements from project teams and front line participants is enormous, often dwarfing the improvements from the far greater investments of organizations in day-to-day pursuit of urgent but unimportant tasks. Self-improving systems clarify the different opportunities presented by re-engineering, kaizen and continuous process improvement efforts.
The quality paradigm, focused on perfection and eliminating waste, is a complement to the finance paradigm which focuses on short-term trade-offs and diminishing returns. The true total direct plus indirect cost of quality together with the sales and margin benefits of higher quality usually justify greater investment in quality, even within a strict financial decision-making paradigm. But the pursuit of extraordinary quality levels (six sigma) and the elimination of waste in all forms have revolutionized the way world-class operations teams approach their work and create new value. The belief in the possibility of zero defects has led to a simple approach of repeatedly eliminating half of the remaining defects, improving all measures of customer value.
The notion that all value is derived from customers has ordered a complex world. The balanced scorecard aligns resources to operations to customer perceptions to financial value in a logical fashion. Processes can be directly evaluated to determine value added versus non-value added steps from a customer perspective. The customer centric view has helped to align sales, operations and product functions. It has led to a set of universal customer demands for quality, speed, flexibility, value, relationships and related costs.
The logical connection of sequences of variable events resulted in the overthrow of deeply held beliefs in planning, scheduling, optimal capacity, inventory buffers and production. The pull approach promotes extra capacity, reaction, controlled production, zero inventory, single unit batches, flexibility and integrated suppliers. It rejects many of the push worldview’s attempt to deterministically control a probabilistic set of process steps. The implementation of lean manufacturing has demonstrated new ways to make processes more effective in a world of variable final demand.
People matter. In the long-run, they are best positioned to operate self-improving systems for maximum total value. Managers who can set clear goals and engage staff succeed. They empower staff and hold them accountable for long-run progress while maintaining controlled systems. They encourage the use of visual feedback systems, fail-safe steps and simple measures to gauge progress. Managers provide resources, eliminate roadblocks and teach the principles of modern operations.
Finally, modern operations is only sustainable as part of an integrated planning, analysis and control system. A stand alone quality system will fail. When quality and operations goals, measures, plans, projects and reports are incorporated into the overall management system, they are self-sustaining.
There is synergy across the pillars of modern operations. Understanding variability, defining processes, building self-improving systems, using ideal long-term goals of zero waste, pursuing customer value, using pull production designs, empowering people and operating a single management system are mutually reinforcing components of world-class operations.
Managing the Tail in Operations and Product Development
Marketers and investors have recently discovered the importance of “the tail” in distributions of opportunities, results and risks. Virtual organizations, micro-marketing and web-based access to tiny clusters of customers has allowed start-up firms to profitably sell products to in truly niche markets. Nassim Taleb’s book titled “The Black Swan” alerted investors to the rare events with large impacts which are not well-managed by modern portfolio theory and its attendant financial instruments. Wise investors now consider the impact of once in a generation or once every century type events.
As processes, product differentiation and product complexity grew following the mass market global recovery of the 1950’s and 1960’s, operations manager and engineers have increasingly faced greater challenges and opportunities “managing the tail”. Early information technology forced companies to document and standardize their core business processes. This automation helped companies to see their self-imposed administrative limits and explore computer assisted processes to handle all possibilities. Product differentiation was pursued for every customer group and product dimension, creating sales, production, quality and support issues. As customers received more options, higher quality, lower prices and shorter lead-times, they were NOT satisfied, but asked for MORE.
Managers and engineers found that working in the tail became increasingly more difficult, costly and sometimes just plain impossible. The number of combined options in production, assembly, catalogs, project steps, flowcharts and diagnostic guides approached infinity due to the potential combinations and permutations. The challenge of identifying and resolving opportunities increased as remaining failure rates in quality, repairs, out of stock position or on-time shipping fell from 1 in 50 to 1 in 100 to 1 in 500 to 1 in 1,000 to 1 in 5,000 towards the gloriously named six sigma level (2%, 1%, 0.2%, 0.1%, 0.05% …).
In general, an army of scientifically oriented quality, business, marketing, financial, IT and engineering analysts have addressed these opportunities as complexity has risen and customer demands have increased. Along the way, the quality paradigm was defined, setting zero defects, variability, travel, inventory, waiting and waste as eternal goals. The financial paradigm’s focus on limiting costly investments to obtain small benefits acted as a resistor throughout this period.
As organizations have moved deep into the tail for their IT and product development, operations and reverse logistics processes, conflict has become more common. Analysts and process owners understand the trend and know that eventually any error, combination or possibility will be required by an internal or external customer. They hate disorder and doing things twice. They enjoy describing processes, diagnosing problems, designing and implementing complex processes, at whatever cost. Their product development, IT and operations managers and directors, backed up by finance, tend to focus on the short-run, employ cost-benefit analysis and value compliance with project deadlines and budgets as higher goals. The conflicts can be gentle comments, indirect negotiations or all out wars.
All of the players agree that demands for systems to handle more complex options with near perfect results will continue to grow. They differ in how they value the short-run and the long-run. While the financial paradigm develops a payback period or ROI based upon “solid” financial estimates for 5-10 years, the quality paradigm employs an infinite time horizon where infinitesimal improvements have subjectively valued importance as customer satisfaction, market share or risk management benefits. As quality guru Dr. Deming said, the most important benefits are “unknown and unknowable”. Hence, the two approaches are fundamentally incompatible.
Managers should take a number of general and specific steps to manage these situations, especially since they involve highly skilled, compensated and critical resources. First, help the participants to understand the financial and quality paradigms. Help them to see that the finance paradigm has great short-term applicability and is no going to be subsumed by the quality paradigm. Teach staff members to deeply understand the quality paradigm, the transformation it has facilitated in global business and its contribution to long-run success in a consumer driven world.
Second, encourage functional and project team members to alternately apply both paradigms to specific situations. Either can help to trigger break-through solutions or to find an obvious next improvement level.
Third, reinforce with staff members the need to have functional hierarchical structures, process improvement resource plans and project management as tools to manage the improvement effort. Front line staff and analysts may have the best ideas, but they need to be administratively coordinated by managers. Even in the most dynamic, entrepreneurial environment, there is some need for structure. Managers and staff can debate the right overall level or need for exceptions, but they need to appreciate the need for limits and ultimate decision-makers when conflicts can not be resolved.
Fourth, help staff to see the long-run commitment to improvements. Cutting errors in half today, rather than pursuing a 90% reduction, is not a failure, it is a win. The organization will be back to this process in 3 or 5 or 7 years, with new tools and customer demands, again analyzing 50%, 90% and 99% improvement paths. Decisions to accept “good enough” are part of the long-run improvement process.
Fifth, employ the best practices of product development, diagnosis, problem solving and project management to reduce variability and meet goals in cost-effective ways. With 50 years of experience, professionals have found great approaches that can be broadly applied.
Managing the tail of operations processes is an increasingly important role for managers and analysts. Greater variety and consumer demand makes it ever more challenging to resolve issues or to know when to stop pursuing them. Teaching staff to understand the complementary roles of the financial and quality paradigms and providing them with best practices tools helps them to produce cost-effective results.
