11 Million Open Jobs! 2 Jobs for Every Applicant

Available Positions

Industry2007 Pos2019 Pos2022 PosAdds
Govt12.212.511.8-.4
Other5.45.95.6.2
Construct7.77.57.6-.1
Manufacturing14.212.812.7-1.5
Mining.7.7.6-.1
Logistics5.06.16.91.9
Education3.03.83.7.7
Health15.320.320.45.1
Leisure13.316.515.11.8
State/Local Educn10.210.410.20
Finance8.48.78.9.5
Information3.02.82.9-.1
Profl Svcs17.820.921.84.0
Retail15.715.615.8.1
Wholesale5.95.85.8-.1
Total137.8150.3149.812.0
https://www.bls.gov/jlt/

Industry2007 Open2019 Open2022 OpenMore Open
Government.3.5.7.4
Other.2.2.4.3
Construction.2.3.4.2
Manufacturing.3.5.9.5
Mining0000
Logistics.1.3.5.4
Education.1.1.2.1
Health.71.21.91.2
Leisure.61.01.61.0
State/Local Ed.1.2.3.2
Finance.3.4.5.2
IT.1.1.2.1
Profl Svcs.91.32.01.2
Retail.5.91.10,6
Wholesale.2.2.3.1
Total3.67.111.26.6
https://www.bls.gov/jlt/

Open Positions as a Percent of Jobs Available

Industry2007 Rate2019 Rate2022 Rate
Government2.43.65.4
Other3.14.07.3
Construction2.23.84.8
Manufacturing2.33.46.4
Mining2.13.85.6
Logistics2.74.87.4
Education Svcs2.42.94.9
Health4.35.48.6
Leisure4.35.79.8
State/Local Ed1.32.03.2
Finance3.54.25.4
IT4.64.76.7
Profl Svcs4.85.78.6
Retail3.05.26.4
Wholesale2.93.55.0
Total3.34.57.0
https://www.bls.gov/jlt/

Open Positions by Industry, 2021-22

The Department of Labor’s monthly survey provides various measures by industry. I’ve broken down the data into 15 industry segments. Eight (8) of these segments account for 5/6ths of all positions and I’ll focus on these 8.

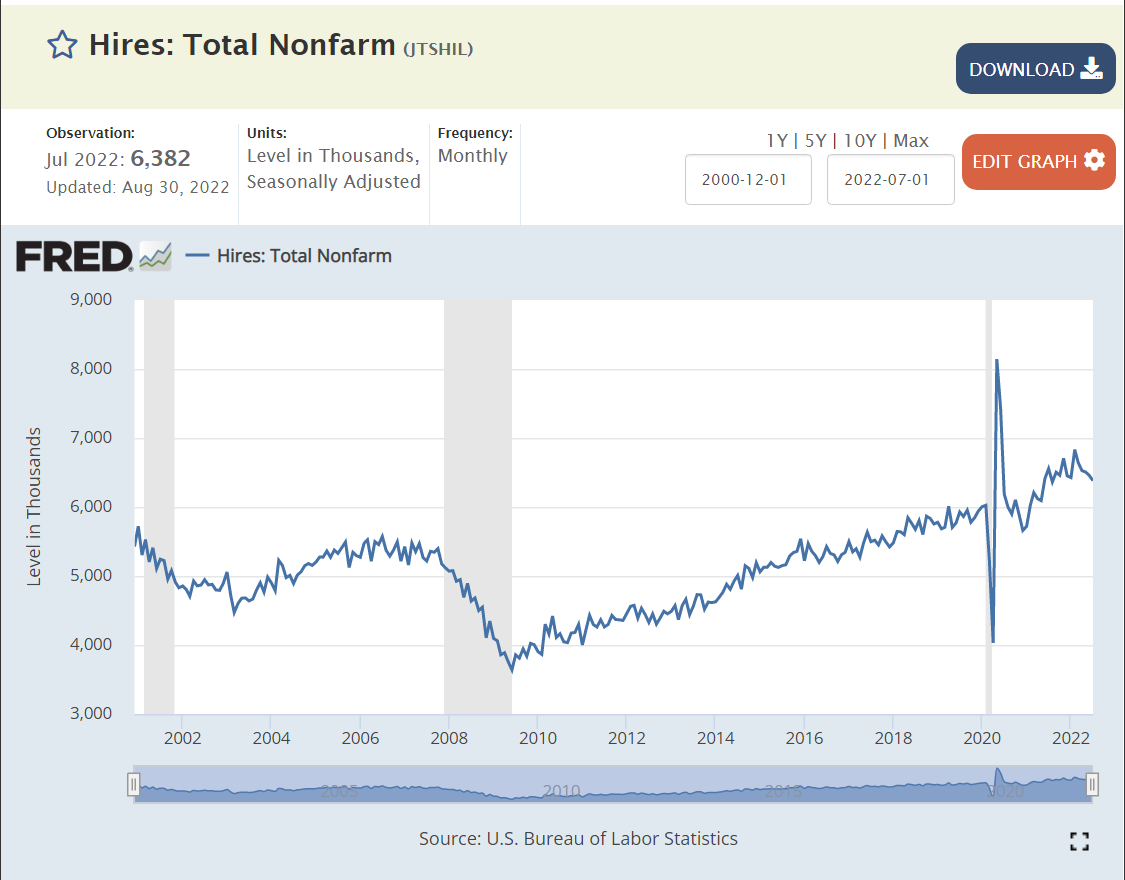
The number of open jobs in the last year, July, 2021 – July 2022, is lead by Professional Services (2.0), Health (1.9), Leisure (1.6), Retail (1.1), Manufacturing (0.9), Government (0.7), Logistics (0.5) and Finance (0.5).

Seven industries accounted for 5/6ths of the increase from 4.6M openings in 2006-7 to 11.2M open jobs today. Health (1.2), Profl Svcs (1.2), Leisure (1.0), Retail (0.6), Manufacturing (0.5), Government (0.4) and Logistics (0.4) are the open job gainers.

The pre-pandemic increase averaged 40% of the total 15-year increase for most industries. The Manufacturing industry showed job declines between 2006 and before the Pandemic, so 80% of it’s openings increase has been since the pre-Pandemic peak. The Business and Professional Services industry has also grown faster since the Pandemic, with 68% of its job growth in recent years. The Retail industry shows an opposite pattern, with 60% of it’s job growth before the Pandemic and a relatively weaker 40% post-Pandemic (on-line sales growth impact).

Total Positions Available by Industry

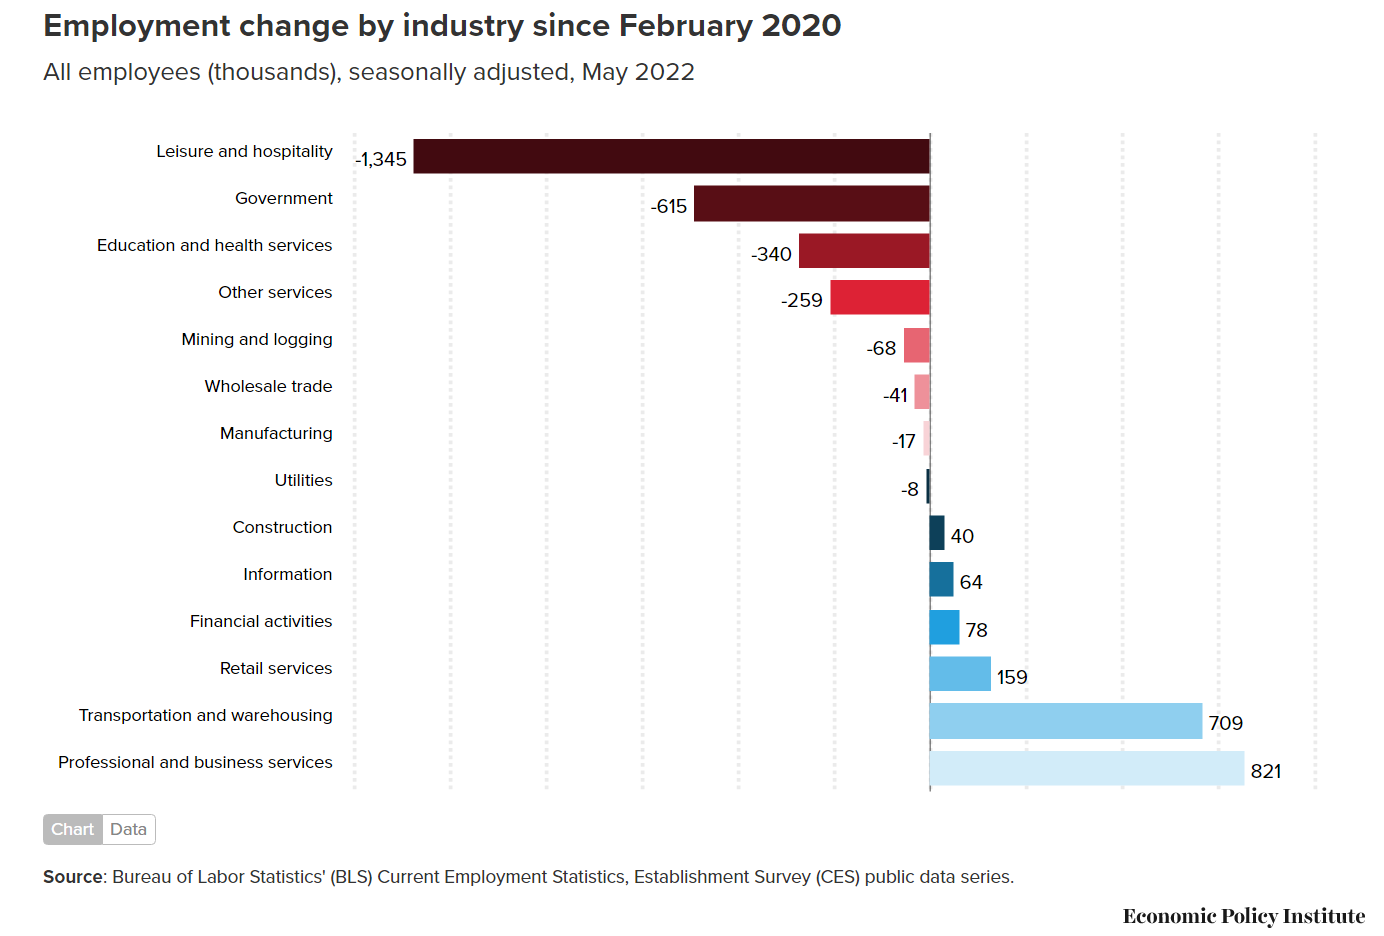
Total positions increased by 12M, from 138M in 2006-7 to 150M in the last year. Just 4 industries account for all of the growth, lead by Health (5.1), Profl Svcs (4.0), Logistics (1.9) and Leisure/Hospitality (1.8). The migration from ag/extraction to manufacturing to pure services is accelerating.

Open Positions Rate by Industry

The open positions rate more than doubled, from 3.3% in 2006-7 to 4.5% in 2018-19 to 7.0% in the last year. Unfortunately, the larger and growing industry sectors have above average open position rates. Leisure and hospitality shows an incredible/unsustainable 9.8% job openings rate. Professional and business services and Health Care report nearly as high 8.6% vacancy rates. The Logistics industry has a higher than usual rate of 7.4% as it adds jobs at a faster rate in the home delivery era. The Retail and Manufacturing industries show elevated 6.4% open jobs rates. The Government and Finance industries exhibit 5.4% openings rates.

Changes in the Job Openings Rate

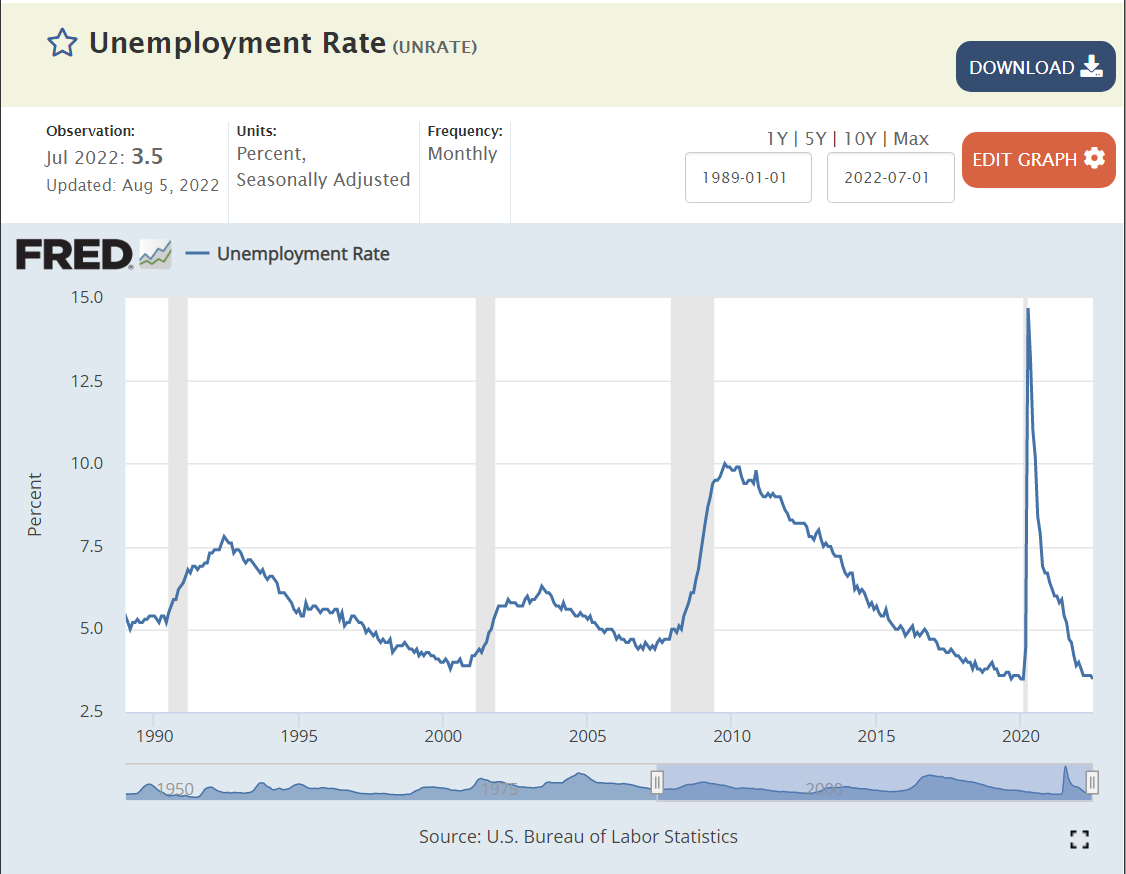
The overall job openings rate more than doubled from 2006-7 to the last year, from 3.3% to 7.0%. Keep in mind that 2006-7 was the peak of that business cycle with job openings at a cyclical low point. The Leisure and Hospitality industry had the largest increase, from its usually relatively high 4.3% to an “other worldly” 9.8%. The pandemic drove down travel and it has slowly recovered. The Logistics industry displayed the second highest increase, from 2.7% (it’s usual Manufacturing-like rate) to 7.4% as the Pandemic drove individual shipments to consumers. The Health Care industry continued its labor intensive growth, doubling from 4.3% to 8.6% of open positions. The Manufacturing industry evolved from its usual low 2.3% all the way up to 6.4% as labor demand in other industries grew and attracted its workers. The Professional and Business Services industry kept growing, resulting in a 3.8% increase in unfilled roles, from a typically high 4.8% to a very high 8.6%. The Retail and Government sectors had lower increases at 3%. The Finance sector had a lower than average 2% increase in open jobs.

Just a “Mix” Variance?

The US economy is very dynamic. Industries with low, medium and high job openings rates in 2006-7 each employed about 45M people. The low job openings rate industries (Govt, Manufacturing, Mining, and Educn Svcs) actually LOST 1.4M positions between 2007 and 2022. The middle rate of job openings industries (Logistics, finance, trade, other) added 2.6% net new jobs (1.7M). The high job openings rate industries (Health, Leisure, IT and Profl/Bus Svcs) added an incredible 10.8M jobs (22%)! The US has moved from agriculture to extractive to manufacturing to services employment. The personal and professional services industries are both the fastest growing and the most difficult to staff today.

What Happens During a Mild Recession?

Business and Professional Services openings drop by 3% of the total or 600K people. Health industry jobs decline by a smaller 1% as they are less sensitive to the business cycle, falling by 100K. Leisure and Hospitality are very understaffed and this is harming their growth. They might trim their employment by 2% or 300K positions. The Retail industry is in a long-run decline, so a 2% decline is likely, eliminating 300K jobs. Manufacturing is more cyclical than other industries, so its labor demand will fall more sharply, 3%, removing 400K job postings. The Government sector is somewhat buffered from recession pressures, so job openings might fall just 1% or 100K. Logistics firms are struggling to deliver, so a 2% job decline is the most I see, cutting another 100K positions. The Finance sector has been less volatile, so I estimate a 1% decline and 100K dip.. The remaining industries are likely to fall in tandem, requiring an additional 400K open jobs decline to meet budgets. This total 2.4M open position trim reduces the balance to 8.8M, far above the 7.1M pre-Pandemic level in 2018-19. I don’t think that the labor market will play its usual role in transmitting/amplifying negative finance, banking, housing, international trade, energy and other disruptions through the American economy.

Summary

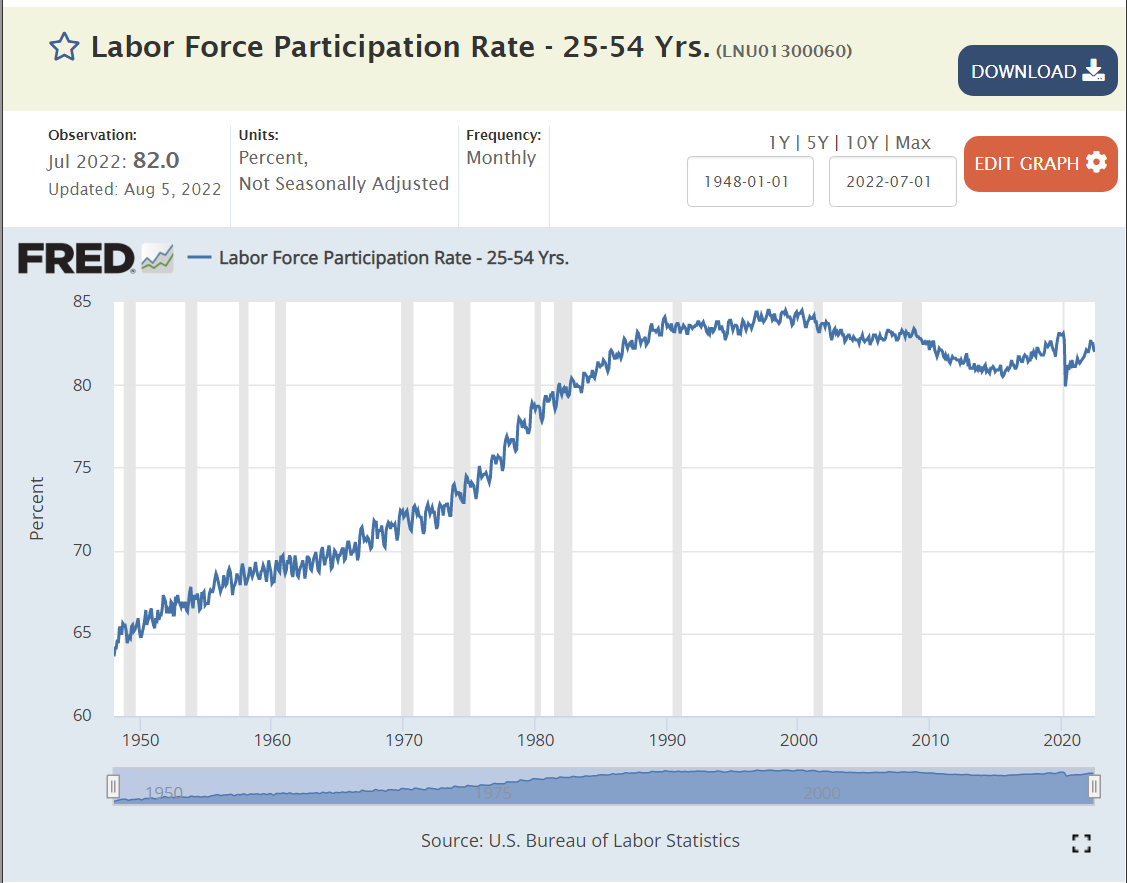
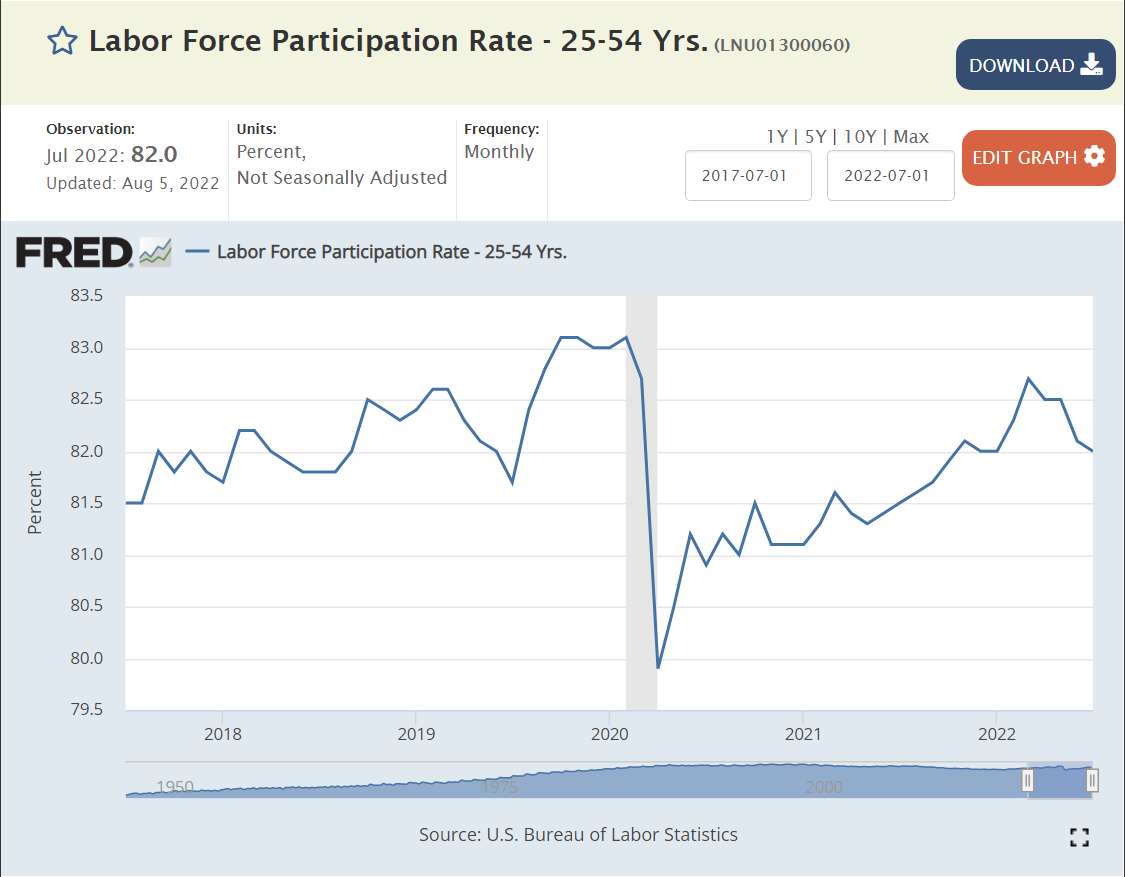
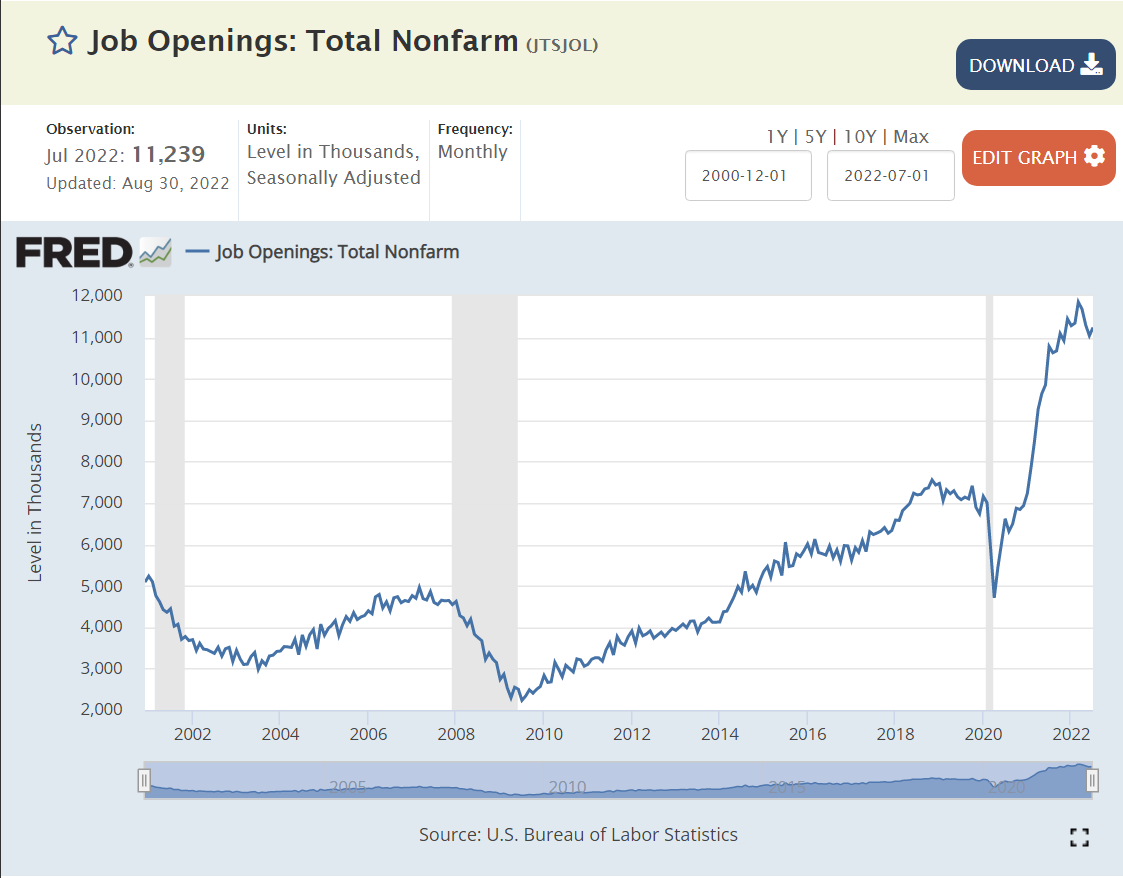
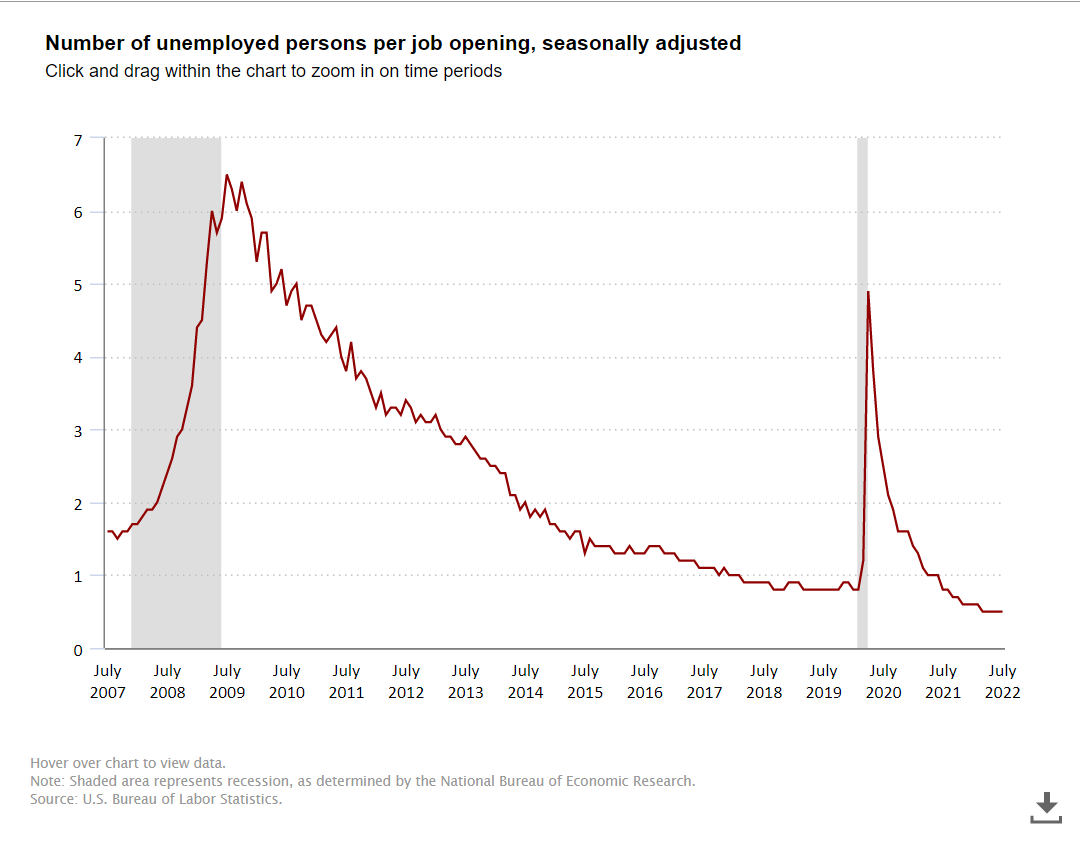
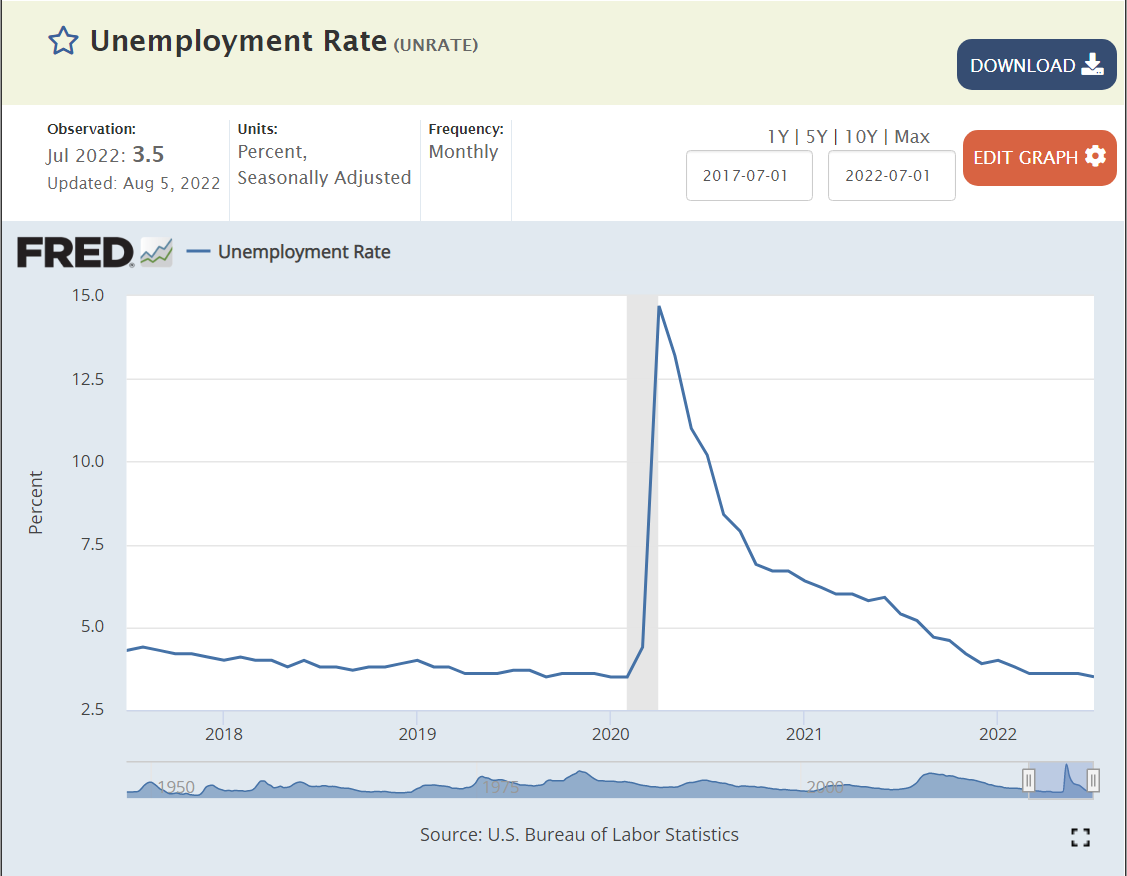
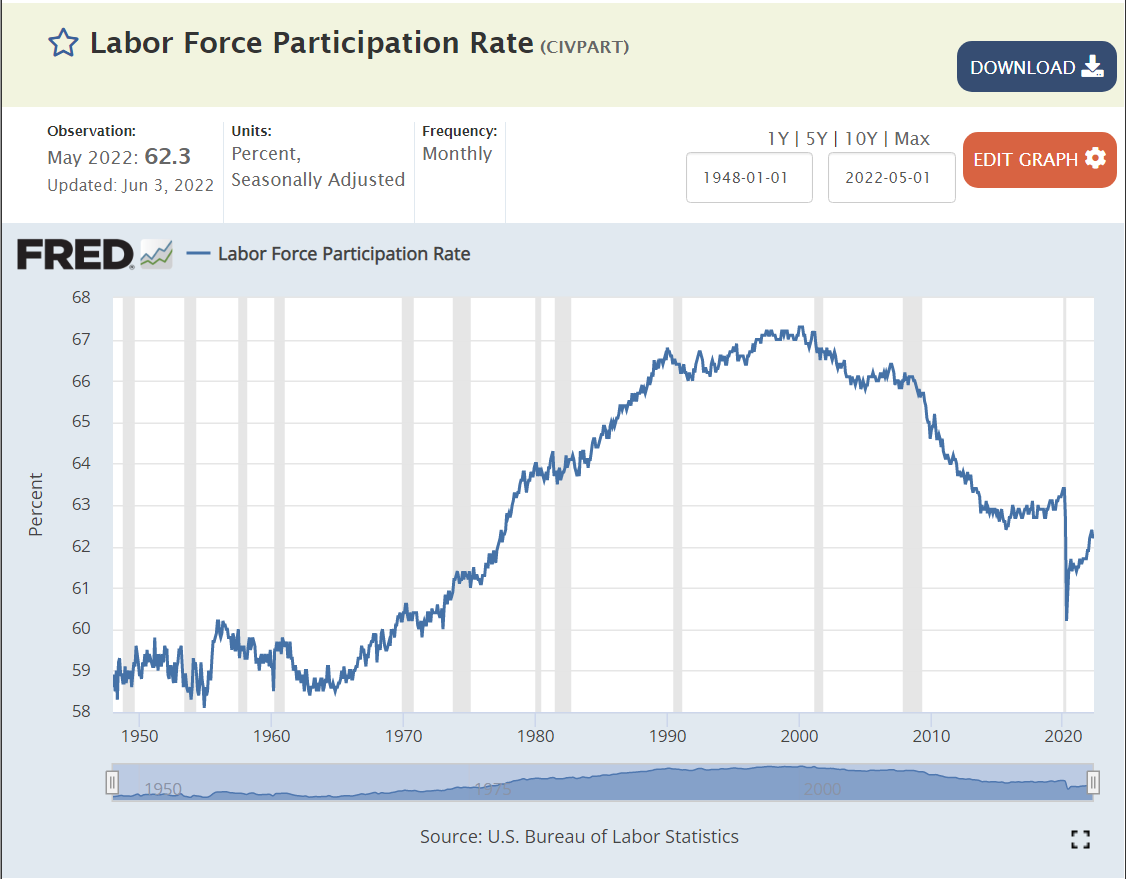
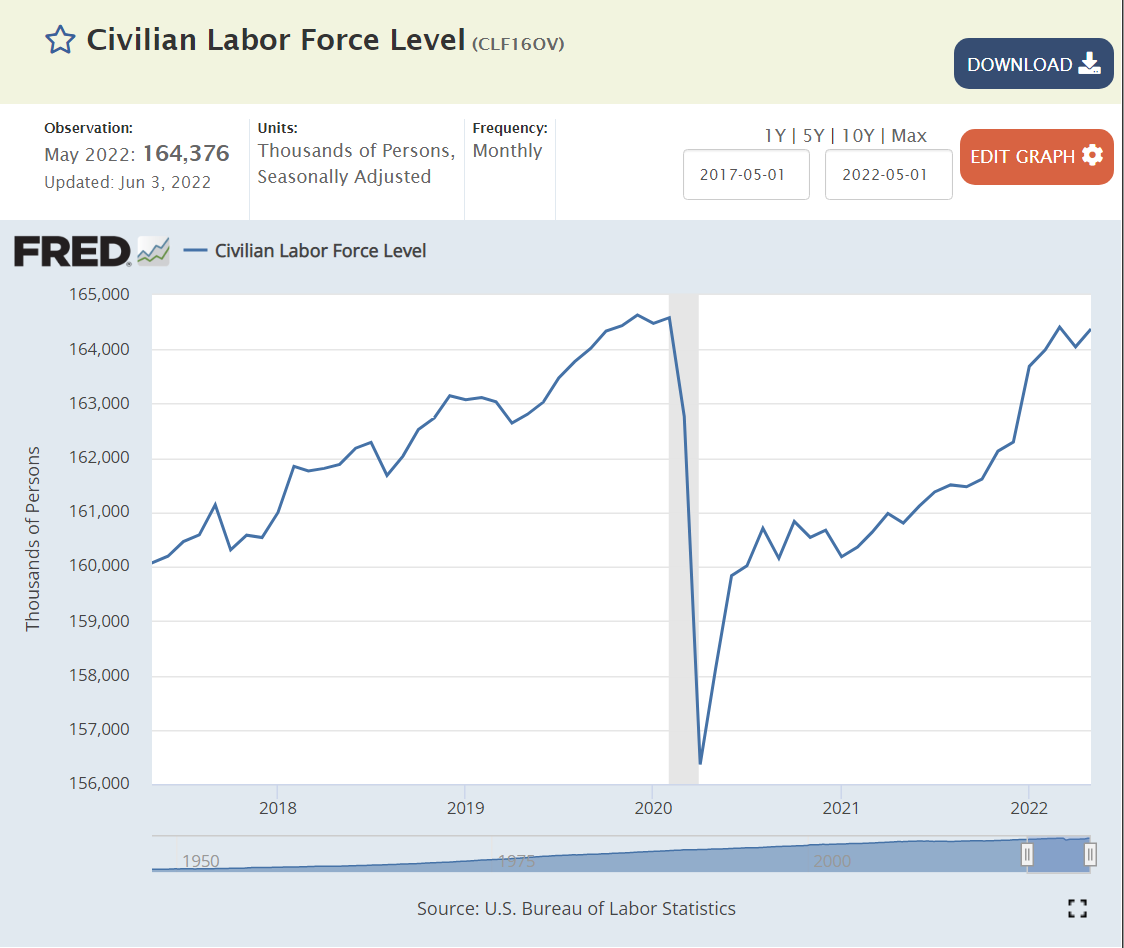
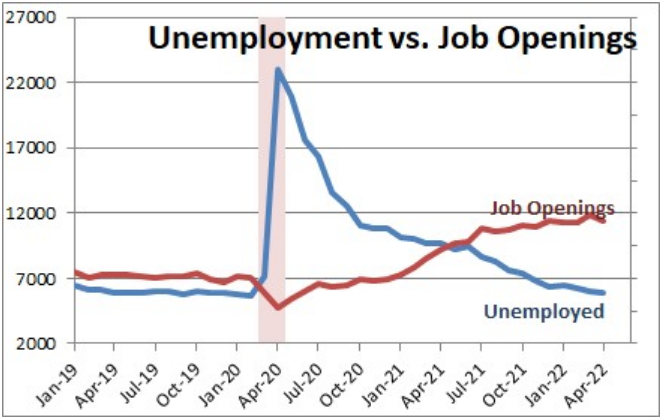
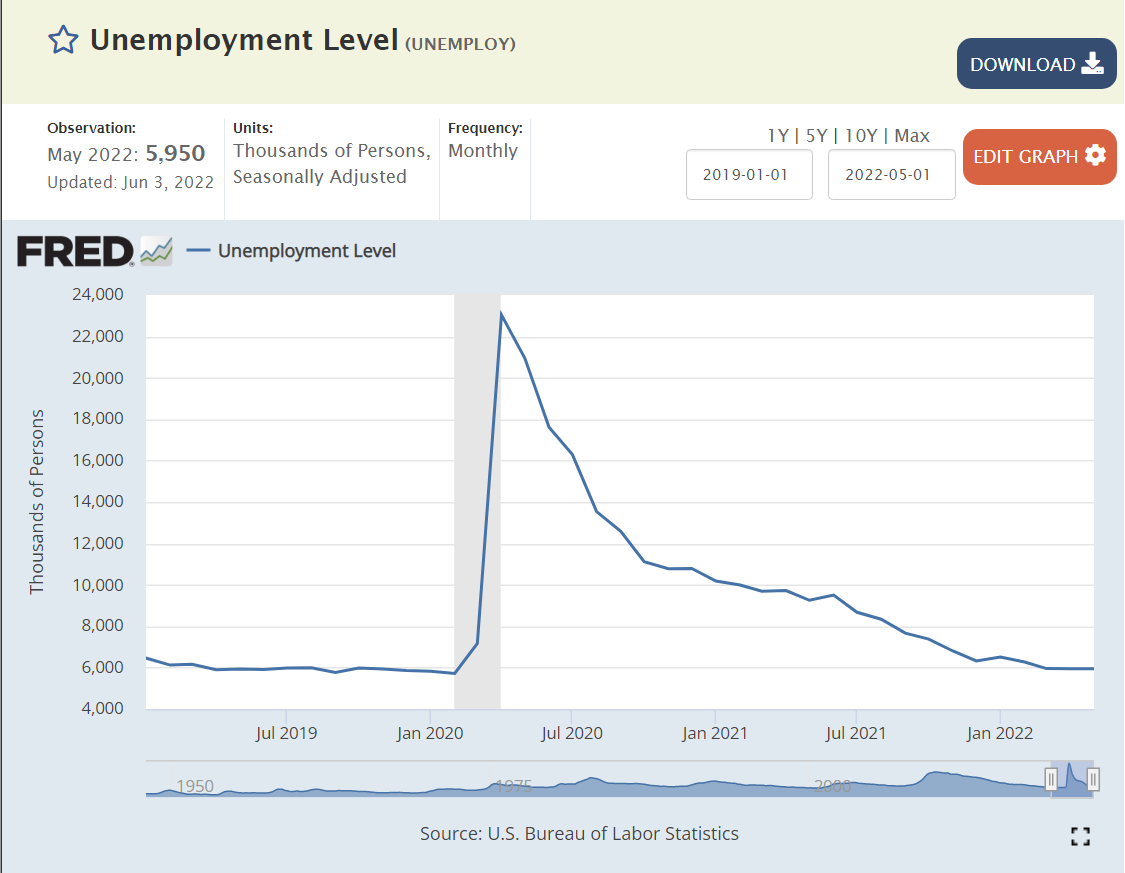
The US economy was at “full employment” in 2006-7 with just 4.6M unfilled positions. The extended recovery after the Great Recession delivered an even lower unemployment rate, but it also delivered a much increased 7.1M open positions. The post-Pandemic economy has returned to an amazing 3.5% unemployment rate, but the unfilled position count has climbed to a much higher 11.2M and stayed there. The current 7% vacancy rate is largely driven by 6 of the 15 industries with the highest rates: Leisure (9.8%), Health (8.6%), Profl Svcs (8.6%), Logistics (7.4%), Manufacturing (6.4%) and Retail (6.4%). American business is slowly learning to manage with a tight labor very market. Demand for labor should fall significantly in the future as firms employ greater technology, processes, capital goods and imports.

NOT.

US Labor Market: Just Like Living in Paradise

https://fred.stlouisfed.org/series/CE16OV

US labor force employment grows and grows. 60M employed in the very glorious 1950’s. 80M by the end of the dynamic 1960’s. 100M by the end of the transforming 1970’s. 120M by the end of the conforming 1980’s. Not quite 140M by the turn of the millennium (2M shy). Just 140M at the end of the “oughts” decade. 158M before the pandemic, resuming the 20M new jobs per decade record of the sixties, seventies, eighties and nineties in the teens decade.

That is 100 million net new jobs added in my lifetime. 160M, up from 60M.

https://fred.stlouisfed.org/series/PAYEMS

We have two sources, a payroll survey and a household survey. They both tell the same story.

https://fred.stlouisfed.org/series/PAYEMS

A once in a century pandemic? No problem. 27 months later, total employment has been recovered, despite a 20M worker decline! Set aside politics. This is an amazing result for the US labor market, businesses and citizens.

https://www.nytimes.com/live/2022/08/05/business/jobs-report-july-economy

US economy continues to add about 400,000 jobs each month. This is almost 5M jobs per year, more than twice as fast as the usual 2M jobs per year in recent history.

https://fred.stlouisfed.org/series/LNU01300060

The labor force participation rate for prime aged individuals (25-54) increased from 65% to 84% between 1950 and 1990 as women were accepted into the labor force. 84% was maintained for a decade and 83% for the next decade. The teens decade saw a decline to 81%. The market has remained in the 81-82% participation rate range.

https://fred.stlouisfed.org/series/JTSHIL

New hires averaged 5M per month in the slower growth “oughts”. New hires dropped further to just 4M per month after the Great Recession. New hires slowly built up to a new record level of 6M per month before the pandemic arrived. The pandemic had just a minor impact on new hires, with a record 6.5M new employees being hired each month in late 2021 and 2022.

https://fred.stlouisfed.org/series/JTSQUR

Voluntary quits averaged 2%, 1 in 50 employees, during the first decade of the 21st century. Quits dropped sharply to just 1.4%, just 1 in 70 employees, in the 3 years afterwards. The quit rate slowly returned to “normal” by 2016 and climbed further to 2.3% as the economic recovery continued for a full decade.

By October, 2021 quits had returned to the solid pre-pandemic rate of 2.3%. The quit rate jumped up to 2.8% by April, 2021 and has remained at this historically high rate.

https://fred.stlouisfed.org/series/JTSJOL

Job openings averaged 4M before the Great Recession. They dropped below 3M during 2009-13. They increased to 5M in 2014 and to 6M by 2016. They remained at the 6M level during 2017, before climbing to 7M for 2018-19. By Jan, 2021 job openings had recovered to 7.2M. By October, job openings had increased to a historic 11M and have remained at this unprecedented level.

This is a greater than 50% increase in open positions since before the pandemic, just 29 months ago. This is 120% more than the peak level before the Great Recession.

Most Important Measure

Profit maximizing businesses, managers and HR departments work through internal processes to list/post a job opening only when:

  1. It’s within the annual financial and headcount budget.
  2. Hiring managers conclude that current staff are unable to serve current demands from internal and external customers.
  3. Hiring managers and financial analysts believe that the incremental hired employees will generate incremental measurable profits.
  4. Hiring managers believe that they can hire new staff using existing processes to fill well defined positions.
  5. Hiring managers believe that it is worth their time to go through the firm’s hiring process.
  6. Hiring managers cannot find an “adequate” labor source through stretching existing staff or using temporary, contract, supplier or agent work forces.

11M job openings means that firms believe that they can generate material incremental profits by hiring up to 11M new employees.

https://www.bls.gov/charts/job-openings-and-labor-turnover/unemp-per-job-opening.htm

11M open jobs is a startling number, but the ratio of unemployed persons to open positions is much more important. The Great Recession created a 6 applicants per job market. This declined to 2:1 in 2014. During the historic extended expansion it declined to just below 1:1, an unprecedented low number. The ratio fell below 1:1 in 2021 to the current 0.5 level. Two open positions for every unemployed job seeker.

https://fred.stlouisfed.org/series/UNRATE

Unemployment was quickly driven to the pre-pandemic record low of 3.5% this summer. Unemployment was below its usual minimum of 5% for 5 years just before the pandemic, leading most economists to recalibrate the “non-accelerating inflation rate of unemployment” (NAIRU) down to 4% or slightly below. This is a very efficient labor market.

https://fred.stlouisfed.org/series/LES1252881600Q#

Real (inflation-adjusted) wages have reflected this labor market situation. They remained at the $335/week level from 2000 through 2014, reflecting the slow growth of employment and GDP. Wages began to raise in real terms in 2015, reaching $360 by 2019, a 7.5% real increase. Wages were growing rapidly just before the pandemic and climbed to $390/week in the second quarter of 2020, an additional 8% increase in a few months. Real wages have since declined back to the $360 per week level as high inflation has offset higher than usual nominal wage increases. Firms have chosen to live with 11 million open positions rather than increase real wages.

Summary

Firms have 11M open positions that they believe will help them to make greater profits. Real wages are the same as they were just before the pandemic started. Firms have chosen to not increase hiring and regular wages any faster because they judge that this will cost them more profits than allowing 11M positions to remain unfilled. This is the first time in at least 50 years that firms have had to manage a labor market where employees and applicants have some market power. Despite this “standoff” in the labor market, total employment is back to the pre-pandemic level, firms are hiring record numbers of employees and labor force participation is recovering towards the pre-pandemic level, which was at a 10-year high. The overall economy has clearly slowed its growth rate to near zero, but the labor market remains in a very positive state for workers.

Trump Presidency Accomplishments

  1. Tax cuts. Corporate rates cut from 35% to 21%, closer to OECD norms. Incentives for returning profits to US. Higher income tax rate cuts.
  2. Regulation cuts. Environment, business, banking, labor.
  3. Lower environmental standards. Withdraw from Paris climate deal. Methane limits. Wetlands. Vehicle milage and emissions standards.
  4. New limits to welfare benefits: Medicare and SNAP.
  5. Antitrust investigations for telecommunications, media, internet, network advantaged firms.
  6. Increased use of Congressional Review Act (1996) to allow Congress to vote down newly implemented regulations.
  7. Economic recovery continued for 3 more years. 2.5% annual growth. 3.5% unemployment. Stock market gains. 6.5M jobs added. Tighter labor market. Increased wages. Minority and lower income gains.
  8. Bipartisan Covid relief spending for individuals and firms.
  9. Home building increased during Trump term and afterwards.
  10. More “Middle Americans” believed that they were heard and represented.
  11. NAFTA agreement renegotiated.
  12. China relations re-evaluated. Higher tariffs on both sides. Technology limits.
  13. Presidential “bully pulpit” used to maintain some US jobs.
  14. Legislation and executive orders used to support US steel, coal and manufacturing businesses and employment.
  15. Legislation passed to improve visibility to tax shelters and tax fraud enforcement.
  16. Agriculture industry subsidies offered to offset trade costs.
  17. Trade deals with South Korea, Japan and EU.
  18. Enhanced trade policy for communications, IT, technology and AI.
  19. Increased military spending.
  20. Revised defense strategy focused on China and Russia.
  21. Flexed US military muscle in limited attacks.
  22. Actions reduced Islamic State threats to low level.
  23. Supported Israel diplomatic relations with 4 Arab states.
  24. US troops withdrawn from Afghanistan, Syria and Iraq.
  25. Opposition to dictators in Cuba, Venezuela, China and Nicaragua.
  26. Reduced support for international organizations such as WHO.
  27. Built 80 miles of new wall and 300 miles of enhanced walls on Mexico border.
  28. Negotiated improved coordination with Mexico and Central American nations regarding immigration.
  29. Reduced legal immigration from all countries.
  30. Reduced opportunities for asylum seekers.
  31. Used “zero tolerance” family separation policies to disincentivize immigrants.
  32. Removed Affordable Care Act individual mandate.
  33. Streamlined FDA approval process and made financial commitments to ensure rapid COVID vaccine development.
  34. Took steps to reduce drug price inflation.
  35. Invested in opioid drug addiction prevention and correction.
  36. Enacted market friendly policies and regulations to expand domestic energy development, furthering American energy independence.
  37. Supported the bipartisan First Step Act which reduces minimum sentences and supports recovery from incarceration.
  38. Invested in historically Black colleges and universities and vocational education (Perkins).
  39. Made small steps to support “school choice”.
  40. Appointed 3 conservative Supreme Court justices and 225 federal justices.

Trump Presidential Results

Economic Policy

  1. Deficit spending is permanently entrenched. 3-5-7% annual budget deficits do not appear to have major economic downsides in investment crowding out or inflation.
  2. Tax cuts do not generate extra growth, investment, productivity or economic resiliency. They transfer dollars to the recipients.
  3. Concentrated supply chains (China) are subject to significant trade, logistics, military and emergency risks which must be managed.

Foreign Policy

  1. U.S. remains the leading superpower and can pursue its own goals with less allied cooperation and attention to “niceties”, at least in the short run. See NATO, Japan, Korea, climate.
  2. China is the number one competitor.
  3. U.S. and Russia relations are no longer based on Cold War issues. The “Hawks versus Doves” dimension competes with domestic political parties.
  4. Negotiating with nuclear states (Iran, North Korea) is very difficult, even for a superpower.
  5. Europe has its own international interests. It will pursue them. It cannot rely upon the U.S. for its defense.

Domestic Policy

  1. Bipartisan immigration policy may be impossible.
  2. Supreme Court and judicial politicization may drive structural changes/reforms.
  3. Racial relations and inequality will be a top political issue for decades.
  4. Wedge issues – abortion, guns, school content/choice, liberty, gay rights – will remain a focus of both parties.
  5. Traditional social security, Medicare and Medicaid are untouchable.
  6. Obamacare is now essentially untouchable. Lower income citizens will have health insurance.

Democracy at Risk

  1. Legitimacy of media, press, free speech threatened.
  2. Government employees, courts, justice system, law enforcement threatened.
  3. Schools, universities and teachers threatened.
  4. Legitimacy of voting processes threatened.
  5. Illiberal democracy, authoritarianism have more support.
  6. Gerrymandering, voting rules, campaign funding rules undercut public confidence.
  7. Voter participation has increased in response.

Communications Policy

  1. Media attention is priceless and can be manipulated by extreme statements and behavior.
  2. Traditional media “fairness” approach (quotes from both sides) can be manipulated to support unsupportable claims.
  3. Every media outlet or actor has some degree of bias. Consumers are more aware, but many choose to only reinforce existing beliefs.
  4. The president has the opportunity to control/influence the attention of the media.
  5. Facts and objectivity are not respected by some media voices. The pattern of communications statements and framing of subjects can be much more important than content.
  6. Political actors are not held accountable for false claims or exaggerated promises. Claims and promises are just tools to motivate the faithful.

Rules of Politics

  1. President has tremendous power. International agreements. Regulations. Executive orders. Bully pulpit. Political party discipline. Using power seems to have little downside.
  2. Only winning matters. Not popularity, broad support, bipartisanship, appearances, fairness, mud, litigation, critics, impeachment, norms, tradition or relations.
  3. Polarization strategy is more effective than building a central coalition. Motivating your team to vote is more important than persuading independent voters.
  4. Candidate character does not matter. Politicians are salesmen and saleswomen. They are lawyers. They are tools, not statesmen.
  5. Party/team winning is most important factor. 400,000 covid deaths were not enough to spark a revolution. Deaths were traded off against economic opportunity without negative political impact.
  6. Harry Truman’s “buck stops here” responsibility position is not required. No one was responsible for Covid results.
  7. Administrative competence is not required to hold office or to run the federal government (so far). Slow appointments, fast cabinet turnover, acting secretaries, department heads that oppose the role of their departments.
  8. President represents his team and interests, not the whole country.

Party Policy

  1. Philosophical conservatives have departed the Republican party and lost influence.
  2. Moderate Republicans (RINO) have mostly departed, have no political candidates and no influence in the national party.
  3. Extremist groups (race, religion, military, nationalist) are not opposed.
  4. Traditional business interests have much less influence (immigration, social issues, antitrust, trade limits, industrial policy, presidential threats, banking, bailouts).
  5. Pragmatic policies and legislation remain largely unimportant. No party platform for 2020. Everyone in the party “knows” basic positions on all issues. No budget policy debates. No health care alternative to Obamacare. No abortion policy. Statements of preference and intent and belief are more important than wonkish details.
  6. Highlighting the threats and follies of the most leftist Democrats is the most effective means to motivate true believers and maintain support of more independent minded voters.
  7. Only a few federal level policies really matter. Tax and regulation cuts. Social wedge issues. Most other topics can be “managed” with small policy victories and messaging.
  8. Party discipline is essential. Republicans are obligated to support the political winners in their party, not to represent all Republicans or all Americans or to “solve problems”.
  9. Managing the voting system (districts, rules, methods) is as important as policies, candidates, fundraising and communications strategies.

Summary

Trump has revolutionized modern American politics. The Reagan revolution consolidated conservative voters, clearly aligning them with the Republican party. The Gingrich revolution further separated the two parties, emphasizing winning and party allegiance. Republican candidates and voters engaged in a reinforcing cycle of “purist” policy aims such as no tax increases, “drill baby drill” environmentalism, banning abortions, and “bomb baby bomb” anti-terrorism. The Great Recession and the tea party further motivated populist leaning voters to demand populist policies and appeals. Trump modified many historical Main Street and Wall Street Republican policies to make the party better embrace the populist mood and “make American great again”.

Trump’s “only results matter” approach has further transformed the party and the nation. His presidency delivered some key political accomplishments. It also produced many “results” that will shape American politics, economics, society and debate for years to come.

https://www.bbc.com/news/world-us-canada-37982000

https://www.pewresearch.org/2021/01/29/how-america-changed-during-donald-trumps-presidency/

https://www.washingtonpost.com/politics/2021/01/20/trump-promised-his-supporters-everything-he-didnt-deliver-most-it/

https://www.politifact.com/truth-o-meter/promises/trumpometer/

https://www.politico.com/news/magazine/2021/01/18/trump-presidency-administration-biggest-impact-policy-analysis-451479

https://trumpwhitehouse.archives.gov/trump-administration-accomplishments/

https://www.vox.com/policy-and-politics/2019/12/2/20970521/trump-administration-achievements

https://www.reuters.com/article/us-usa-trump-legacy-factbox/factbox-donald-trumps-legacy-six-policy-takeaways-idUSKBN27F1GK

https://www.propublica.org/article/the-government-donald-trump-left-behind

https://www.mcleancountyrepublicans.org/trump_administration_accomplishments

https://www.businessinsider.com/trump-biggest-accomplishments-and-failures-heading-into-2020-2019-12#failure-covid-19-pandemic-12

https://www.washingtonpost.com/outlook/2021/01/20/trump-legacy/

https://apnews.com/article/fact-check-donald-trump-farewell-remarks-f911b5ea84a2b69291aa6f52b9ef6318

https://www.barnesandnoble.com/w/trump-got-it-done-jack-t-adams/1139526046

https://foreignpolicy.com/2020/10/14/trump-foreign-policy-wins-losses-over-four-years-china-middle-east-coronavirus-pandemic/
https://www.maciverinstitute.com/2021/01/on-policy-donald-trump-was-by-far-the-most-effective-consequential-conservative-since-reagan/

https://www.newsmax.com/bestlists/donald-j-trump-accomplishments-america-first/2021/06/14/id/1025067/

https://www.thedailybeast.com/even-liberals-have-to-admit-trump-had-real-successes-on-the-economy

https://www.cbsnews.com/news/trump-view-historians/

https://www.pewresearch.org/fact-tank/2021/03/29/a-partisan-chasm-in-views-of-trumps-legacy/

https://www.belfercenter.org/publication/trump-legacy-and-its-consequences

https://www.cnn.com/2021/08/30/politics/trump-legacy-fake-news/index.html

https://www.reuters.com/article/usa-trump-legacy-analysis-int/analysis-trumps-legacy-a-more-divided-america-a-more-unsettled-world-idUSKBN29P0EX

https://www.cfr.org/article/donald-trumps-costly-legacy

https://www.usatoday.com/story/news/politics/2021/01/20/trump-legacy-how-history-see-presidents-tumultuous-four-years/4158507001/

https://www.pbs.org/newshour/show/what-will-trumps-legacy-be-after-leaving-office

https://www.yahoo.com/video/what-is-president-trumps-legacy-203123599.html

https://thehill.com/opinion/white-house/531734-trumps-legacy-an-enduring-contempt-for-truth/
https://www.brookings.edu/research/tracking-turnover-in-the-trump-administration/

Americans, Are You Better Off?

Presidential candidate Ronald Reagan skewered the incumbent Jimmy Carter in the 1980 presidential debate with this question and framing of economic issues.

https://www.youtube.com/watch?v=rU6PWT1rVUk

We are economically better off today than we were in 2019, 2016, 2012 or 2008. As a nation, we need to recognize the strong economy that has been built across several 4-year periods.

Let’s focus on just 2 measures: unemployment and real gross domestic product (GDP).

The US encountered its worst or “tied for worst” economic downturn in almost a century in 2008-9 with the Great Recession.

https://fred.stlouisfed.org/series/UNRATE

The economic recovery was relatively slow, but the economic expansion continued for a RECORD 10 years! This was followed by the pandemic recession which drove unemployment up to 15% in a mere 3 months!! In 2 years, with a never before encountered global pandemic raging and evolving, the US unemployment rate dropped from 15% back to 3.6%!!! It has since levelled off at 3.6%, just shy of the 3.5% rate before the pandemic. This is an AMAZING outcome for the economy and our citizens

https://fred.stlouisfed.org/series/GDPC1

Since WWII (1947), the real, inflation adjusted, “no fooling”, GDP of the US has increased TEN-FOLD! We can honor the “greatest generation” and the country’s sacrifices to win WWII, but the economy in the 1940’s was less than 10% of the size that it is today. This is a true “order of magnitude” change. The economy has rotated from agriculture to manufacturing to services and trade.

The real economy is THREE TIMES as large as it was when Reagan was debating Carter in 1980.

It is 25% higher in 2022 than it was in 2008, despite two major recessions.

Unemployment measures the available labor capacity that is unused. The Depression saw extended periods of 20% unemployment. The post-war period enjoyed low 4% level unemployment through 1957. The next 7 years were above 5%, setting a new expectation of what the reasonable, long-term, natural, non-accelerating inflation rate of unemployment (NAIRU) was. The next 6 years of Vietnam and social welfare spending drove a 4% average unemployment rate which most economists believed was unsustainable and which eventually drove significant increases in inflation. The 1970 recession drove unemployment above 5% where it stayed for nearly 30 years, before finally starting with a 4 in 1997. Unemployment remained below 5% for 3 years, touching a 4% low before the millennium recession. Unemployment then averaged a sustainable 5%+ for the next 6 years, reaching a low of 4.5%.

So, when unemployment rocketed up to 10% in the Great Recession, no mainstream economist expected it to return to less than 4% soon, maybe never. Unemployment eventually reached 5.0% by the end of 2015. Professional economists were sure that it had reached its bottom. But Mr. Market, Dr. Copper and Senor Economy had news for the pundits. Consistently through the next 4 years, unemployment declined another 30% from 5.0% to 3.5% without triggering increased inflation.

The subsequent reduction of unemployment from 15% to 3.6% in 2 years is an incredible result reflecting a robust economy.

Next, let’s turn to a set of global comparisons to gauge if we are “better off”.

Just 12 Countries Account for 70% of Global GDP

US, China, Japan, Germany, UK, India, France, Italy, Canada, S Korea, Russia and Brazil provide the framework for evaluating global economic results today.

https://data.worldbank.org/indicator/NY.GDP.MKTP.CD?locations=JP-DE-BR

US Unemployment Rate is Low

India, France, Italy and Brazil are saddled with 7% unemployment rates, double the US level. Canada and China encounter 5% unemployment. The UK, South Korea and Russia enjoy below 4% unemployment rates with the US. Japan and Germany glory in sub-3% rates. The 12 country average is 5.3%, almost 2 points above the US 3.6% rate.

https://www.economist.com/economic-and-financial-indicators/2022/07/28/economic-data-commodities-and-markets

US Inflation Rate is Above Average

The most recent 9.1% annualized US inflation rate is above the 7.7% average. Russia and Brazil are struggling with 10%+ inflation. Canada, Italy, India, UK and Germany face 6-7% inflation. France and South Korea encounter 5% inflation. Japan and China see just 2% inflation.

Combining the unemployment rate and inflation rates to create a “misery index”, the US scores 12.7%, just above the 12.2% average.

https://www.economist.com/economic-and-financial-indicators/2022/07/28/economic-data-commodities-and-markets

The US Remains the “Big Dog” in the Global Economy

At 24% of global GDP, it is first. China and Japan together add up to 24%. The remaining 9 large countries add up to just less than 24%. Being large provides the advantage of a larger domestic market that attracts investors, entrepreneurs, researchers, supplier, labor, traders, etc. On the other hand, continuing to grow in the same percentage terms through history or compared with smaller countries as the largest economy is a handicap. (This is a great graphic worth exploring for a few minutes)

US Leads in Per Capita Income by a Wide Margin

US reports $63,200 per year. Germany, Canada, UK, Japan and France range from $39K – $46K, roughly two-thirds of the US level. Italy and South Korea check-in at $32K, about one-half of the US level. China and Russia earn $10K annually, while Brazil ($7K) and India ($2K) lag further behind.

https://www.investopedia.com/insights/worlds-top-economies/

US Gross Domestic Product Increased 8% from 2019 to 2021

GDP figures are not widely available for the first half of 2022 for countries, so we can use the pre-pandemic 2019 compared with the late pandemic 2021 to gauge recent economic performance.

The US GDP in 2021 was 8% higher than in record breaking 2019. It increased by $1.63 trillion in 2 years. Global GDP in 2021 was $90T. US GDP grew from $21.37 to 23.0 trillion.

China (factory to the world), in a period when demand for durable goods increased by 20% and nondurable goods by more than 10%, grew even faster, from $14.3 to 17.7 trillion, an increase of $3.4 trillion. I believe this is overstated somehow, given other data that indicates 6-7% annual growth in China each year, but it’s first place two-year ranking is clear.

The other 10 major economies combined grew from $26.4 to $27.7 trillion, an increase of $1.3 trillion, totaling less than the US $1.6 trillion growth. Their 5% combined growth rate trails the US 8% growth rate.

In percentage terms, the UK, India and Canada grew by 10% or more. Germany, France and South Korea grew by 8-9%. Russia and Italy grew by 5%. Japan and Brazil endured economic declines.

https://data.worldbank.org/indicator/NY.GDP.MKTP.CD?locations=JP-DE-BR

US Leads Long-term Stock Market Gains

From the end of 2012 through July, 2022, almost 10 years, the US Standard & Poor’s stock index gained 175%. Fast growing India and previously undervalued Japan reported the same kind of amazing 10 year returns, compounding at more than 11% annually. Germany, France and Brazil grew by a decent 75%. Resource based Canadian and previously overvalued Chinese stocks gained a modest 50%. The UK, Italy and South Korea edged up by 25%, while Russia dropped by 25%.

Stock market returns reflect relative initial evaluations, changes in investor preferences, terms of trade and the underlying profitability/sustainability of each country’s economy. By this measure, the US has a very bright future.

US Leads Short-term Stock Market Returns

Comparing July, 2022 with a pre-pandemic base of December 31, 2019 shows a 25% gain for the US, Japan and India, even with the 20%ish stock market declines in the first half of 2022. Canada and South Korean markets are up a respectable 10%. China and France report a modest 5% gain. Germany and the UK show no gain. Italy, Russia and Brazil are in the 10% loss range. Even with strong gains from 2012 through 2019, the US stock market lead the world through the pandemic recovery period.

Summary: Very Solid US Economy

US inflation has returned to threatening levels and consumer confidence has fallen sharply while confidence in the incumbent president has continued to decline. The current “mood” is negative despite many positive economic factors such as the labor market and growth in GDP, housing and stock values. We are having journalistic, academic and partisan debates about hanging the “recession” label on the economy.

Big picture, the US economy is in great shape. It continues to grow, employ labor, increase wages, export, generate profits and build asset values. The economy worked through a “once in 100 years” global pandemic, with limited long-term economic damage.

There is a risk of a recession, even a moderately painful 3-5% downturn. There is a risk that inflation will remain elevated for more than 1 year, reducing the value of wages and assets. But these are normal business cycle issues, not the “end of the world”. The responses of consumers, investors, suppliers, businesses, bankers, central bankers, regulators and … politicians to the last two recessions were constructive and helpful. We have the ability to work through our current economic headwinds if we choose to do so.

US Recession? Probably Not Yet

https://www.un.org/en/coronavirus

I tried to find a “mainstream media” article that objectively and insightfully evaluates the state of the US economy as of the end of the second quarter without success. So, I’ll take a shot at it.

First, I want to highlight that “this time, it’s different”. The US and global economies are recovering from a global pandemic situation last seen more than 100 years ago. The global economy is more integrated than ever. Viruses spread faster than ever. Businesses and governments have more information and ability to change quickly than ever before. The economic contraction was sharp, far more severe than the Great Depression or the Great Recession. The health care experts were unable to immediately evaluate the threat or recommend public policies. Nonetheless, “they persisted” and the medical, travel and economic recovery was far quicker than ANYONE expected in March, 2020 or December, 2020 or September, 2021 or January, 2022.

Second, I apologize for the required details involved to evaluate the simple question, “are we in a recession?”. Unfortunately, there is some judgment involved, as we have to evaluate three factors. Is there a clear downturn versus the trend rate? Is the downturn of significant length? Is this a widespread downturn, effecting most sectors of the economy?

Einstein said “be simple, but not too simple”.

https://wiki.c2.com/?EinsteinPrinciple

Sir Walter Scott noted the “tangled web we weave”.

https://nosweatshakespeare.com/quotes/famous/oh-what-a-tangled-web-we-weave/

The Ancient Greeks noted “many a slip twixt cup and lip”.

https://en.wikipedia.org/wiki/There%27s_many_a_slip_%27twixt_the_cup_and_the_lip#:~:text=There%27s%20many%20a%20slip%20%27twixt%20the%20cup%20and%20the%20lips,your%20chickens%20before%20they%20hatch%22.

Cheech and Chong rambled on with ” recession, repression …”

https://www.lyricsfreak.com/c/cheech+chong/santa+clause+and+his+old+lady_20745568.html

Total Economy Level

https://fred.stlouisfed.org/series/GDPC1

At the aggregate level, we clearly have a peak. Do we have an extended downturn? Not yet, based on the total. The rapid recovery from the second quarter 2020 bottom could not be sustained. A significant slow-down in the growth rate was expected. Typical annual real GDP growth in recent years has been only 2%, so the difference between “extended expansion” and “recession” is thin.

Components

Macroeconomic theory focuses on aggregate demand and aggregate supply. Real, inflation adjusted, gross domestic product (GDP) is a measure of the productive output of a nation. The demand side is split into consumption, investment, government and net exports. I’ll go one level deeper, reviewing 9 components of GDP.

The business cycle is influenced by the relative sizes of the components of GDP and their relative variability from quarter to quarter and typical changes as the business cycle moves from expansion to decline to recovery.

From most to least correlated with the business cycle, with their current percentage share of GDP (sums to more than 100 because imports are a negative factor and changes in private investment can be negative), the 9 components are: Change in private inventories (1%), Residential Investment/Housing (5%), Business Investment (14%), Durable Goods Consumption (9%), Imports (16%), Non-durable Goods (food, energy) (15%), Services (45%) !!!!, Exports (8%) and Government (17%).

Overall, I see 4 sectors as “maybe” trending to a recession and 5 sectors currently at “no”. Unfortunately, the two most sensitive, Housing and Business Inventories, are in the “maybe” category, along with non-durable goods consumption and government consumption.

It is critical to look at the longer-term trends and context to evaluate short-term changes. There is significant month-to-month and quarter-to-quarter variability in the final numbers for GDP and especially for the initial estimates, like those we just saw for the second quarter of 2022. Significant revisions are made for 6 months, which is why the NBER committee which officially declares recessions is typically waiting longer to make a final call than everyone desires. Hence, I won’t usually share a long-term graph, a short-term graph, annual percentage changes and quarterly percentage changes annualized for each component. The media tends to focus on the preliminary quarterly percentage change annualized as the “gospel”. This is unwise. Let us begin to review the 9 main components.

Durable Goods (9% of GDP, 4/9 Volatile)

https://fred.stlouisfed.org/series/PCEDGC96#0

Durable goods demand spiked by an incredible 20-30% during the pandemic, fueled by government transfers and fewer opportunities to consume services. Demand for durable goods has flattened at this 20% higher level, it has not declined. In my view, this sector is not signaling recession.

Non-durable Goods (15%, 6/9 Volatile)

https://fred.stlouisfed.org/series/PCENDC96

Non-durable goods consumption jumped by a real 12% during the pandemic and has essentially remained at this elevated level. We have two quarters at slightly lower consumption levels, so I rate this as “maybe” moving to a recession. Focus on the “big picture”. Both durable and non-durable goods consumption increased by historic percentages during the pandemic period and have remained at that elevated level 2 years later. It is not surprising that this demand has flattened or fallen off a bit. The surprising feature is the willingness of the American consumer to voluntarily spend much more money on “things” during the pandemic and maintain that level of spending as service opportunities returned, government transfers ended, and savings were drawn down.

Services (45%, 7/9 Volatile)

https://fred.stlouisfed.org/series/PCESC96

The very large (44% of GDP) services sector was slower to recover from the pandemic, but demand for services remains quite strong, even though the percentage growth rate is lower than during the initial recovery period.

Business Investment (14%, 3/9 Volatile)

https://fred.stlouisfed.org/series/PNFIC1

Business investment was above trend in the two years before the pandemic and has resumed its solid level. No recession indicator here.

Housing (5%, 2/9 Volatile)

https://fred.stlouisfed.org/series/PRFIC1

New housing investment grew by 50% between 2012 and 2016 and then remained at that level for the next 4 years before the pandemic. Long-run supply and demand factors indicate a “need” for more housing construction in the US to make up for the “missing” construction from 2008-2016. New housing construction did not decline with the pandemic, it increased by 15% in real terms! As with durable and nondurable goods consumption/production, this would not have been predicted in March, 2020 by anyone. Residential construction has levelled off 15% above 2019, equal to 2007 before the Great Recession. The increased mortgage interest rates indicate that demand will soften and this sector will decline somewhat in the second half of 2022, so this is a “maybe”. The long-term shortage of housing supply provides a floor for this sector.

Business Inventories (1%, 1/9 Volatility)

https://fred.stlouisfed.org/series/CBIC1
https://fred.stlouisfed.org/series/A371RX1Q020SBEA

“Supply chain issues” have restricted the accumulation of business inventories since the pandemic began. The unexpected spike in demand for durable and nondurable goods and residential construction lead to shortages. Worries about supply chain resiliency have led to higher targeted business inventory levels. Retailers have overstocked some product categories as the recovery has slowed and are being forced to discount prices to move these goods. Overall, this is a slight “maybe” recession indicator. I think that businesses would like to have 20% higher inventories overall.

https://fred.stlouisfed.org/series/ISRATIO

Exports (12%, 8/9 Volatility)

https://fred.stlouisfed.org/series/EXPGSC1

US exports continue to solidly recover from the pandemic.

Imports (16%, 5/9 Volatile)

https://fred.stlouisfed.org/series/IMPGSC1\

Although imports act as a reduction in the calculation of GDP, they tend to decline when the US economy declines. Import demand remains high, not indicating a recession.

Government (17%, 9/9 Volatile)

A majority of government spending is accounted for as a simple transfer, not part of the annual production of goods and services.

https://fred.stlouisfed.org/series/GCEC1

Government production activity grew quite significantly from 2014 to 2020. It has since declined by less than 1%. I rate this as a “maybe” indicator of recession, even though government activity is typically a countercyclical indicator, rising when recession arrives.

Summary

Services (45%), Business Investment (14%), Exports (12%), Imports (16%) and Durable Goods (9%) are NOT in recession. Housing (5%) and Non-durable Goods (15%) point towards recession, while Government (17%) and Business Inventories (1%) show warning signs. If I were a member of the NBER board, I would not designate a recession in the first half of 2022 as of today.

For the second half of 2022, a recession is possible. The Fed raising interest rates is already affecting the housing industry. But businesses continue to report solid to record profits. The stock market has declined by a bear market 20% but may or may not have found a bottom. The global risks from Russia’s attacks on Ukraine and China’s Covid lockdown strategy remain. Consumer confidence is weak, especially in a partisan world. Business confidence is weaker than in recent months, but most measures remain marginally positive. The labor market is at its strongest position in 50 years, supporting consumer demand. Higher than expected inflation has slowed consumer spending, but not to recession levels. Consumer savings and debt levels remain positive. Business debt levels have increased, but most businesses locked in low debt interest rates during 2020-22.

Why So Positive?

  1. Governments operate with expansionary fiscal policy, ensuring that aggregate demand is adequate. There is a risk of too much stimulus and “modern monetary theory” excesses, but so far this is not a risk in the major economies.
  2. Central banks are more effective. They provide credit in downturns, increase interest rates when required, coordinate with each other and pressure banks to hold adequate capital.
  3. Governments and central banks take proactive steps to avoid currency crises,
  4. After the Great Recession, lending in the US housing market is more reasonable.
  5. Businesses have worked through many challenges in the last 15 years and are well positioned to prosper.
  6. The overall economy is increasingly based on services more than manufacturing, mining and agriculture. The operations leverage of manufacturing facilities is a smaller factor in the world economy.
  7. Labor power is lower. Cooperation with management is stronger.
  8. Demand for labor is high. US has record open jobs and voluntary quits. The effective minimum wage has increased from $8-10 per hour to $12-15 per hour without major business disruptions.
  9. Trade is lightly restricted.
  10. Global economy is multipolar, relying on US, EU, Japan, China, India, Middle East, etc.
  11. Technological progress continues. Better goods and services. Better processes, trade, transportation, markets, communication and insights.

Good News: SCARY INFLATION Has NOT Returned!

I was a wide-eyed young adult when the US last experienced 12% and 15% inflation rates. Our current situation is very different from that sad time 50 years ago. Fiscal policy was much looser, with LBJ pursuing a both “guns and butter” policy and Nixon following along. Monetary policy was slightly accommodating in the 70’s, comparable to today. The “supply shock” in the 70’s was much larger. The US was then much more dependent on foreign oil imports. Today the US is roughly “energy independent”, so subject to global price changes only. In the 1970’s, labor unions had some degree of power against the largest manufacturing concerns and used that power to attempt to maintain workers’ wages. There is no similar labor power today.

Average Inflation is at a Recent High of 8%

Core Inflation, Excluding Food and Energy is Growing at 6%

The inflection point is March, 2021. 2-3% inflation before then. 6% inflation in the last year. 6% is much higher than the 2% trend of the last 2-3 decades, but not a harbinger of spiraling inflation or wage-price spirals or cost-push inflation.

Inflation is Driven by Historically Highly Variable 1) Energy, 2) Commodities and 3) Food Prices.

The doubling of global energy prices since the end of 2020 is apparent. This was driven by the unexpectedly rapid global recovery from the pandemic (good news, overall) and the supply crimp from the Russian invasion of Ukraine. Energy is a 7% weight in consumer prices, so a doubling has a tremendous effect.

US demand for durable goods spiked by 50% within the pandemic, as in-person services were unavailable. This completely unexpected increase in demand for final goods drove a completely unexpected demand for commodity inputs, resulting in much higher prices that continue through today.

https://fred.stlouisfed.org/series/CPIFABSL

Food price increases also spiked. The pandemic interrupted direct agriculture and food processing labor inputs. Raw food inflation reached 16%, while “away from home” food prices grew by just 7%.

Lodging and Vehicle Prices Spiked Due to the Stop/Start Nature of the Pandemic Economy.

Lodging and used car inflation exceeded 20% but is now slowing. New car prices increased by 12%, but this price increase is back down to a 7% annual rate.

But, All Other Sectors Have Experienced “Normal” – Non-accelerating 6% or Lower Price Increases.

6%.

3-4%.

3-5%.

4-5%.

Drugs 2%. Medical Services 6%.

Communication and IT continue their price decreases after a small increase.

1-2% annual inflation.

Household furnishings, up 9% like other consumer durables.

Food away from home, up 6-7%, despite the incredible disruptions in the last 2-3 years.

Summary

Energy, food and commodities prices have increased sharply in the last year. The other dozen price indices have increased by 5-6-7% and then flattened off. Loose fiscal and monetary policy, combined with commodities price spikes have driven quite high consumer price inflation for the last 6-9 months. Inflation will drop from 8% to 6% in the 3rd quarter and then to 4% in the 4th quarter and then lower into 2023.

There is no indication of rapidly increasing prices or a wage-price spiral. US labor unions don’t have the power to respond to the recent unexpected increase in consumer prices with a demand for equal or higher wage increases. Wages have increased by 5% in the last 2 years as inflation has spiked to 8%.

Good News: Black Labor Force Participation Exceeds National Average, First Time in 50 Years

https://www.bloomberg.com/news/articles/2022-06-03/black-americans-lead-recovery-in-may-labor-force-participation#xj4y7vzkg
https://www.brookings.edu/blog/the-avenue/2022/06/17/three-questions-for-the-labor-markets-near-future/

African-American men and women have increased participation rates quickly since the depths of the pandemic.

https://www.epi.org/indicators/unemployment/
https://www.bls.gov/webapps/legacy/cpsatab2.htm

The African-American employment to population ratio has been increasing through time, closing a 5 point gap to just 2 points before the pandemic, and squeezing it to less than 1 point most recently.

Context Since March, 1990 Peak Overall Rate

4 point decline before the pandemic. 1.5% pandemic hit. Almost 50% recovery.

3 point decline for prime age workforce, but 2 point improvement at the end of the prior economic recovery period. 2 point pandemic hit. More than 3/4ths recovered.

6 point slide before pandemic. 1.5 point pandemic hit. Perhaps 1/3rd recovered.

Up 3 points. Down 3 points. Up 3 points. Down 2 points. 80% recovered.

Context: History and Trends Through 2015+ Were Negative or Unclear for African-American LFP

https://www.philadelphiafed.org/-/media/frbp/assets/economy/articles/economic-insights/2017/q4/eiq417.pdf
https://www.bls.gov/spotlight/2018/blacks-in-the-labor-force/pdf/blacks-in-the-labor-force.pdf
https://www.bls.gov/spotlight/2020/african-american-history-month/pdf/african-american-history-month.pdf

Challenges Make Black LFP Rate Improvement Even Better News

https://www.clevelandfed.org/en/newsroom-and-events/publications/economic-commentary/2021-economic-commentaries/ec-202123-whats-holding-back-employment-in-the-recovery-from-the-covid19-pandemic.aspx
https://www.bls.gov/spotlight/2020/african-american-history-month/pdf/african-american-history-month.pdf
https://www.epi.org/indicators/unemployment/

Historically high concentrations of Black workers were hard hit by the pandemic.

https://www.bls.gov/spotlight/2020/african-american-history-month/pdf/african-american-history-month.pdf
https://www.pgpf.org/chart-archive/0255_poverty_by_race

Positive Factors Supporting the Increase

https://www.bls.gov/spotlight/2018/blacks-in-the-labor-force/pdf/blacks-in-the-labor-force.pdf

Size, growth and share all matter. Black workers may have quietly reached a “critical mass” where they face less obstacles and benefit from more positive network effects.

https://www.bls.gov/spotlight/2018/blacks-in-the-labor-force/pdf/blacks-in-the-labor-force.pdf
https://www.bls.gov/spotlight/2020/african-american-history-month/pdf/african-american-history-month.pdf

A history of higher than average labor force participation by those with some college education and a growing share of people in that category.

https://www.bls.gov/spotlight/2020/african-american-history-month/pdf/african-american-history-month.pdf

Black men have worked full-time schedules about the same as all men, while Black women have worked full-time more often than other women.

Context: The Labor Market

Real wages are up for African-Americans.

From 1975-97, African-American unemployment rates were 10% or higher. They briefly found the 7-8% level at the end of the Clinton presidency/expansion. They popped back up to 10% and recovered to about 8% before the “Great Recession”. They jumped up to 17% and then slowly declined to 10% by 2015. The extended recovery brought them down below 7% in 2018 and to a record low of less than 6%, briefly during 2018-19. The pandemic flirted with 17% rates once again. Instead of taking a decade to recover, unemployment rates have recovered in 2 years.

https://www.bls.gov/spotlight/2020/african-american-history-month/pdf/african-american-history-month.pdf
https://www.epi.org/indicators/unemployment/

Black unemployment continues to be higher than other groups, but the gap is smaller than it once was.

References: Many Challenges Remain for African-Americans in the US Labor Market.

https://www.clevelandfed.org/en/newsroom-and-events/publications/economic-commentary/2021-economic-commentaries/ec-202123-whats-holding-back-employment-in-the-recovery-from-the-covid19-pandemic.aspx

https://www.mckinsey.com/featured-insights/diversity-and-inclusion/race-in-the-workplace-the-black-experience-in-the-us-private-sector

Good News: Increased Labor Force Participation

For each comparison, I’ll focus on the pre-pandemic Feb, 2020 numbers, the effective bottom rate in Jun/Jul, 2020 and today’s rate at May, 2022, about 2 years later.

The overall labor force participation rate dropped by 2 points from 63.4% to 61.4% and has recovered about half-way to 62.3%.

While many hope for a faster recovery, this 1% increase in 2 years is faster than from prior recessions. It is also taking place in the context of a long-term decline from 2000 to 2015, followed by a plateau and a bit of an increase in 2019 as the recovery from the “Great Recession” moved into a record length with record low unemployment.

The Hispanic rate generally followed the overall rate since 2000. However, the rate increased by a full 2 points in 2019. Hispanic labor force participation encountered a larger drop of almost 3 points, but has recovered one-half of the decline.

The Asian LFP rate follows the same general decline and flattening, with a somewhat higher rate in 2018-19 than the minimums from 2014-16. It dropped a little less than the overall average during the pandemic, by 1.7% and has fully recovered to the pre-pandemic level!

Black Americans showed the same general decline after 2000 to a minimum of 63% in 2015, with a significant and maintained increase to 64% in 2016 and a further 1% increase in 2019. Black labor force participation fell by a little more than 3 points to just 60%. It quickly added 1 point and in the last 6 months has added 2 more points, returning to its pre-pandemic 11 year high!

The White rate followed the overall pattern, but remained at the 63% plateau through the middle of 2019 before inching up by one-half percent. The participation rate was 1.8% lower in Jun/Jul, 2020. It did not change materially through the 3rd quarter of 2021, and has since added 0.4%. The White rate has recovered only 30% of the lost participation rate.

Women had added about one point of participation between 2016 and the beginning of 2020. Their participation declined a little less than men, at 1.8%. Women were slow to return to the work force during 2021, but have now closed one-half of the gap.

The Male participation rate remained flat from 2014 through the end of 2019. Note that male participation has been declining for 70 years. 2.1% of men left the labor force by Jun/Jul, 2020. The return during 2020-2021 was slow. The more recent increase has 40% of the absent men returned to the workforce.

Black men did not see a major participation rate increase in 2019. They experienced a 2.6% decline from the pandemic, followed by a 1% increase in the next year and a dramatic improvement in 2022 to a participation rate above the pre-pandemic level.

About 1.5% of Black Women were attracted into the labor force in 2019. Their pandemic decline was a very high 3.9%. They have added 2.7% of participation, so are about 3/4ths recovered.

Hispanic men did not show a clear participation increase in 2019. Their rate fell by a large 2.8% in the pandemic. It has rebounded by 2%, so is about 2/3rds recovered.

An additional 3% of Hispanic women entered the labor force during 2018-19. Their participation rate fell by 3.3% and remained low through the third quarter of 2021. It has grown by less than 1%, leaving it at a one-fourth recovery level.

White men did not increase their engagement during 2019 and recorded a 1.8% participation decline. There has been no significant recovery at this date.

Looking at the long-term trend, it may be that the 2015-19 rates were just a “pause” in the long-term decline. This topic warrants a separate article.

A smaller percentage of White women were drawn into the labor force during 2019, less than 1%. Their participation rate declined by 1.4% by Jun/Jul, 2020 and by 2% total in mid-2021 before beginning to recover. They have recovered by one-fourth to one-third of their decline.

Teenagers were least impacted by the pandemic, returning to prior work levels in less than a year.

College age young adults added almost 2 points of participation during 2018-19. They dropped a stunning 5.3% during the pandemic. They have recovered a solid 2.8%, so are a little more than 50% back.

The 55 and older group didn’t add many workers in 2019. Their participation declined by 1.1% and then by 1.7% total during 2021. They have recovered about one-third of the maximum decline.

The prime age (25-54) work force participation rate dropped 3 points, from 84% to 81%, between 2000 and 2015 in periods often decried as “jobless recoveries”. This group added 2 points of participation during 2016-19 as the recovery was extended, jobs added and unemployment reduced to record lows. Participation dropped by 2.1% in the pandemic. It has recovered 1.5%, so it is about three-fourths back to the elevated pre-pandemic level. The monthly increase rate looks very solid.

Prime age men added almost 1% of participation from 2016-2019 before losing 1.5% in the pandemic. They have added 1 point of participation, so are two-thirds recovered.

Prime age women added almost 3 points of participation from 2016-19, but experienced a 1.7% reduction during the pandemic. They have added 1.4% to their participation rate, reaching 80% of total recovery to the high pre-pandemic level.

https://www.epi.org/indicators/unemployment/

The even simpler ratio of employment to population shows a near total recovery in the prime age population. The steepness of the curve indicates that this will continue, at least in the short-run, even though the peak ratio was only 80.2%, 80.2% and 80.5% in 3 prior economic expansions. In 1999, the recent record was 81.9%.

Summary

From 2000 to 2015, the overall, male and white-male labor force participation rates declined by 4%, 5.5% and 5%. These rates bottomed out from 2016-18, with small increases in 2019. The recovery from the pandemic is fighting long-term trends that result in lower labor force participation (lower and later marriages, declining/flat pay for lower-skilled workers, increased disability claims, increased criminal, drug and alcohol records, social acceptance of not working, electronic entertainment options, etc.). Minority groups saw stronger 1-2% participation rate increases in the last years before the pandemic.

Hispanics, Blacks, teens and college students experienced pandemic dropout rates much higher than the 2% average from Feb, 2020 to Jun/Jul, 2020.

Overall, one-half of the decline has been recovered, but there are significant differences among the groups. Adults 55+ have remained close to their reduced rates. White men (a big share of the labor force) have made little progress returning to the labor force. Less than one-fourth of Hispanic women have returned. Two-thirds of the Hispanic male decline has been recovered. Three-fourths of the Black female gap has been closed. Teen participation has recovered (90%). Asian participation has fully recovered. Black male participation is above the pre-pandemic level.

The prime age group (25-54) has regained 1.5% of its 2.1% decline and the recovery trend looks solid in spite of the slower recovery groups.

Labor force participation has not increased quickly in prior periods. Based on the significant increases in the last 6-months, a continued increase in the participation rate through the end of the year is likely. I estimate that the pre-pandemic participation rate of 63.4% will be reached in the 1st quarter of 2023.

Good News: The Increase of Producer Price Inflation Has Peaked

https://4kwallpapers.com/nature/jasper-national-park-alberta-canada-winter-glacier-4561.html
Measure2.5 YearsRecent 1 YrTrend
PPI Minus food, energy, trade11%7%Peaked
Total Final Demand16%11%Peaked
All Commodities37% !!20% !Flat
Energy56% !!!45% !!Flat
Foods23% !13%Down
Other Goods14%8%Peaked
Other Services6%3%Down
Transport and WH24% !20% !Peak?
Whlse and Retail Trade22% !14%Down

For each measure of produce prices, I’ve provided a 5- or 10-year framework of annual inflation AND a 5 year view of prices indexed to Jan, 2020 before the pandemic began. We did have 2% inflation before the pandemic.

This traditional measure of ongoing inflation pressures peaked at 7% annual rate in 4Q, 2021. In total, just 12% in 2+ years.

Grand total PPI reached 10% annual inflation by the end of 2021 and has remained at that level. This provides pressure for CPI to be higher than 7% for a few more months.

Commodities pressure has been strong only recently, so the total PPI is just 3% higher than the measure excluding the volatile components.

Annual commodity inflation rocketed from 0% in Dec, 2021 to 20% by Jun, 2022 as the global economy was recovering from the pandemic and the extraordinary increase in durable goods demand was registered in supply chain purchasing decisions. Commodities are historically most volatile, but this increase in demand and prices was historic. Note this is way before the Ukraine invasion.

Energy prices were below the pre-pandemic level as late as Jan, 2021 (-3%). They increased exponentially to 50% higher by Apr, 2021. Energy prices have continued to increase at 35-40% annual rates as increased demand, mothballed assets and the Ukraine invasion effects combined to change the global markets. This is one measure where continued very high inflation is possible.

Food prices were a little slower to accelerate. Zero increase at Dec, 2020. 4% annual inflation at May, 2021. 13% inflation at Aug, 2021. Again, this is pre-Ukraine. The 13% ish inflation rate has continued, supported by Ukraine issues. Historically, food prices do not remain elevated for long periods.

Another subtotal, excluding 2 more volatile sectors shows 8-9% inflation peaking.

Business services inflation has remained tame, supporting the notion that cost-push inflation due to wage increases is not yet a major threat.

Transport and warehouse prices were also slow to “take off”, remaining below pre-pandemic level through Feb, 2021. Energy prices drive the transportation sector, so these prices also increased. The 20% annual increase seems to have peaked.

Wholesale and retail trade also lagged a bit, still at the historical average 2.5% inflation rate as of Mar, 2021. But, inflation grew to 10% by Aug, 2021 and a peak of 18% in Mar, 2022. The annual rate of inflation has receded to 15%, but that still offers some risks to the CPI for the next 6 months.

https://www.bls.gov/news.release/ppi.nr0.htm

https://www.bls.gov/ppi/

Summary

Six of the nine measures have peaked or are declining. The other three remain at worrying levels without clear signs of retreat. The “core” PPI inflation measure at 7% is not accelerating, so CPI should be able to decline in the second half of 2022. On the other hand, commodities inflation, mostly driven by energy inflation, remains very high without evidence of a meaningful decline in the near-term. Historically, energy and commodity prices fall back after a sharp increase. The general weakening in the global economy also points to a somewhat softer market for energy and commodities.

There is no evidence yet of labor-based cost-push inflation or accelerating/spiraling/self-reinforcing inflation.

“Price gauging” claims are always in the eye of the beholder/customer/politician. When I see relatively low historical price increases, followed by sharp increases, I imagine that business leaders are taking advantage of the situation to drive price increases that were impossible to propose and make stick during the less dynamic past. These can be spotlighted during a period of high inflation, but appear to be more reasonable across the whole business cycle. The food and energy price changes look similar to historical levels of volatility so are less easily questioned.

Big picture, IMHO, this looks like a global commodities “squeeze” due to the faster than expected recovery from the pandemic, especially the 50% growth in demand for durable goods as in-person services were less attractive and available. Loose fiscal and monetary policy in the US and other nations may have been a significant driver of the faster than expected global recovery, but this does not look like a classic case of excessive fiscal and monetary stimulus.

In hindsight, the slow response of the US Federal Reserve Board to the very rapid change in price levels from Jan, 2021 to Jun, 2021 looks like malpractice. Market prices quickly adapted to the current and expected disconnect between supply and demand.

Producer and consumer price increases are likely to remain in the 7-8% range during the 3rd quarter of 2022, but should begin to drift back to the 5-6% range in the 4th quarter of 2022, and still lower in 2023, especially if the Fed increases interest rates by the expected 3-3.5% and businesses slow their inventory, hiring, project and capital spending decisions accordingly.

Good News: Widespread 2% Unemployment Rates

14 States Are Currently Below 3%

North Dakota, Wisconsin, Oklahoma, Kansas, South Dakota, Minnesota and Nebraska form a low unemployment core in the Great Plains area. Utah, Idaho and Montana represent the Rocky Mountains. Vermont and New Hampshire lead in New England. Alabama leads the South, while Indiana leads the Midwest.

https://www.bls.gov/news.release/laus.nr0.htm

22 Metro Areas with 1M+ Population (of 51) Enjoy Unemployment Rates Under 3%

https://www.bls.gov/web/metro/laulrgma.htm

Large and Small Metro Areas Have Many Low Unemployment Areas

https://www.bls.gov/web/metro/laummtrk.htm

Low Unemployment Rates in US History

https://fred.stlouisfed.org/series/UNRATE

May, 1953: 2.5%

Feb, 1968 – Dec, 1969: 3.5-3.8%

Oct, 2000: 3.9%

Dec, 2006: 4.4%

Jan, 2016: 4.8% through Feb, 2020: 3.5%. 4 years “below full employment”.

Estimates of Natural (Non-accelerating Inflation) Rate of Unemployment (NAIRU) Have Been Biased Upwards and Influenced by One Period of High Inflation and Supply Chain Disruptions

https://www.chmura.com/blog/2019/july/19/how-low-can-the-unemployment-rate-goauthormikechmura

In retrospect, the period before 1976 (oil, trade, inflation shocks) should have used a 4.5% NAIRU for policy decisions. The jump to 6% in the late 70’s and early 80’s is supported by history. The NAIRU was deemed to be 5% or higher as late as 2010, but could have been pegged lower. Based on the lack of inflation during the teens, the rate probably should have been set at 4% or lower.

Macroeconomic Theory

Classical economics asserted that labor markets will naturally find equilibrium wages and quantities of labor employed at the individual labor market (micro) and total economy level. The Keynesian view, embraced by 90% of professional economists, is that there are market imperfections at both the individual market level and total economy level. Most importantly, wages are “sticky downwards”. Currently employed workers resist “losing” wages by accepting pay cuts when demand is lower. Aggregate supply (production) does not automatically create an equal amount of aggregate demand in the short-run, as businesses, individuals, banks and governments often choose to save more during economic downturns or periods of greater risk. Hence, a downturn in the economy caused by any source may result in a prolonged negative spiral, rather than automatically delivering lower prices in product, money and labor markets, which could help to recover these markets.

https://www.economist.com/the-economist-explains/2017/09/22/how-low-can-unemployment-go

https://www.economist.com/the-economist-explains/2017/09/22/how-low-can-unemployment-go

Microeconomic Theory: Why is There Any Unemployment?

Economists point to frictional and structural factors. Frictional unemployment occurs because labor market information and decisions are not perfect and instantaneous. As with other markets: housing, commercial real estate, offices, bank loans, farm fields, airport gates, container ships, utilities, R&D, IPO’s, private equity, M&A, retail inventories, etc, labor markets are imperfect. It takes time for equilibrium to be found. Given the increased concentration of labor in major metropolitan markets and internet-based recruiting systems, frictional unemployment has decreased in the last 20-30 years.

Structural unemployment occurs because of mismatches between the current skills possessed and skills demanded in a given place or due to legal or regulatory limitations. Binding minimum wages have been a smaller factor in the last 40 years but may have greater impact in the future. Regulatory requirements for professional licensing have increased significantly in the last 50 years (with some “liberalization” seen in recent years), slowing the ability for individuals to move between professions.

The overall labor force participation rate increased for many years as women entered the workforce, but has declined significantly in the last 20 years for men and for women. I’ll provide a detailed analysis of these factors next week. For our purposes, focusing on short-term changes, recent history shows that the labor force participation rate can be 1-2% higher overall. Some workers have not returned from the pandemic challenges. Some early retirees may return to the labor force. Teens and college students may join the labor force at recent wage rates. Marginal groups (elderly, long-term unemployed, handicapped, drug/alcohol recovery, crime history, minorities, limited language skills, inexperienced) may be considered for more positions.

https://fred.stlouisfed.org/series/LNU01300060

The media tends to emphasize the increased specialization and technical content required for modern jobs. This has resulted in greater structural unemployment, especially among lower-skilled individuals who held and lost manufacturing jobs between 1970-2000. It has also reduced movement between industries which require a core base of knowledge to be effective, with health care being a prime example.

On the other hand, modern corporations that worked through a dozen post-WW II business cycles eventually adapting to the “business cycle”. First, based on Japanese manufacturing, TQM or lean six sigma manufacturing principles, they reduced their operating leverage. Companies devised factories, offices, distribution centers, product lines and national businesses that could be equally profitable from 70-95% of capacity, rather than 85-95% of capacity. Second, they reduced their unavoidable “fixed costs” by importing goods, outsourcing business functions (manufacturing, IT, accounting, legal, marketing, distribution, sales, R&D) and employing temporary labor. Third, businesses systematized their processes so that core production processes could be operated by individuals with limited specialized or tribal knowledge, including managers and support staff. Fourth, businesses increasingly used matrix and project structures to effectively redeploy staff to any areas of need. So, while variable production staff is a smaller share of employment, the remaining “fixed cost” support staff can be more flexibly deployed. Fifth, after 40 years of process re-engineering, data warehouses, activity based costing and balanced scorecard reporting, companies deeply understand variable costs and incremental benefits driven by sales, production, product lines, facilities, territories and projects. “Knee-jerk” reactions to business cycle downturns are less common as firms better understand short-term incremental profits and medium-term costs of hiring and training. Sixth, firms have improved their ability to define “critical success factors” for every position. This has eliminated many irrelevant experience, degree, culture, personality and other factors from hiring screens. Seventh, firms have increasingly rotated staff through line and staff roles, allowing talented individuals to move between these roles and function effectively. Eighth, firms are more strategically oriented, growing profitable product lines and territories and dropping or “selling off” marginal channels. This means that the incremental positive value of most positions persists, even in an economic downturn.

Overall, firms have learned their “applied intermediate microeconomics” and clearly defined the marginal benefits and costs of every position. They understand exactly what incremental profit can be delivered from each position. Hence, the demand for labor services is significantly greater than it was historically, including through the downside of the business cycle. That means that the natural unemployment level is lower than in the past. Firms can profitably put more people to work than ever before.

Economists, Forecasters and Pundits are Reluctant to Predict Unemployment Below 3% Because it Was Rare Historically.

https://www.reuters.com/business/feds-bullard-says-unemployment-rate-can-go-below-3-this-year-2022-02-01/

https://www.economist.com/the-economist-explains/2017/09/22/how-low-can-unemployment-go

https://www.cnn.com/2021/11/15/economy/unemployment-rate-goldman-sachs/index.html

https://www.federalreserve.gov/faqs/economy_14424.htm

https://theweek.com/articles/696915/how-low-unemployment

Lobbyists, Journalists, Politicians and Analysts Highlight the Downsides to “Very Low” Unemployment

From a firm’s perspective, a low unemployment labor market causes increased recruiting, hiring and training costs. It results in less well-matched staff to job roles resulting in lower initial productivity. Companies might even, aghast, inadvertently hire some staff with marginally negative profit results. Hence, very low unemployment rates will increase labor costs, reduce profits, reduce demand for labor and possibly bankrupt previously functional firms.

https://www.investopedia.com/insights/downside-low-unemployment/

https://www.imf.org/external/pubs/ft/fandd/basics/32-unemployment.htm

https://www.uschamber.com/economy/the-divide-between-job-openings-and-willing-workers-widens

https://www.umassglobal.edu/news-and-events/blog/low-unemployment-rates

Trade-off Between Unemployment and Inflation: The Phillips Curve

In the 1970’s fight between Keynesians and Monetarists/Classical Economists/Rational Expectations teams, the Keynesians emphasized the historical existence of a short-term trade-off between unemployment and inflation, especially when unemployment was very low due to a high level of aggregate demand. The conservative side noted that the historical data was inconsistent. The “rational expectations” camp emphasized that unexpected increases in inflation would lead to increased wage demands by labor. In the long-run, there is no such thing as a “free lunch”, so effective real wages would return to the level determined by the “marginal productivity of labor”. Based on recent data (pre-pandemic), it appears that the US economy can run at 3.5-4.0% unemployment without triggering significant upward wage pressures. In the post-pandemic world, the “natural” unemployment rate (NAIRU) is unclear. The labor supply has basically recovered to the pre-pandemic level. Wages are up 5% in nominal terms but are down 2% in real terms (see below).

There are Many Unemployment Measures. They Move Together.

https://www.brookings.edu/blog/up-front/2021/02/18/what-does-the-unemployment-rate-measure/
https://www.richmondfed.org/research/national_economy/non_employment_index

Labor Market Slack

In a period of healthy economic growth, the economy is constrained by the limited availability of labor as an input to drive the economic engine.

https://www.richmondfed.org/research/national_economy/non_employment_index

Underemployed individuals provide the logical next best full-time employees. The current slack measure is 3.5%, (7.1% – 3.6%) on the low side, but not so low that conversions from this underemployed group to full-time employment cannot be expected.

Real Wage Rates in a Growing Economy

https://fred.stlouisfed.org/series/CES0500000003
https://fred.stlouisfed.org/series/CPIAUCSL

Jun, 2020 – Jun 2022. Nominal wages up 4.7%/year. CPI up 6.1%. 1.4% real wage decrease.

Dec, 2020 – Dec, 2021. Nominal wages up 4.9%. CPI up 7.3%. 2.4% real wage decrease.

May, 2021 – May, 2022. Nominal wages up 5.2%. CPI up 7.9%. 2.7% real wage decrease.

Nominal wage rates have increased by 5% annually in a period of 7% inflation. Employers have been able to economically justify these increases while adding 7 million people to the labor force.

Beveridge Curve: Job Openings Versus Unemployment Rate.

https://www.bls.gov/opub/ted/2014/ted_20140513.htm

https://www.richmondfed.org/publications/research/economic_brief/2021/eb_21-36

Historically, there was a well-defined relationship between the national level of job openings as a percent of the labor force and the unemployment rate. Job openings were a low 2-2.5% of the labor force at the beginning of the business cycle, accompanied by higher (6-10%) unemployment, but improved to 4% openings and 4% unemployment. The current labor market has far more job openings, up to 11 million, almost twice as many job openings as unemployed workers, but the unemployment rate has only fallen to 3.6% so far. This is uncharted territory. There are more voluntary quits, so employees are switching jobs at a faster rate. The labor force participation rate has increased with these jobs and higher wages offered. But firms have not found enough acceptable hiring matches to significantly reduce the open positions level. Through time, they are likely to achieve their hiring goals, driving the unemployment rate down below 3%.

https://numbernomics.com/unemployment-vs-job-openings-2/

Summary

  1. The demand for labor already exists. 11 million open positions is 7% of the labor force. We have enough active demand for ZERO % unemployment.
  2. The supply of labor increased by 7 million people since the depths of the pandemic. The rate of monthly additions has slowed from 500-600,000 to 300,000, but that is still 3.6 million jobs added on an annual basis. We only have 6 million total people unemployed!

3. The labor force participation rate is only 62.5%. There is room for millions to return to the labor market. Before the “Great Recession” in 2008 it was at 67%. Many metro areas, large and small, enjoy labor force participation rates above 65%.

4. The underemployed population can provide up to 3% of the total labor market’s full-time jobs.

5. Frictional unemployment is minimal in the internet age. Structural unemployment may be lower than described in the media, as firms have been adapting to the “information age”, high technology and the service economy for 40-50 years.

Finally, many states and metro areas currently have unemployment rates in the “twos”. Nebraska and Utah stand at 1.9%. Minneapolis (1.5%), Birmingham (1.9%) and Indianapolis (2.0%) demonstrate that otherwise unremarkable (!!!) metro areas can function with very low unemployment rates.