9 States Reached All-Time Record Low Unemployment Rates in February
Nebraska, Utah, Indiana, Kansas, Arkansas, Mississippi, Montana, Oklahoma and West Virginia. The Republican leaning states are “winning”. The Bureau of Labor Statistics (BLS) has been reporting state data since 1976, so this is a GREAT result.
27 states reported unemployment rates below the optimistic “full employment” level of 4%. Another 17 were in the 4.0-4.9% range. Just 6 states were burdened with unemployment rates above 5.0%, with New Mexico at 5.6% the highest.
As with the states, the distribution of results for the 51 metro areas with 1 million + populations is quite convincing. 8 metro areas are below the “unsustainable” 3.0% gold standard. 29 metro areas are below the 4.0% “full employment” level. 43 metro areas are below 5%. 8 areas exceed 5%. Detroit is second worst at 5.4%. Cleveland is in last place, struggling with 6.4%.
Unemployment Rate Will Fall: Blue State Employee Returns From Covid Have Lagged
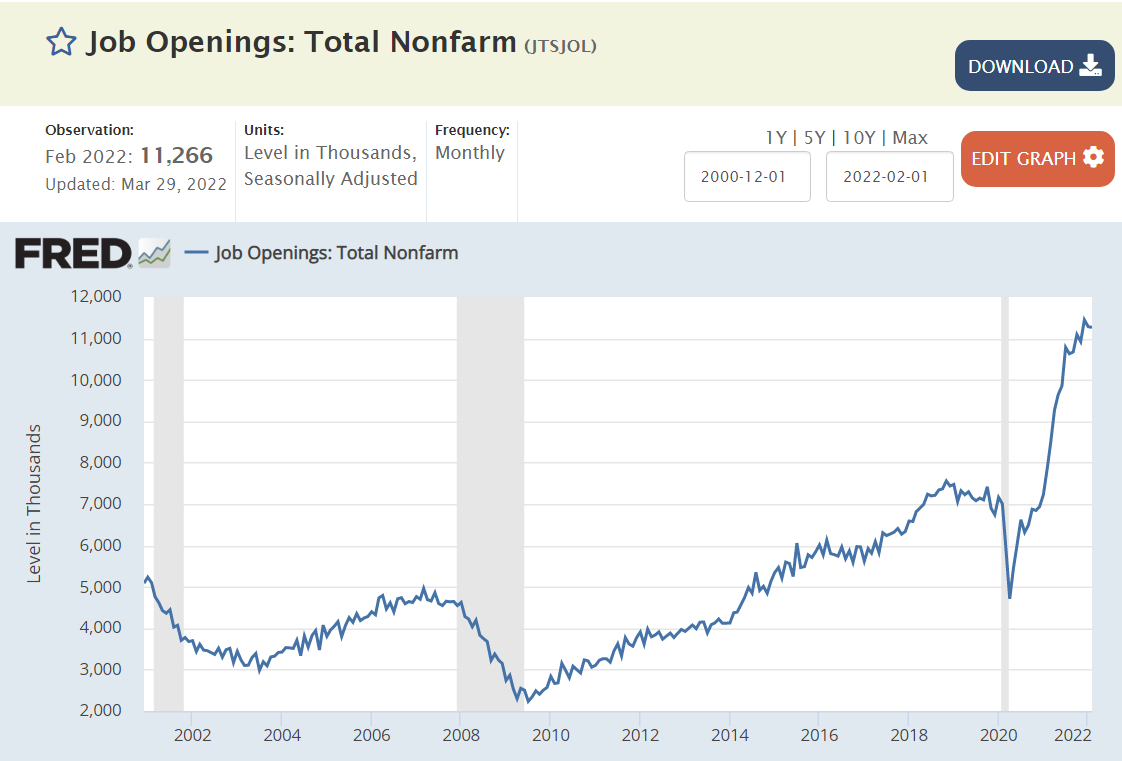
Red states have roughly returned to pre-Covid employment levels. Blue states have lagged by 3.5%. Mixed states have lagged by 2%. This can provide 3 million workers to fill some of the 11 million open jobs.
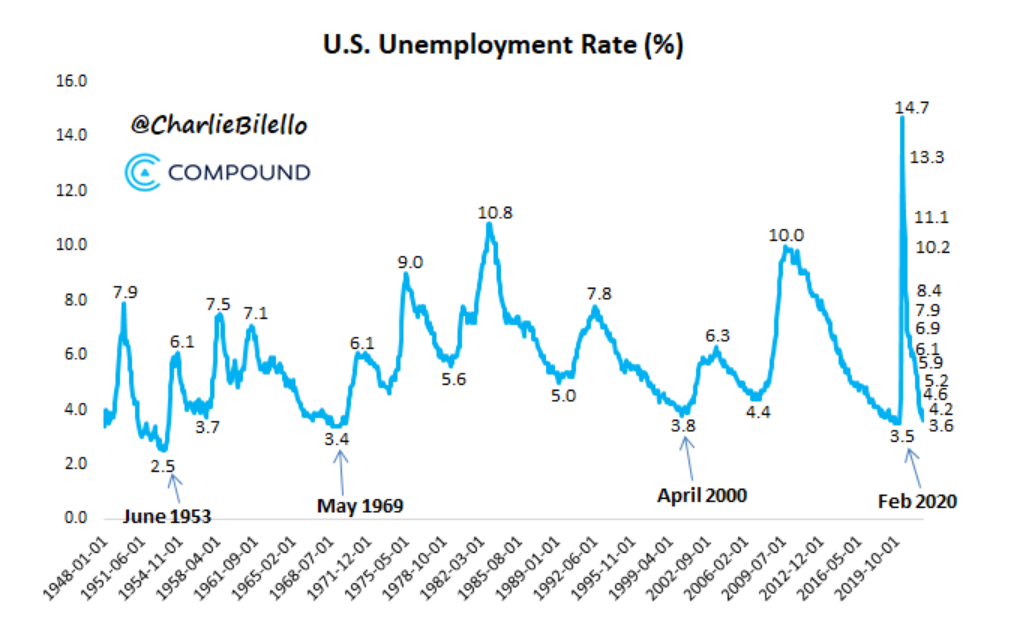
I expect the overall unemployment rate will set a 68-year record in the next 3 months. The February 2020 3.5% and May 1969 3.4% lows will be eclipsed! Unemployment will be at the lowest rate in my lifetime (Jul 1956)! This is despite the many, many issues and risks we have on both the supply and demand sides of the labor market.
IMHO, there are many factors driving this GREAT NEWS. (1) American firms are making record profits based on domestic and global demand, so they are incentivized to hire more workers, even at higher than usual wages. (2) American firms are finding that they can pay higher than historic wages and still generate incremental profits from the incremental workers (see Costco). (3) The definition of “employable” workers is clear, but employers are slowly loosening their irrational requirements (college degrees). (4) Baby Boomers have accumulated unprecedented retirement assets, so they have slowly left the labor force in a “one way” exit. (5) The “informal” labor market has been institutionalized with Uber, gig, contract and temporary worker arrangements. (6) Reduced unemployment benefits have incentivized many (older, less skilled non-unionized) unemployed workers to reduce their “reserve wage” expectations and accept new employment at lower wages than their best historical experience. (7) With less stigma for “laying off” workers, employers are more actively hiring workers to fill all economically justified positions. (8) With lower recent illegal immigration, the “reserve army” of the unemployed is lower. (9) Modern recruiting systems provide employers with so many candidates that they are assured of finding matching workers relatively quickly.
In essence, we have a much more “efficient” labor market than in years past, so the minimum unemployment rate has been reduced from 5% to perhaps as low as 2%. This too, is good news.
President Biden certainly did not drive any of the above structural factors. However, he has not disrupted these forces or pushed fiscal or monetary policy to undo the good news. Sometimes, “leave well enough alone” is all that is required.
At the height of the cold war, in the year on my birth (1956), Soviet First Secretary Nikita Khrushchev warned the US that “we will bury you”. Agriculture was still a very large share of the USSR and US economies. He couldn’t have been more wrong.
US statisticians have long separated the farm and nonfarm economies. A “census of agriculture” is conducted every 5 years to complement other economic statistics collected. The USDA Economic Research Service (ERS) does a great job of compiling statistics for the narrow (farming), moderate (fishing, timber) and broad (ag based production) agriculture industries.
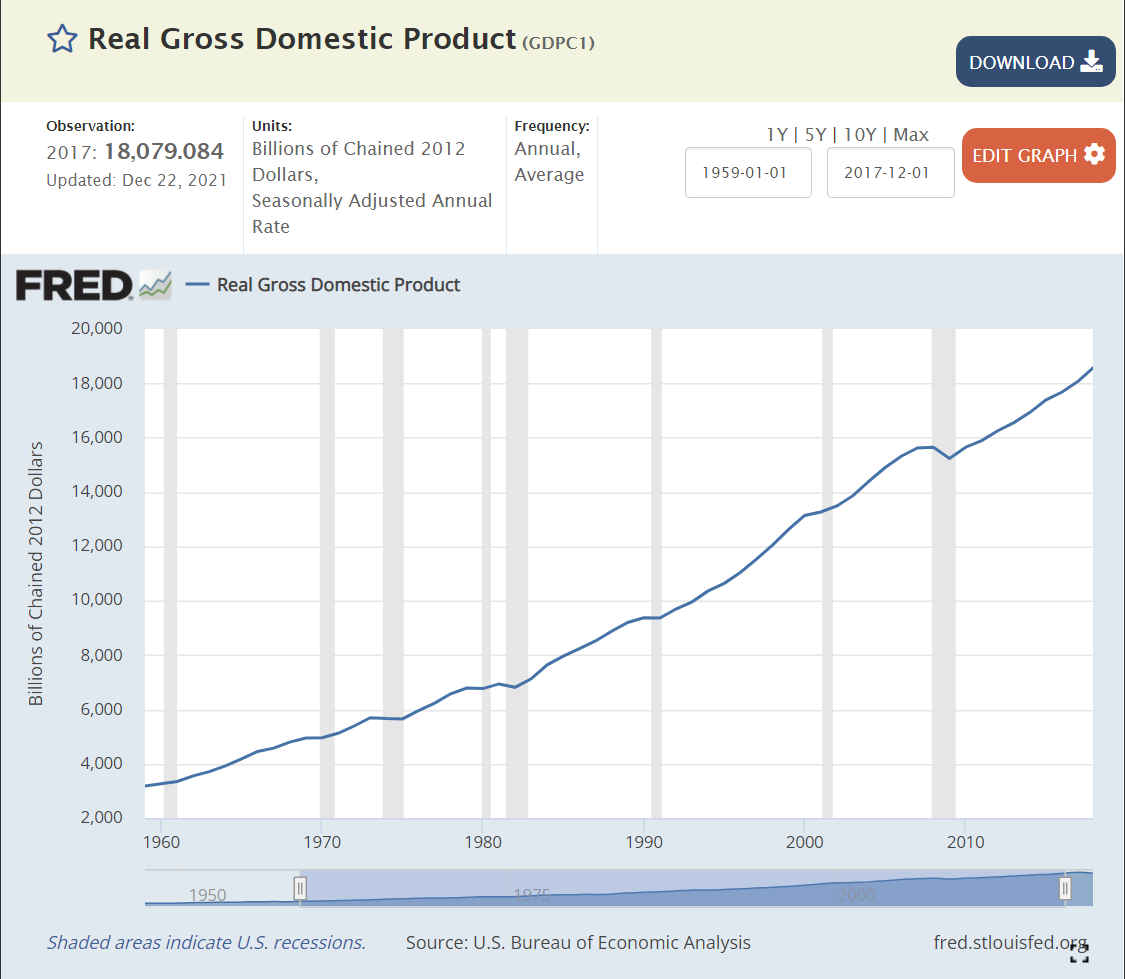
I’ve chosen to examine the near 60-year period from 1959-2017 covered by the censuses of agriculture. During this time, Real (inflation adjusted) US Gross Domestic Product (GDP), the value of all goods and services produced, increased from $3 to $18 trillion dollars, a near 6-fold increase, or 3% annually, year after year after year.
We don’t have an economic series that tracks wage and salary income back before 1979, but real disposable income per capita exists for this whole time period. This indicator or labor costs increased 3.4 times, from $12,600 to $42,900, or 2.1% annually. Given the strong growth of the US economy and its many new opportunities AND the increase in labor costs facing the oldest industry, one might have agreed with the Soviet premier back in 1956, at least regarding US agriculture. But, that prediction was wrong.
Index of Unit Outputs
The US agricultural economy grew to more than 2.5 times its 1959 base by 2017. It grew by 75% in the first 30 years and an additional 50% on top of that new base. The consistent pattern of growth is striking.
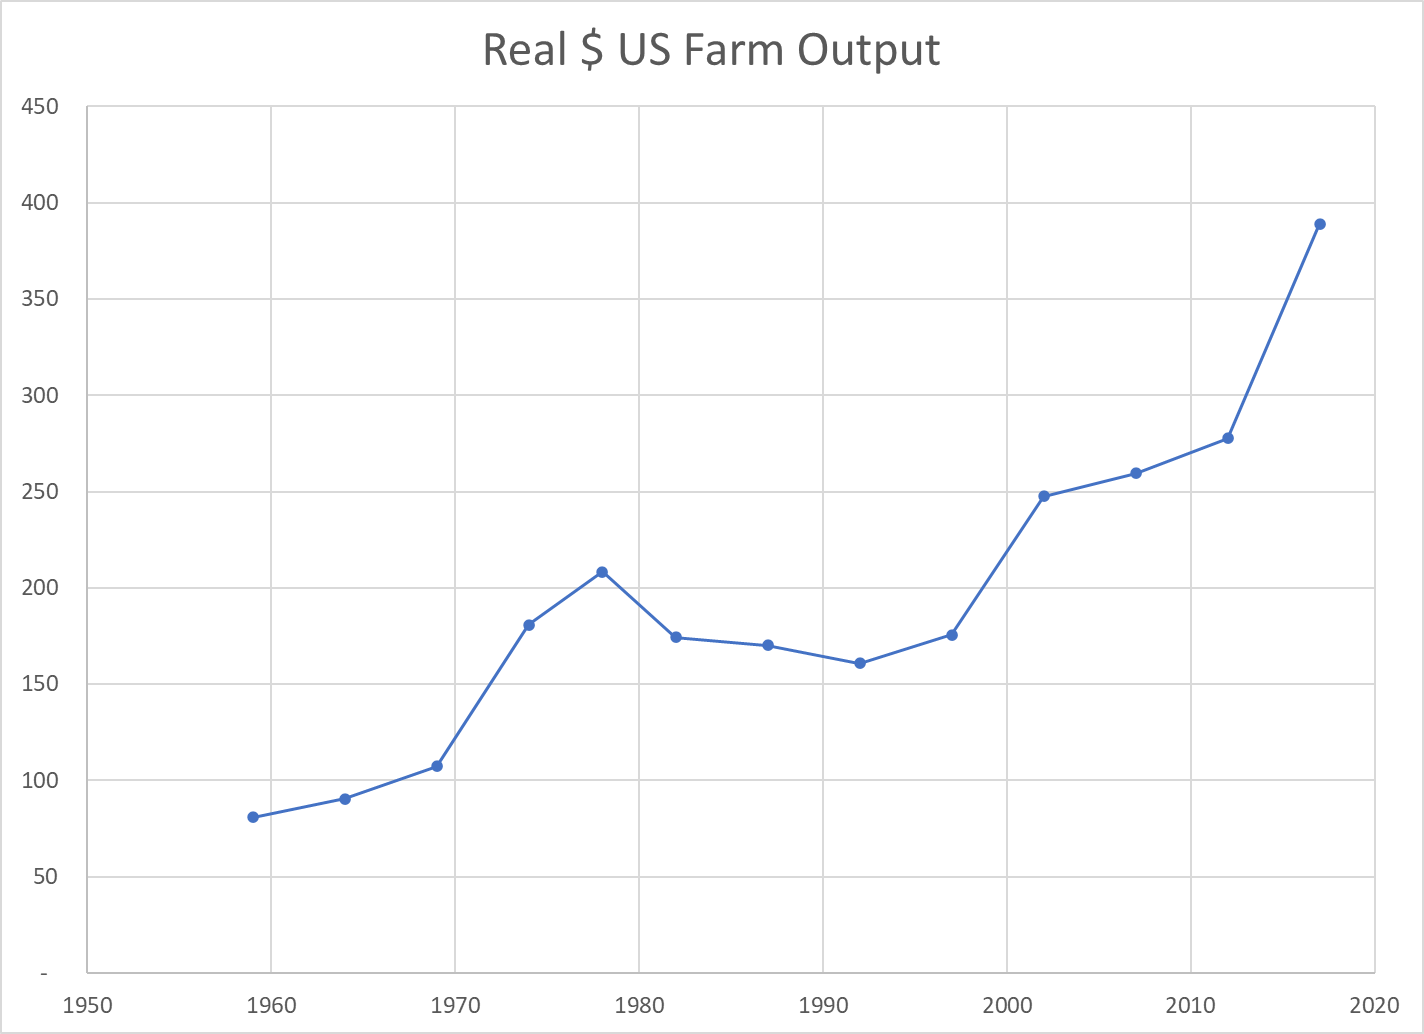
Real Market Value Produced
The Ag economy grew (based on variable market prices) 5-fold from $80B to $390B during these six decades, increasing by 110% in the first 30 years and a compounded 130% in the most recent 30 years.
Land Input (Acres)
The amount of land dedicated to production agriculture has decreased by 20% during our period of focus, from 1.1B to 0.9B. The decline was faster in the first 30 years (14%) than the second 30 years (7%). Despite this reduced demand for agricultural land, the value of such land has increased in real terms as its productivity has grown.
Labor Inputs FTE
The full-time equivalent labor force in the ag industry, as best as the USDA can measure it, dropped by nearly two-thirds in our six decades, from 2 million to about 700,000. It fell more rapidly in the first 30 years (50%), but a solid 25% in the most recent 30 years.
Total Factor Productivity
Economists try to measure land, labor and capital as inputs to the agricultural production process. As noted above, land and labor have declined. Capital – equipment, improvements, patents, inventory, etc. has increased. Overall, the total inputs have remained roughly flat for 60 years. Hence, almost ALL of the increased unit output is due to increases in productivity. Better crops, better labor skills, better processes, better methods, better irrigation, better crop rotation and selection, etc. Economists call this “total factor productivity”. After accounting for measurable increased inputs, the remaining improvement is called “productivity”.
The oldest industry in the world, increased its productivity in the US by 150% in these six decades; by two-thirds in the first 30 years and by one-half on the higher base in the second 30 years.
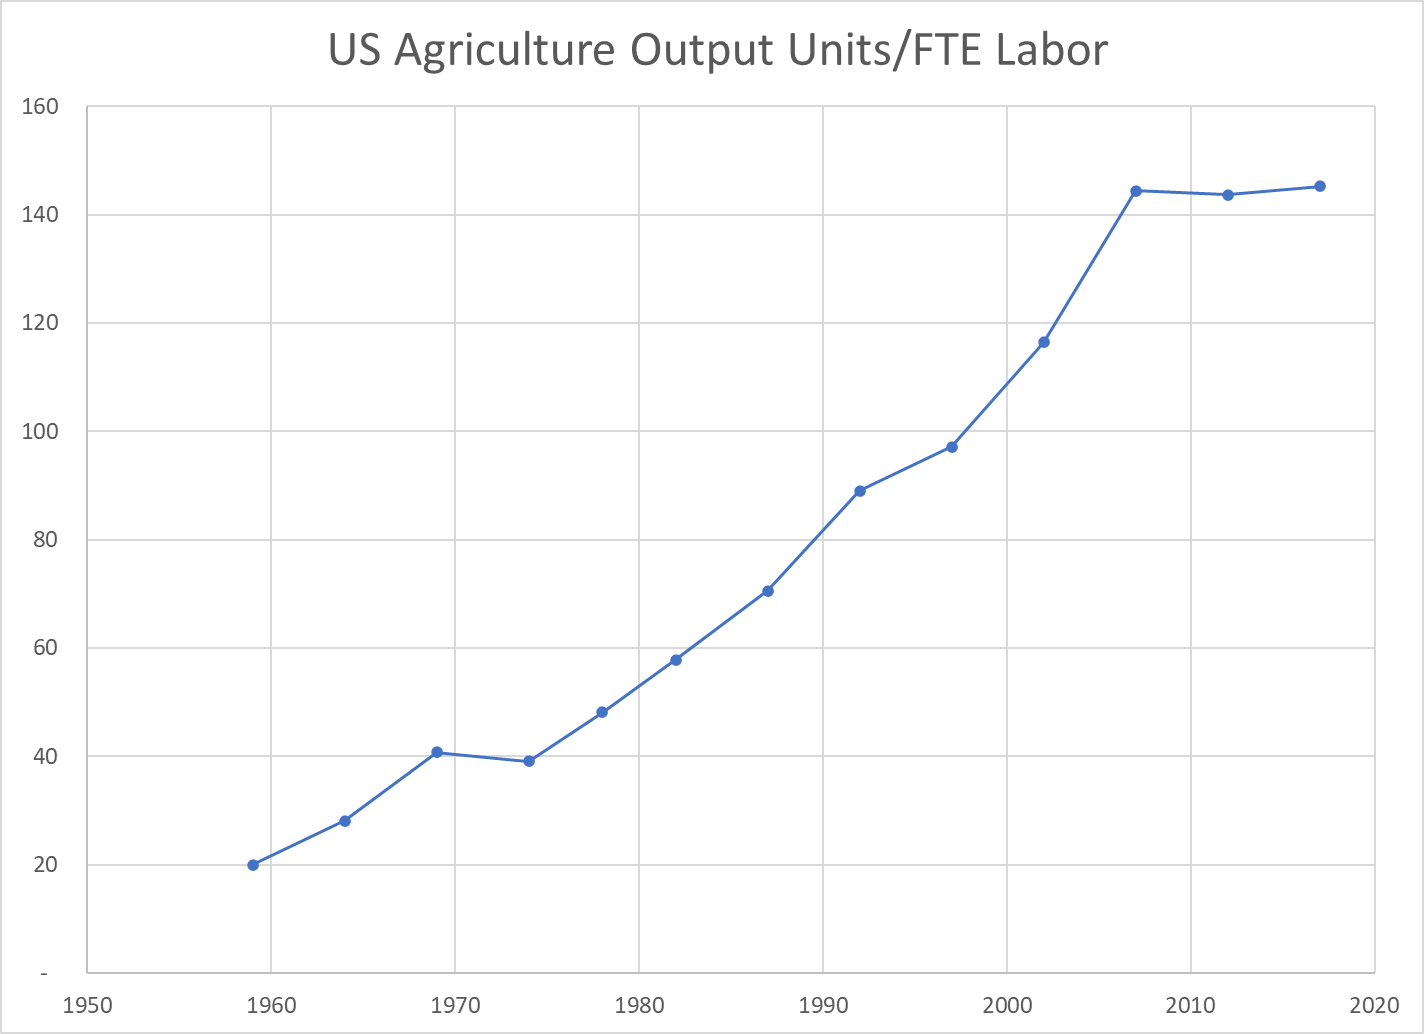
Output per Labor Unit (Labor Productivity)
The strong increase in production combined with the two-thirds reduction in FTE labor required resulted in a 7-fold measure of improved labor productivity. The land input was down by 20% and the capital input increased significantly, but in simple terms, each hour of labor in 2017 delivered 7 times as much output as the labor in 1959. The increase was 2.5x in the first 30 years and a solid 2x in the more recent 30 years.
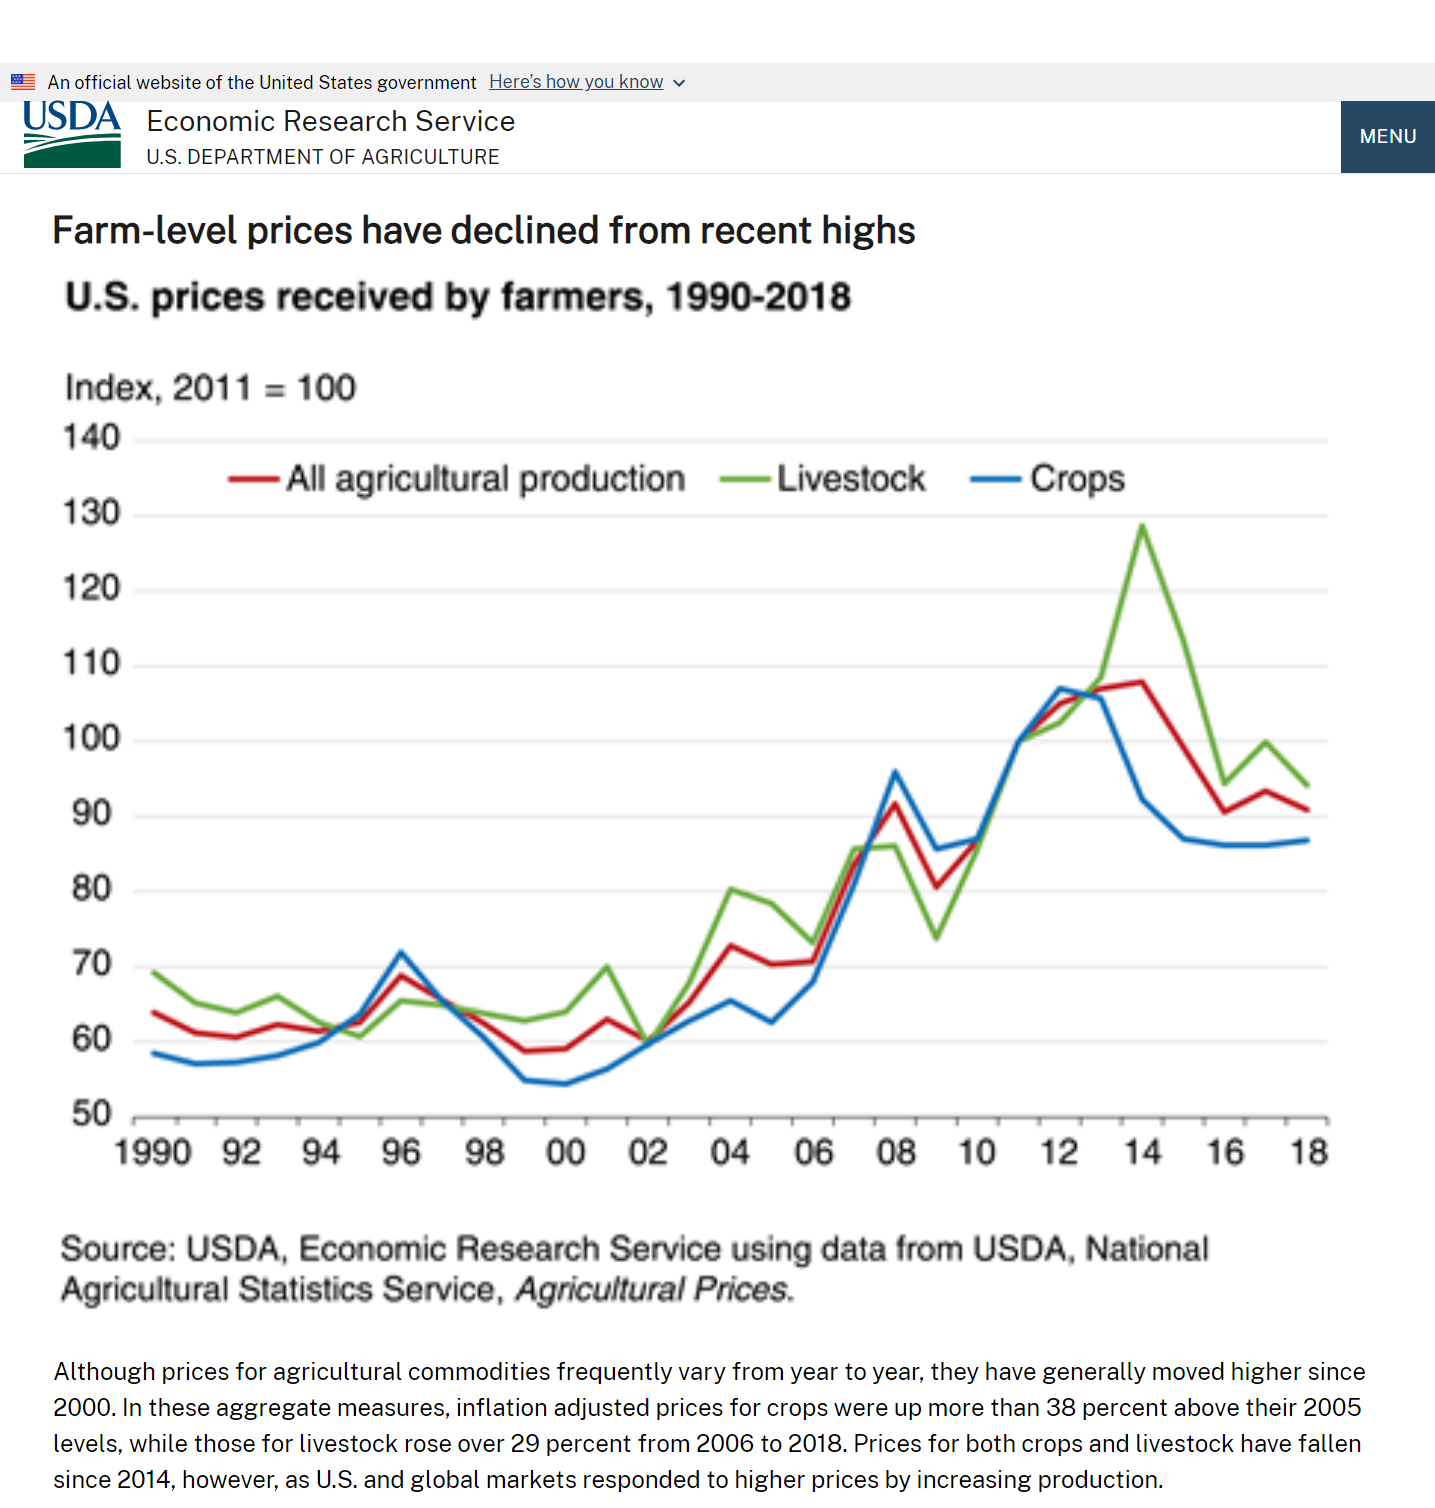
US Agriculture Output Price Index
The index of agricultural industry output prices has increased by 3-4x versus 8x for the consumer price index or GDP price index.
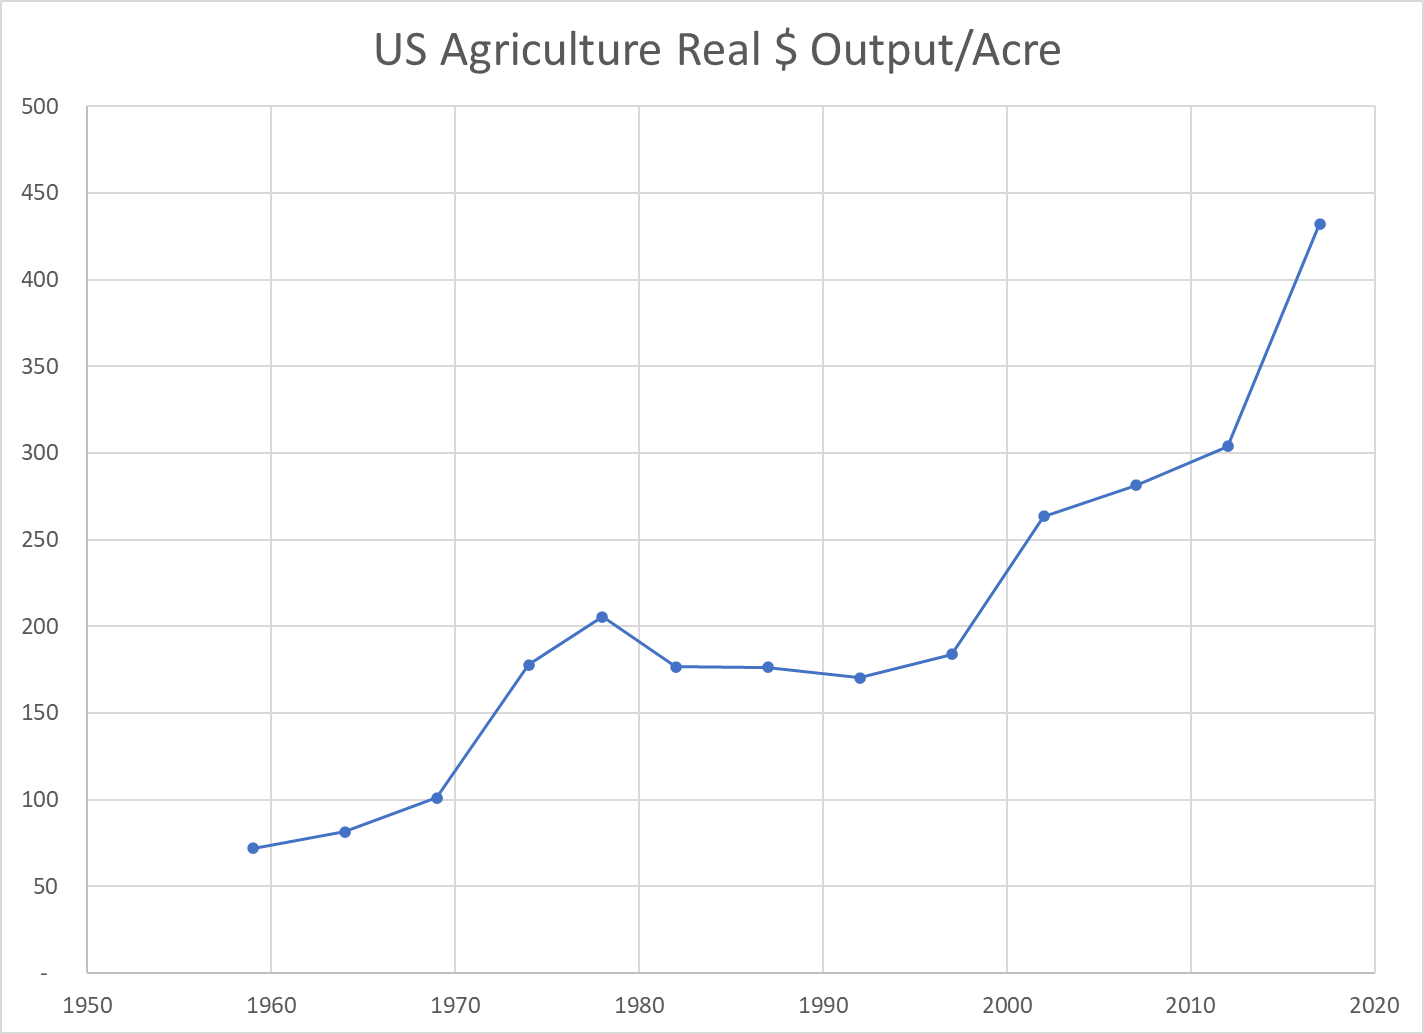
Real Market Value Produced Per Acre
The real market value of ag goods produced increased 5-fold. The land acres required declined by 20%. The output value per acre figure improved 6-fold. Again, labor inputs declined and capital inputs increased. This measure of land productivity improved by 150% in both of the first and second 30-year periods.
Real Agricultural Exports
Real ag exports increased 4-fold in these 6 decades, doubling in the first and second 30-year periods.
Summary
Less land and labor. More capital (equipment). Much better R&D and processes. Total factor productivity up by 150% across 6 decades, an average of 1.6% year after year after year.
The US ag industry faces many challenges today. Environmental issues and climate change. Water shortages. Lower public and private R&D investment. Brain drain. Political polarization. Concentration of key property rights. Low wage labor access. Changing trade rules. Nonetheless, the last 60 years indicates that this industry is capable of delivering further increases in production and productivity for the next 60 years.
Historically, economists generally emphasized the negative short-term and long-term impacts of significantly higher, broadly applied minimum wage increases. Studies in the 1990’s indicated that the negative effects of moderate minimum wage increases could be relatively small, so economists’ articles have been more balanced in the past 3 decades.
Some more liberal leaning economists have been actively suppporting minimum wage increases as the US minimum wage has continued to decline on a real, after inflation basis, US minimums have fallen compared with other developed countries and the US distribution of income has become more unequal and poverty rates have not fallen despite US economic progress.
Some economists even point to the self-serving benefits of higher minimum wages for corporations, including greater productivity, innovation and retention.
But, large corporations are increasing their own minimum wages and trying to position themselves as supportive of “common sense” public policy changes that do not impact themselves very much. Some critics say that this is because large corporations can absorb higher minimum wages through their economies of scale and pricing power, while smaller businesses cannot and will go out of business, resulting in further growth of power for large businesses.
Perhaps more importantly, large corporations in a variety of industries have voluntarily increased their minimum wages from the $12/hour to the $15/hour plus range in the last 2 years. (Out of self interest).
Wages for less skilled and less experienced positions are increasing – dramatically – in the USA – in the last 5 years, especially since the pandemic reduced the supply of labor, and going forward. Larger companies have seen the costs of higher turnover and decided that they are going to offer relatively higher wages and find ways to generate enough economic value added to justify these marginal (incremental) investments. Politicians in left-leaning and centrist areas have pushed through higher minimum wages. Lower experience and lower skilled workers are able to take advantage of this situation. This is “good news” for these individuals. It is also “good news” for the economy because it has prompted firms to find ways to restructure work, processes, tools, technology, etc. to add more value from each employee.
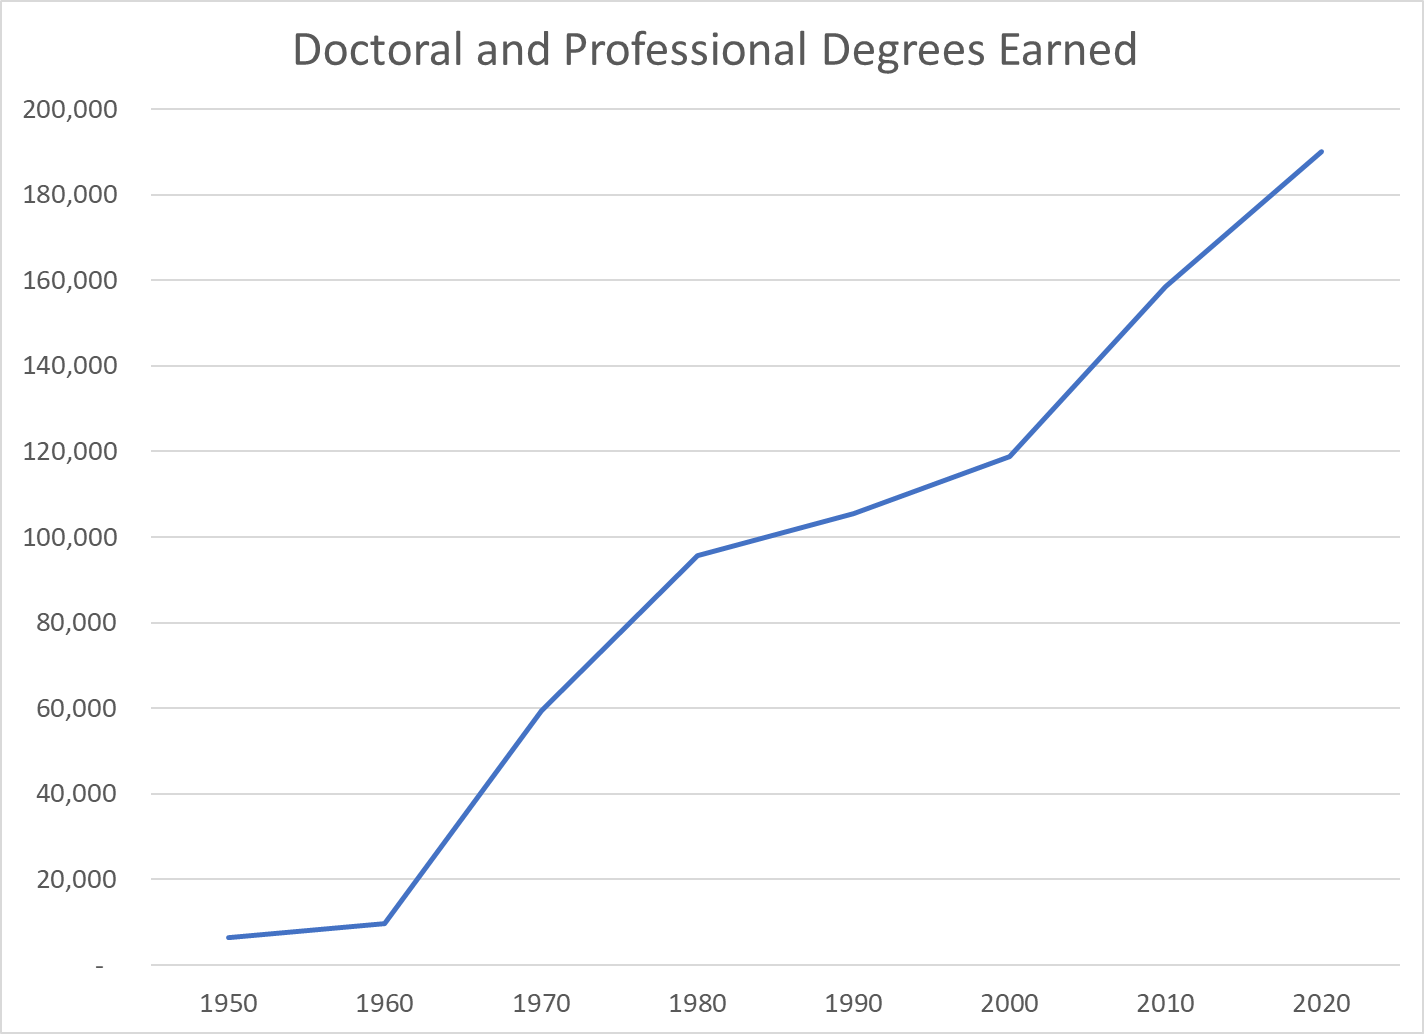
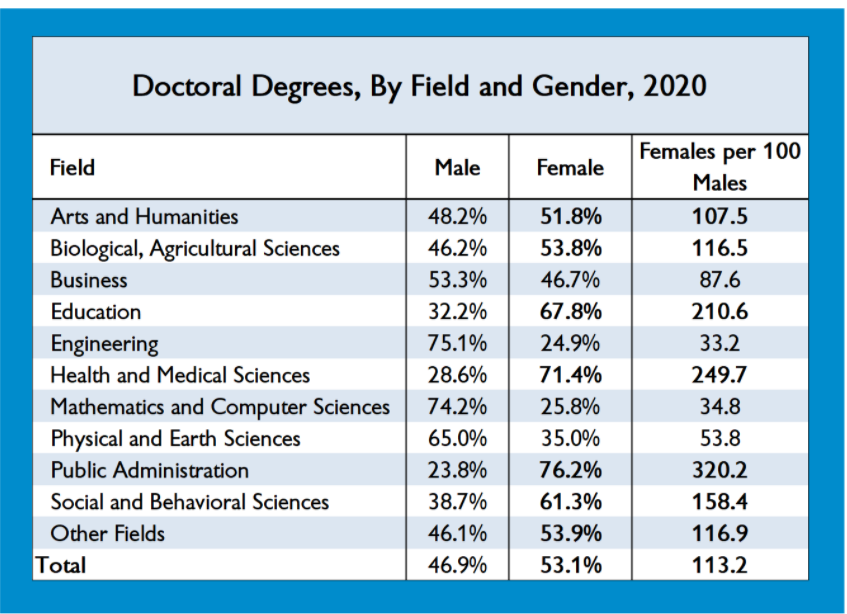
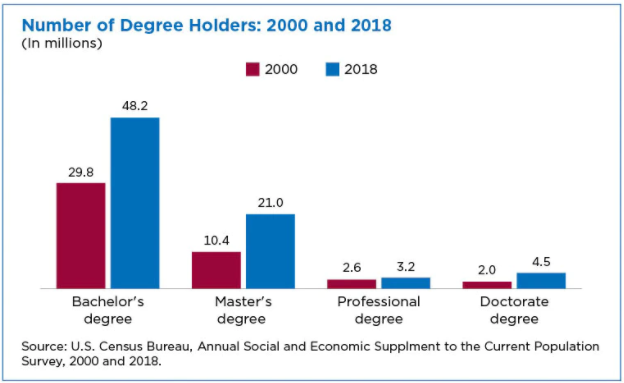
Since WWII, the US has increased college graduation rates overall 5-fold, from 6-8% to 39%. We now graduate 2 out of 5 individuals. We used to graduate 1 in 12 to 1 in 16.
Graduation rates have increased every decade, including a 7% increase, from 32% to 39% between 2010-2020. That increase is equal to the total college graduation rate after WWII!
Male graduation rates have increased more than 4-fold, from 7-10% to 35%.
Female graduation rates have increased 8-fold, from 5-6% to 44%.
African-Americans have increased their graduation rates 10-fold, from 2-3% to 28%. From 1 in 40 college graduates to 1 in 4.
Hispanic Americans were not tracked separately in the first 4 decades, but they have tripled from 8% to 25% in the last 40 years.
Critics can challenge the modern value/difficulty of a degree versus those after WWII. They can highlight the “pause” in 1980-1990 when degree attainment barely rose. They can note that male graduation rates paused from 1980-1990 and then again from 2000-2010. They can observe that men earned twice as many degrees in 1950-60, before being exceeded by women by 2000 and exceeded by 9% points, 44% to 35% (25% advantage) in 2020. They can point to the very rapid increase in degree attainment between 2010-2020 being suspiciously high. They can bemoan imperfect 4-year or 6-year graduation rates. They can note the financial challenges faced by college students, especially those with lower incomes or first generation attendance status.
However, even assuming that some good portion of these criticisms are appropriate and relevant, the overall results are clear. The U.S. is educating far more residents at a college graduation level. Men and women are benefitting. Minorities are improving their performance and have better access to higher education. Overall, this makes for a fairer society. It improves our ability to run a democratic form of government. It makes us a more economically competitive and creative society. Ideally, it allows more individuals to pursue their dreams, take advantage of their talents and contribute to the community.
One of the most depressing books was written in 1998. It argues that we are not genetically equipped to face the abstract thinking challenges of modern life. We have to make individual choices in all areas of life (parenting, religion , mates, ethics, groups, politics). We cannot simply rely upon our parents or culture. I think there is some relevant content in this work.
Robert Putnam’s works on “Bowling Alone” and “Our Kids” tell a similarly frightening story. We used to have a broad based commitment to community and ethical behavior, but we have lost our way, especially in the bottom half of the social structure.
Other research indicates that general intelligence (IQ) as measured by standardized testing has increased decade by decade in statistically significant amounts. Better diet, better schooling, better media, better home life, better chemical environments. The improvements are mainly in the bottom half of the scores. We’re not seeing twice as many 800 SAT scores. This is great news for these individuals and for society. IQ measures are imperfect. Intelligence is not closely correlated with ethics. Intelligence is only one part of problem solving. There are clearly multiple intelligences and talents that are useful. All people take shortcuts and make irrational decisions. But … an increase in basic intelligence scores and reasoning abilities is something to celebrate.
If you deeply believe in the primacy of the process paradigm, work to overhaul your organization’s structure.
Following the input-processing-output structure, oranizations should be organized to maximize cross-functional results. Five direct reports to the president. Perhaps a sixth direct report managing the functional specialist areas of design engineering, marketing, sales, process engineering, HR, finance, accounting, operations, quality, customer service, purchasing, IT, etc as support functions.
1. Organizational strategy (I, P and O): planning, analysis and control. Finance/accounting, quality and strategy folks build the superstructre of long-term strategic plans, business unit reporting, value added, How does the overall system work effectively?
2. Supply chain management (I). Purchasing, scheduling, materials control, distribution, logistics team adopts a strategic view incorporating the needs of product development, engineering design, manufacturing, purchasing, marketing, sales, and operations.
3. Customer Management (O). Sales, marketing, customer service and technical service in every market.
4. Product management (P). Product managers supported by marketing and engineering.
Note that each of these 5 areas requires cross-functional experience and understanding. We are 236 years past Adam Smith’s writings about functional specialization and 175 years past David Ricardo’s deep insights regarding comparative advantage. Darwin posited the process paradigm for natural events 150 years ago. Dr. Deming promoted this view 60 years ago for manufacturing.
CP Snow outlined the different worldviews of scientists and humanities majors in 1959, but he could have been describing the different worldviews of all professions. Breaking through to see the bigger or contrasting picture is the most important insight.
Apologies to Richard Nixon for paraphrasing his famous Keynesian quote.
Two years after starting a mid-career search, I remain impressed by the greatly increased emphasis on perfectly matching an individual’s professional and industrial experience to an open position. Hiring managers, recruiters and HR managers have all adopted this approach. This is partly because of the abundance of candidates and partly due to the risk averse environment caused by the slow economic recovery. It is also due to the improved results of the “fill the bucket” approach to hiring where specific requirements are listed and then proven from actual experience and multiple interview responses.
However, I think there is something deeper involved. Professional and industry specialization has continued to increase through time. The discussion of outsourcing, virtual project teams and individual agents has died down, but these innovations have become a growing reality. Successful firms increasingly focus on smaller niches of product, geography and comparative advantage. Increased industrial and professional fragmentation is required for success. The trend will continue.
How did I miss this? As usual, paradigms act as blinders. In high school in the 1970’s I was taught it was important to be “well rounded”. At a liberal arts college, I learned that great minds and thoughts were academic, abstract and universal. In business school, I learned that an MBA provided the necessary skills for a lifetime of career success. I later discovered the competitive advantages of being a “general manager” from John Kotter’s influential work.
My teachers were correct in promoting the personal and professional value in developing broad knowledge, thinking skills and a professional base. They did not foresee the modern world of global competition, where firms are forced to specialize and make economically rational decisions far beyond those envisioned by Adam Smith and David Ricardo who outlined these principles long ago.
“General Managers” are now merely a declining specialization. Some top-end MBAs with broad consulting experience can move from industry to industry and be successful. A few individuals can specialize as “strategic advisors” to presidents. But even in these fields, the trend is toward specialization. Firms will pay for experts in a narrow tax, legal, technical or IT field only when in-house experts do not exist or others cannot complete a project well enough.
Professional services firms have always paid lip-service to industry focus. In the last two decades, led by IT firms, they now specialized by industry and technology equally. Clients expect staff to understand their business.
Industrial and professional specialization will be required for future employment. Individuals, firms and universities will adapt to survive.