A Dozen False Claims of Journalists, Analysts and Pundits
Job growth is too slow, there are not enough jobs.
All of the good jobs are gone, there are fewer good jobs.
The only growth has been in “low wage”, service jobs.
There are no “blue collar” jobs, no “hands-on” work is available today.
Jobs are all “dumbed down”, no real content remains.
Automation, computers and artificial intelligence are eliminating all jobs.
There is no room for advancement at work.
The economy is inherently stagnant, firms are unable to create new positions.
We’ve become a nation of shopkeepers.
There’s no hope for millennials in the job market, Boomers are leaving a disaster.
More and more jobs are subject to the “imposter syndrome”, they really do nothing.
This time is different, we have reached the “end times” for jobs.
The Data Says …
The US Census Bureau and the US Bureau of Labor Statistics attempt to measure the detailed occupations in the evolving US labor market. I have selected 1970 as a baseline because it is effectively prior to the “computer revolution” and within my lifetime of observing the labor market. The US economy was still essentially in the post WWII boom period with manufacturing clearly the most important industry in 1970. Prior to Japanese or Chinese competition. Prior to the “energy crisis” and environmental concerns. Prior to improved social, political and economic opportunities for women, racial and other minorities.
We had 153 million people working in the US labor market in 2021.
https://www.bls.gov/cps/cpsaat11.htm
We had 75-77-79 million people working in 1970.
The total measures and the detailed measures are somewhat inconsistent between 1970 and 2021. But, they are adequate to make basic comparisons. The labor force doubled in 50 years. 75 million new jobs created! 15 million new jobs each decade. 1.5 million new jobs each year, on average.
The detailed occupation categories have also changed. The 500+ categories in 1970 are very different from 2021, but the basic measures are roughly consistent. I have mapped the 1970 categories onto the 2021 categories. In 1970, the “undefined” responses were in the 10% range and not reallocated back to the detailed occupations as is done currently. Self-employed individuals were measured differently. Managers and supervisors were measured differently. The current definitions are better aligned with the current jobs. The 1970 categories provided much more detail on the manufacturing sector.
Employment by Job Level

Total employment more than doubled.
The highest level “manager/supervisor” jobs category nearly tripled. 18 million manager/supervisor jobs were added between 1970 and 2021. In 1970, there were 10 million manager/supervisor jobs; 13%, or one out of every 8 positions. The newly added positions are 24% of the labor force in 1970. The 28 million current manager/supervisor roles are 37% of the total 1970 work force. Opportunity, indeed. In 2021 terms, manager/supervisor roles are 18% of the work force, more than one of every six positions.
Professional jobs (college degree plus required) also tripled, growing from 14 to 41 million, an increase of 27 million new jobs. This increase is 36% of the 1970 work force. The manager, supervisor, professional subtotal is 23 million in 1970 (31% of the total). It has grown to 69 million (3X) in 2021, reaching 45% of the labor force. The number of “premium” jobs tripled, while the share of “premium” jobs increased by almost 50% in this half-century. Good news, indeed.
“Skilled” labor jobs were flat across 50 years, declining as a share of total jobs by one-half, from 10% to 5% of the economy. However, their neighbor, technical jobs, increased faster than the economy, adding 10 million high quality positions. The combined skilled labor (trades) and technician/technical level positions increased from 15 to 25 million, overall. This two-thirds growth is slower than the overall labor market’s doubling. Hence, this job level decreased from 20% to 16%, or from one in five to one in six positions. This is a “glass half-full or half-empty” situation. The 14% of the total labor market growth for premium positions is offset by a 4% decline in middle skilled positions, resulting in a 10% increase of combined middle and premium positions as a percentage of the total.
Lower skill level jobs accounted for nearly half of all jobs in 1970; 37 of 75 million. They comprised a decreased 39% of the total in 2021, 59 million out of 153 million. A smaller share of “lower skill” jobs seems like progress. Yet, even here, we have a growing labor market, with 59 million jobs in 2021 versus just 37 million jobs in 1970; 50% more.
The “physical labor” category grew from 22 to 32 million jobs, but it declined from 30% to 21% of the work force. Relatively fewer jobs, absolutely more. The clerical workforce encountered a similar, but less extreme change, growing from 11 to 15 million jobs, but declining from 14% to 10% of the work force. The “service sector” grew twice as fast as the overall economy, increasing from 4 to 12 million jobs and from 6% to 8% of all jobs. The “service sector” is growing disproportionately, but it is a relatively small part of the overall economy, just 8% of the total in 2021.
In total, the lower skilled clerical, labor and service groups combined, grew from 37 million to 59 million positions, but declined from 49% to 39% of all jobs. I see this as progress and look forward to the next half century reducing this category to just 30% of all US jobs.

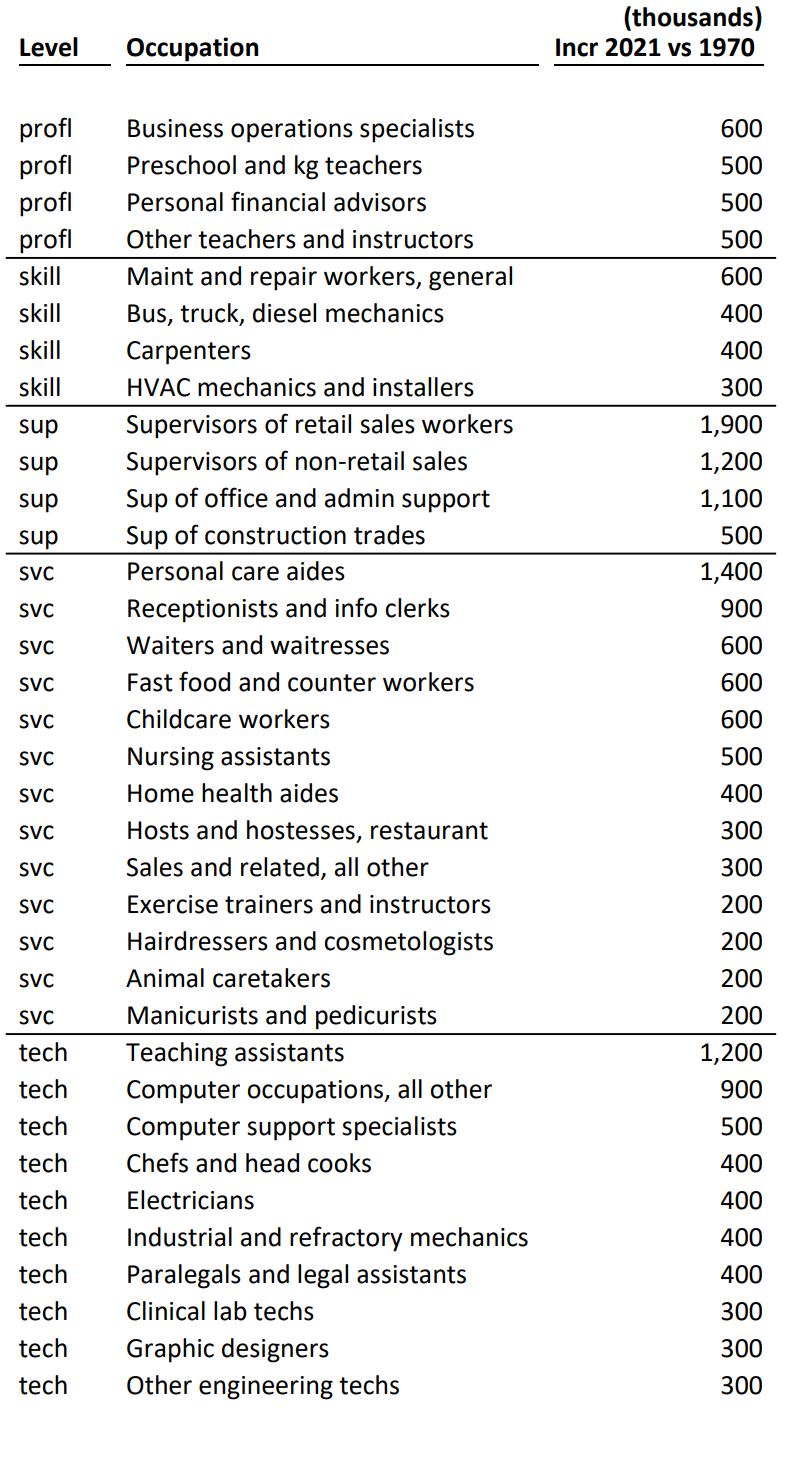
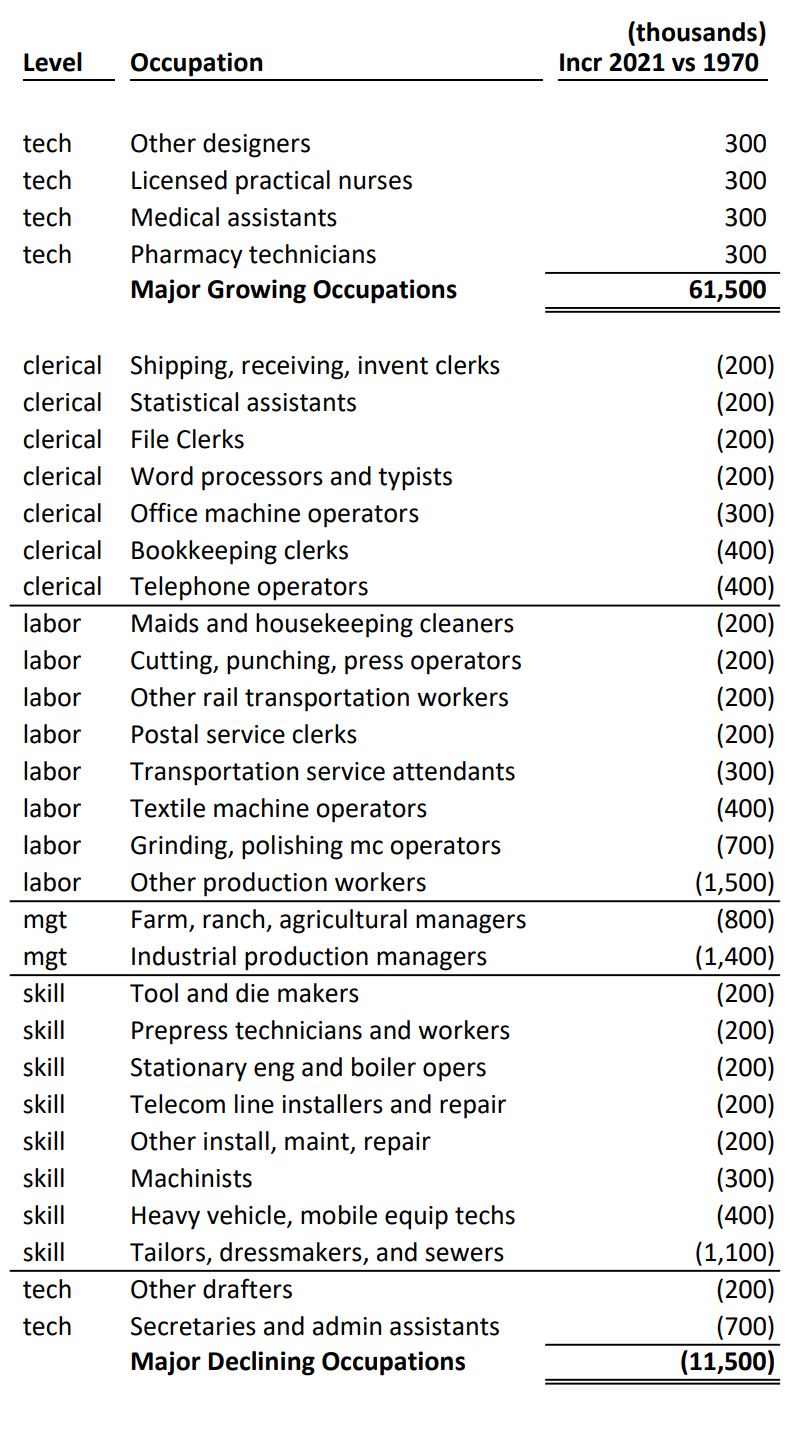
At the detailed level, we have 70 occupations driving 62 million new jobs, 82% of the 1970 base. We also have 27 occupations experiencing a 12 million jobs loss, 15% of the 1970 base. Joseph Schumpeter’s “creative destruction” model of a dynamic economy is validated. Changes in demand and technology eliminated 12 million jobs, 15% of the total, across 50 years. The US economy is capable of permanently destroying and replacing a quarter million positions each year, about one-fifth to one-third of one percent of total employment.
Let’s go back to the dozen negative claims. Is there support in the details? Are there “good” jobs being destroyed? I only see declines due to “natural causes”: improved IT, telecom, process/quality/manufacturing, international trade, railroad, textile automation/imports, ag productivity, printing and DIY office options.
On the upside, what do we see? Management and supervisor roles growing in all areas in a more complex environment with higher sales volume, more products, faster product introduction, more exports, more outsourcing of functions, greater customer demands in all dimensions, global sourcing and competition.
Technology supplemented/infused positions at all levels. Cashiers, customer service reps, distribution employees, tellers and drivers today leverage IT systems and processes.
Increased specialization/technical skill in many service/technical areas. Retail terminals. WMS. HRIS. EDI. Customer service scripts. Web based transactions.
Increased professional skills, sophistication and impact in all areas.
More professional teachers, nurses, analysts, accountants, lawyers, HR, real estate and financial advisors.
Diverse technical computer, automation, lab, design, legal, teaching, culinary and design technical positions.
More medical, food service and personal care service roles.
Summary
In the last 50 years the US labor market has doubled in size and added an increasing share of managerial/professional/technical positions.
In my next blog, I’ll focus on the next level of detail: 17 categories of the US labor market.