Good News: US Death Rates Cut in Half From 1960-2019

https://www.cdc.gov/nchs/data/nvsr/nvsr70/nvsr70-08-508.pdf

https://www.cdc.gov/nchs/products/nvsr.htm

https://www.infoplease.com/us/health-statistics/deaths-major-causes-1960-2011

Heart Disease Deaths Down 2/3rds

Cancer Deaths Down 1/4th

Strokes Down 3/4ths

Accidents Down 1/6th

Flu + Pneumonia Down 2/3rds

Liver Disease Deaths Down 1/3rd

Diabetes Deaths Flat

Suicide Deaths Flat / Up 5%

Chronic Respiratory Diseases Up 2X, 20/100K

Alzheimer’s Disease Up 2X (reporting issues), 20/100K

Kidney Disease Up 2X; 7/100K

Blood Diseases Up 2X: 1/100K

Deaths from Top 12 Causes Cut in Half

Good News: Urban America is Growing Very Nicely

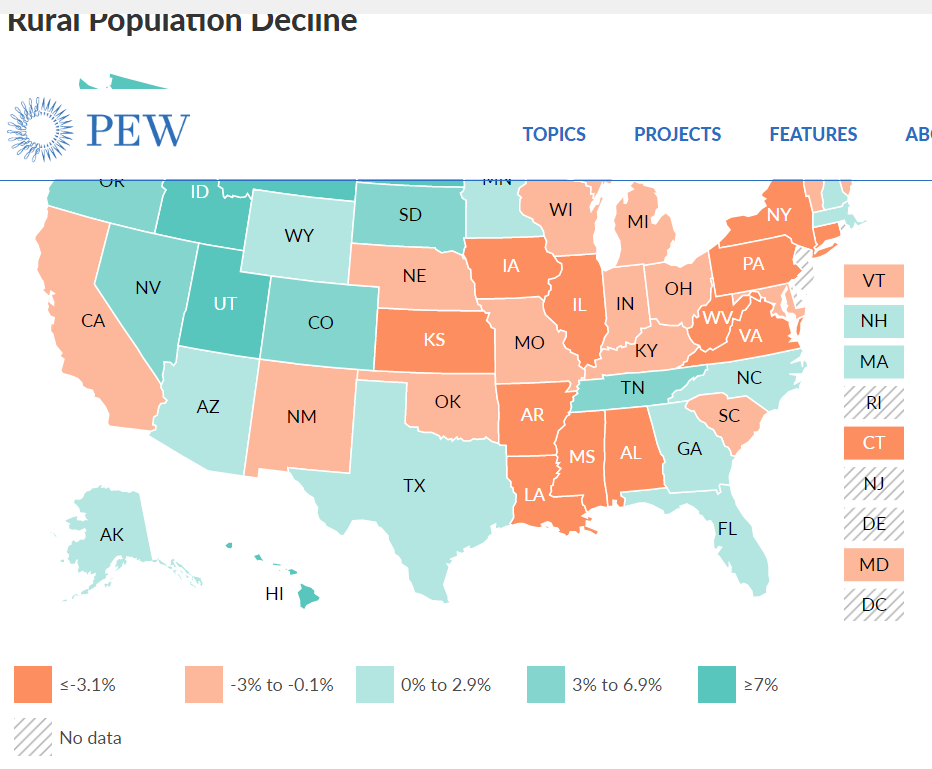
Rural America Grew Very Slowly in the 20th Century, Flattened and May Now be Declining

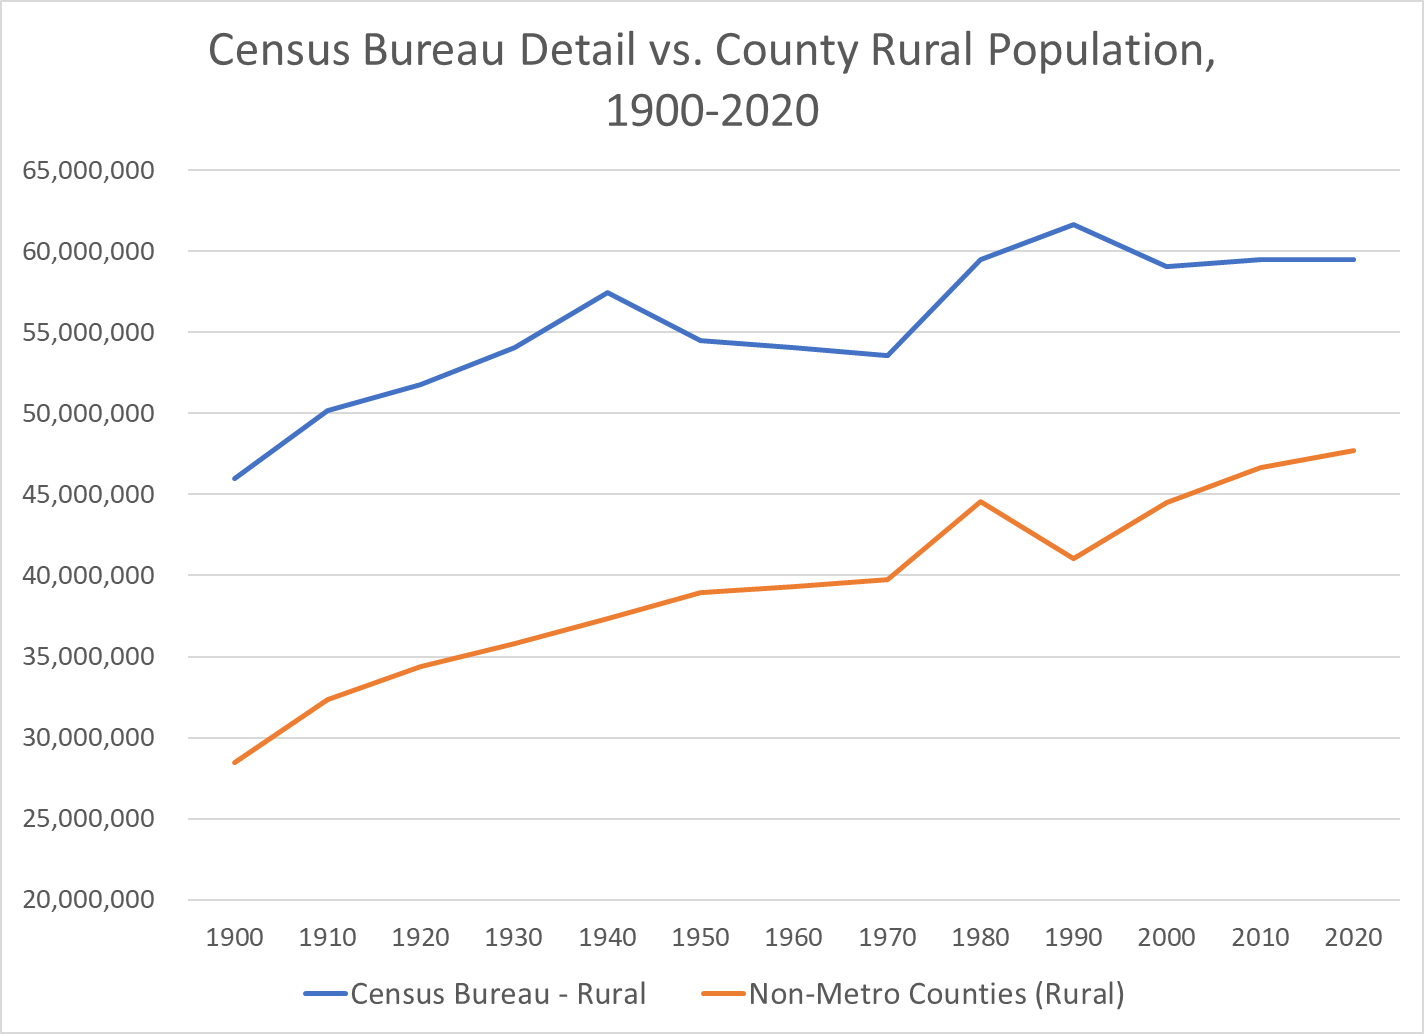
There are a variety of measures of “rural” US population. The Census Bureau has used local populations of 2,500+ to define urban. It focuses on population density and commuting to define urban counties that map to metropolitan (urban) areas. Other federal agencies use other definitions. Overall, the basic trends are clear.

https://www.hrsa.gov/rural-health/about-us/what-is-rural

The US Census Bureau’s detailed measure of “urban areas” essentially says that any area with 2,500+ people is an “urban” area. This clearly exaggerates the urban population, but this approach has been used for more than a century on a consistent basis, providing useful data. The 2020 measure of urban has been proposed using about 5,000 as the minimum for “urban”, but this definition has not been finalized.

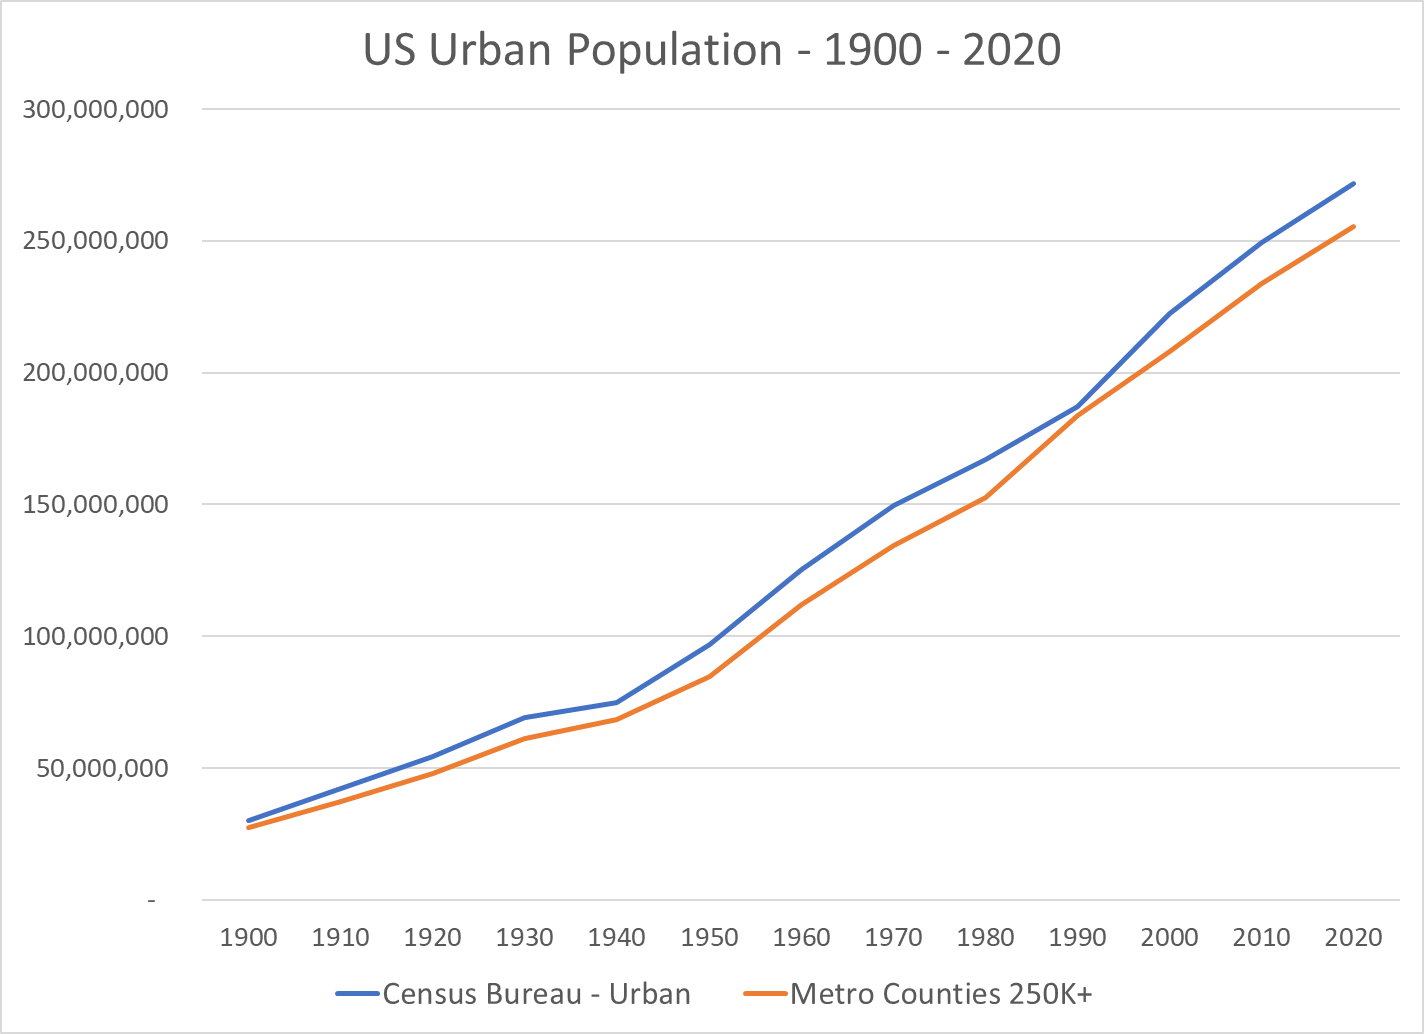
I have focused on the Metropolitan Statistical Areas (MSA) as defined in 2020 and recreated their populations back to 1900 based upon the county to MSA maps.

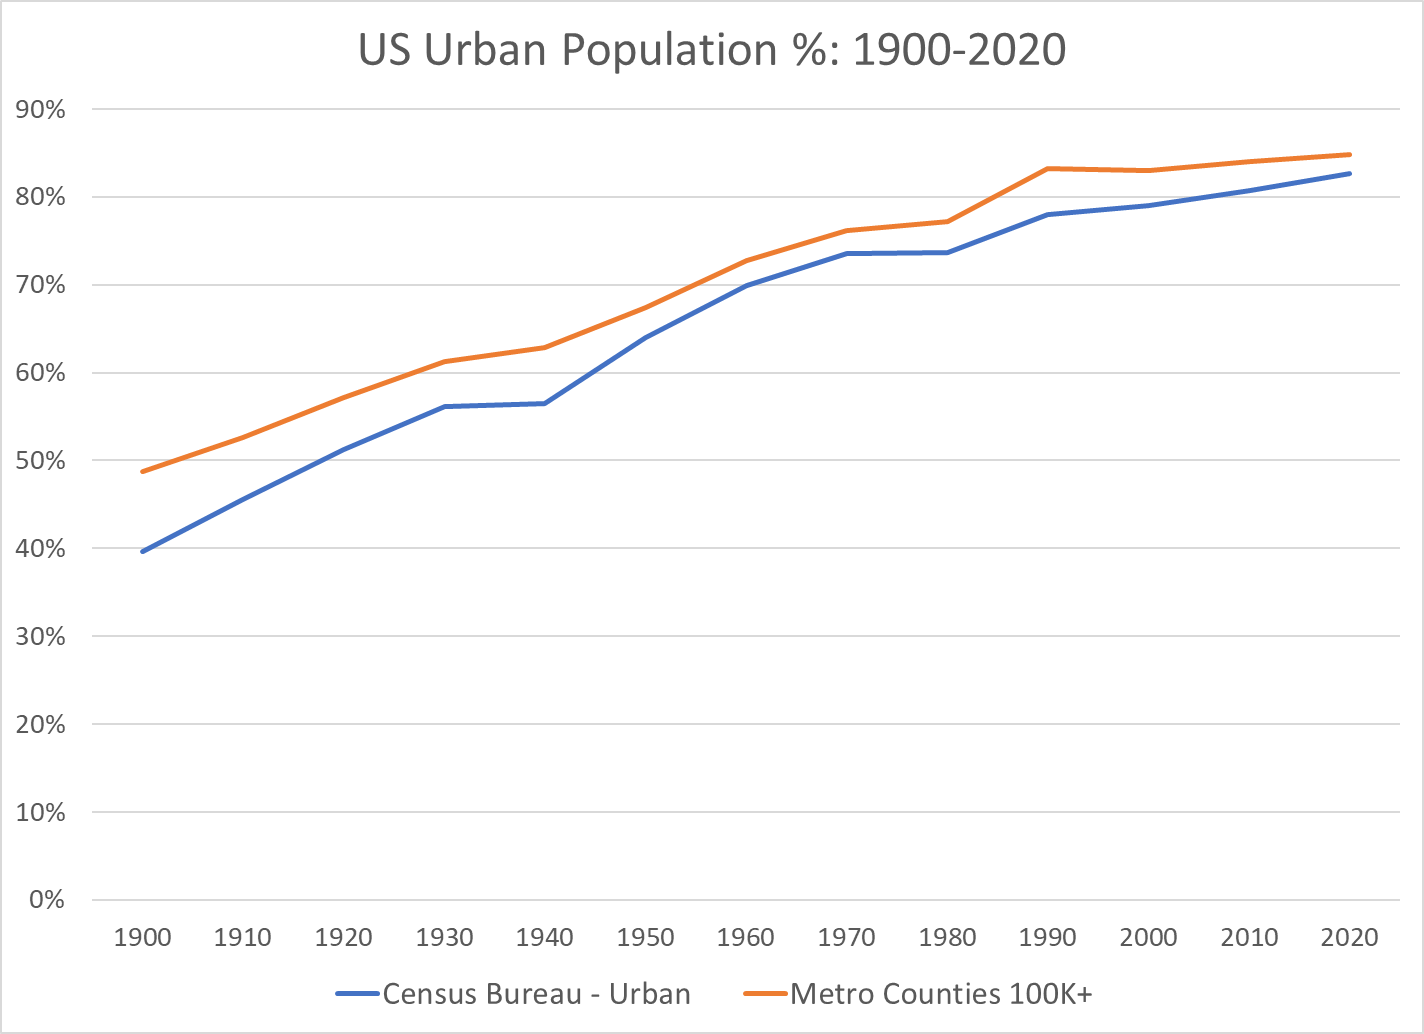
The measure of “percent urban” based upon the metro areas with 100K+ population or 250K+ populations very closely tracks the US Census Bureau’s detailed definition of urban areas (and therefor rural areas).

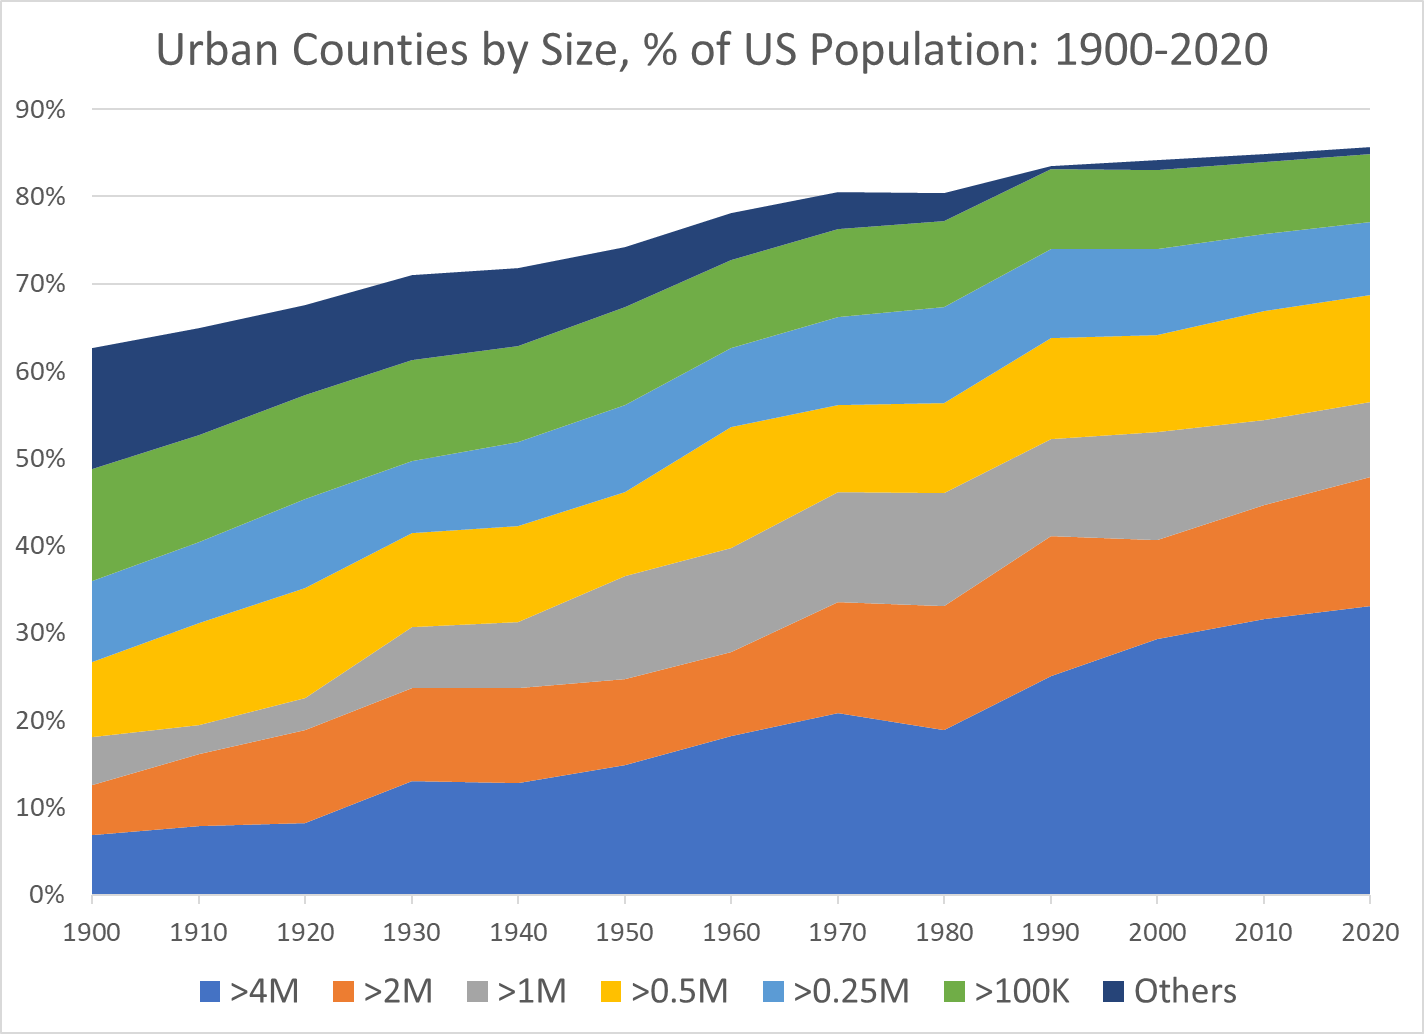
In summary, US urban population grew from 40% of the total in 1900 to 70% in 1970, about 3/7ths (0.42) of a percent more urban every year for 70 years. The move to “urban” continued in the next 50 years, but at a much slower rate, just 1/5th of a percent per year. But, this accumulates to move the urban percentage from 70% to 80%.

Growth of Very Large Metro Areas Has Driven the Growth in Urban Areas

The 4M+ metro areas have grown the most. The 2M+ and 1M+ areas have also grown. The smaller metro areas have made a smaller contribution to the growth of “urban” America.

The 50th Largest US Metro Area’s Population Has Increased 5-Fold Between 1900 and 2020

The Number of US Metro Areas with 1M, 2M or 4M Populations Has Expanded for a Century

Decade Reaching 1 Million Population                    

1900 New York Chicago Philadelphia Boston Pittsburgh St. Louis
1910
1920 Detroit Cleveland
1930 Los Angeles San Francisco Mpls-St Paul Baltimore Cincinnati Providence
1940 Washington
1950 Dallas-Ft Worth Houston Atlanta Seattle
1950 Kansas City Milwaukee Buffalo
1960 San Diego Columbus, OH Indianapolis
1970 San Bernardino Phoenix Tampa-St. Pete Denver Portland, OR
1970 Charlotte San Jose Virginia Beach New Orleans Hartford
1980 Miami Sacramento San Antonio
1990 Orlando Nashville Memphis Rochester
2000 Austin Las Vegas Louisville Oklahoma City Richmond Jacksonville
2010 Birmingham Salt Lake City Raleigh
2020 Tulsa Fresno Tucson

Decade Reaching 2 Million Population                    

1900 New York Chicago Philadelphia
1910 Boston
1920 Pittsburgh
1930 Detroit Los Angeles
1940
1950 San Francisco
1960 St. Louis Cleveland
1970 Mpls-St Paul Baltimore Washington Dallas-Ft Worth Houston
1980 Atlanta Seattle
1990 San Diego San Bernardino Phoenix Tampa-St. Pete Miami
2000 Cincinnati Denver
2010 Kansas City Portland, OR Charlotte Sacramento San Antonio Orlando
2020 Columbus, OH Indianapolis Austin Las Vegas

Decade Reaching 4 Million Population            

1900 New York
1910
1920
1930 Chicago
1940
1950 Los Angeles
1960 Philadelphia
1970 Detroit
1980
1990 Boston Washington Dallas-Ft Worth Miami
2000 San Francisco Houston Atlanta
2010 San Bernardino Phoenix
2020 Seattle

The Rapid Growth of the Largest US Metro Areas Has Driven the Growth of the Total Population

The Tipping From Very Slow Rural Growth to Possible Decline Has Attracted Attention from Demographers and Political Commentators

https://www.census.gov/library/visualizations/2021/dec/percent-change-county-population.html
https://carsey.unh.edu/publication/rural-depopulation
https://www.pewtrusts.org/en/research-and-analysis/blogs/stateline/2021/08/10/shrinking-rural-america-faces-state-power-struggle
https://www.ers.usda.gov/data-products/charts-of-note/charts-of-note/?topicId=4e8a0642-e40d-4299-906e-906bbaaf9e4d

https://www.businessinsider.com/how-the-2020-election-revealed-divide-in-american-dream-2020-11

https://dailyyonder.com/rural-population-declines-slightly-over-last-decade-census-shows/2021/09/07/

https://www.richmondfed.org/publications/research/econ_focus/2020/q1/district_digest

Summary

The disproportionate growth of “urban” and very large urban metro areas has continued in the last 50 years. This has a tremendous impact on the lives and perspectives of those in relatively declining rural and growing urban areas.

Good News: US Property Crime Rates Cut in Half Since 1998

https://crime-data-explorer.app.cloud.gov/pages/explorer/crime/crime-trend
https://ncvs.bjs.ojp.gov/multi-year-trends/crimeType

Property Crime Rates Were Very High 1975-90

https://www.factcheck.org/2020/06/trump-wrong-on-crime-record/

FBI and Bureau of Justice Data Both Show Declines, Reporting of Crimes Remains Consistent

https://www.pewresearch.org/fact-tank/2020/11/20/facts-about-crime-in-the-u-s/

Property Crime Rates Have Fallen Despite Changes

https://porch.com/advice/most-urbanized-states
https://www.pewresearch.org/social-trends/2018/05/22/demographic-and-economic-trends-in-urban-suburban-and-rural-communities/
https://www.pewresearch.org/fact-tank/2020/08/20/key-findings-about-u-s-immigrants/
https://www.pewresearch.org/fact-tank/2021/08/23/most-americans-say-the-declining-share-of-white-people-in-the-u-s-is-neither-good-nor-bad-for-society/
https://www.pewresearch.org/social-trends/2020/01/09/trends-in-income-and-wealth-inequality/
https://theconversation.com/gun-violence-has-fuelled-enduring-trust-issues-for-many-americans-144413
https://www.pewresearch.org/social-trends/2014/03/07/millennials-in-adulthood/
https://www.pewresearch.org/fact-tank/2016/04/13/americans-divided-on-how-much-they-trust-their-neighbors/

Good News: Violent Crime Rates Are Way Down (Especially in Urban Areas)

https://ncvs.bjs.ojp.gov/quick-graphics#quickgraphicstop
https://crime-data-explorer.fr.cloud.gov/pages/explorer/crime/crime-trend
https://ncvs.bjs.ojp.gov/quick-graphics#quickgraphicstop

Disclaimer

Yes, murder rates are up in 2019, 2020 and 2021, especially in big cities. I’ll address this subcategory of violent crimes in a separate analysis.

Rural Versus Urban Area Violent Crime Rates

There are claims that rural violent crime rates now exceed urban violent crime rates. I find no conclusive evidence to support these claims.

https://www.governing.com/archive/gov-crime-rural-urban-cities.html

https://bjs.ojp.gov/sites/g/files/xyckuh236/files/media/document/cv20.pdf

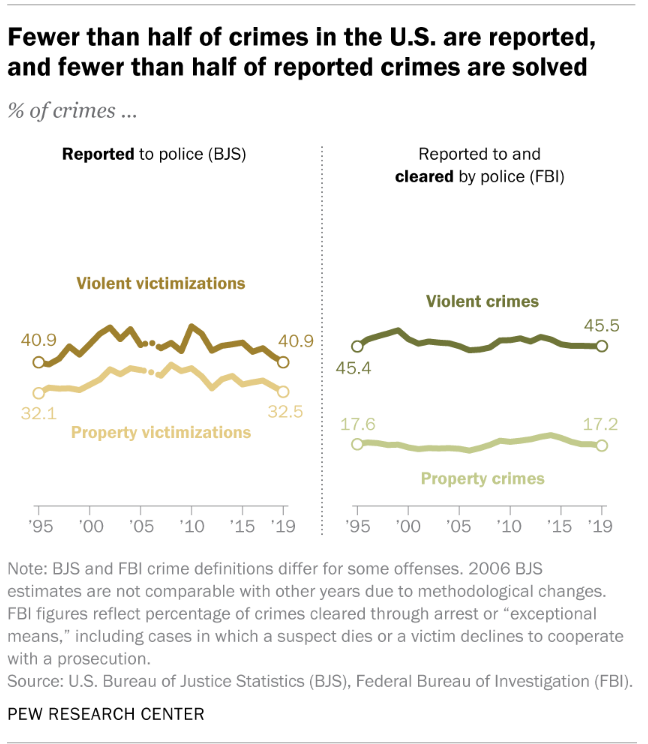
The US Bureau of Justice recently revised its definitions of urban, suburban and rural locations. The rural violent crime rate appears to be 20-25% lower than the urban crime rate. Note that rural property crime rates are 60% lower than urban rates.

Rural Versus Urban Violent Crime Trends

I’m not finding any consistent long-term “rural versus urban” crime rate statistics. As a substitute, I’m comparing the 15 most rural states versus the 15 most urban states based upon the “538” definition.

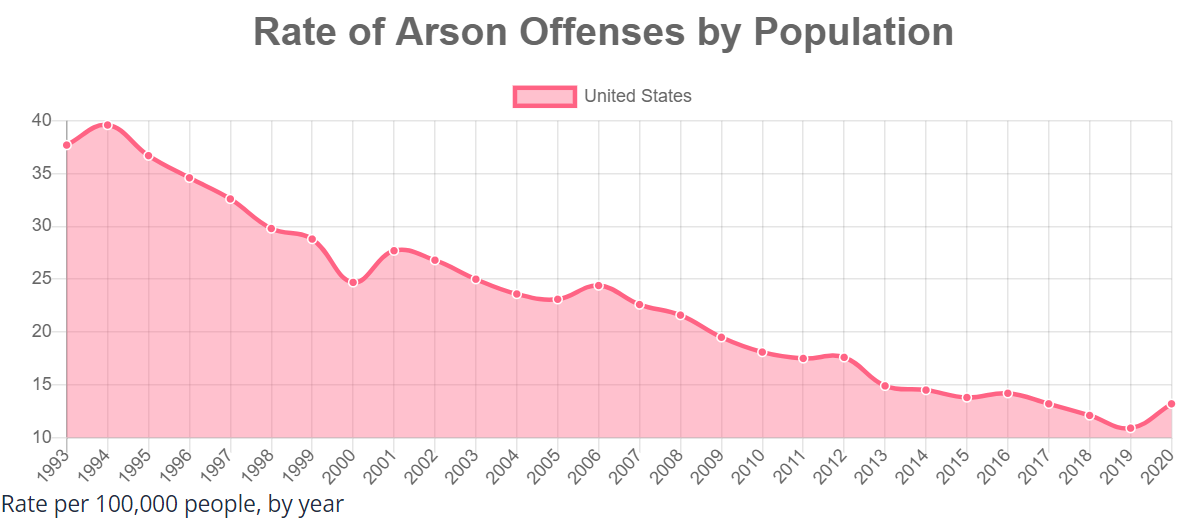
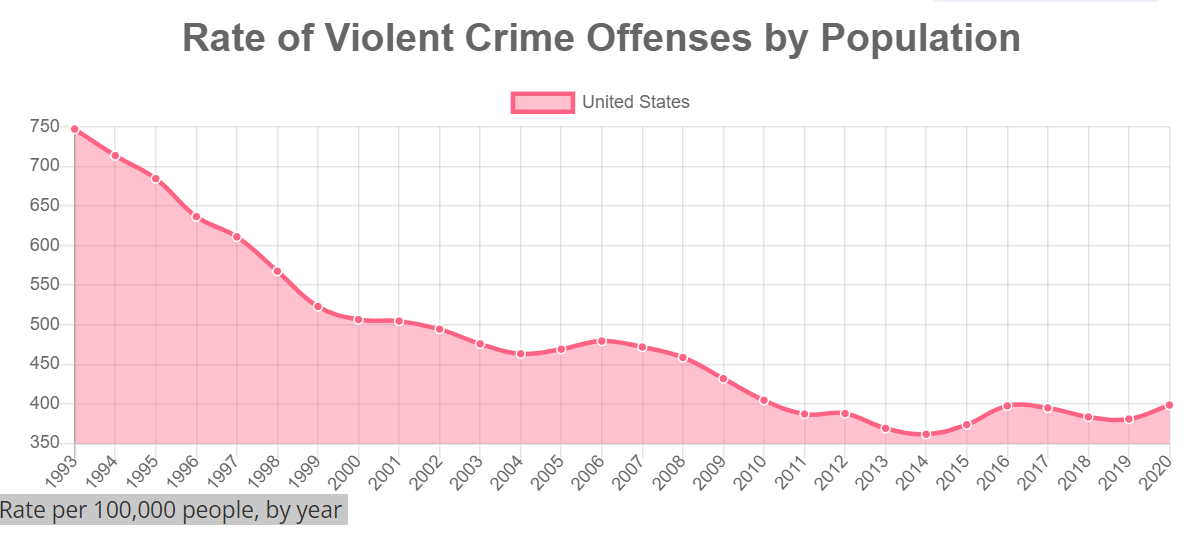
I’m choosing to focus on 2000-2010-2020 to simplify the analysis. Crime rates were dropping “like a rock” from 1993-2000 everywhere (see above).

https://crime-data-explorer.fr.cloud.gov/pages/explorer/crime/crime-trend

The total US violent crime rate dropped by an additional 22% from 2000 to 2010. It was flat between 2010 and 2020.

15 Urban States

The 15 most “urban” states averaged 508 events/100,000 people in 2000, above the national average. This group dropped by 19% in the first decade to 413 incidents per 100K people. This subset of states continued its downward trend by 13% in the next decade, reaching 361 reported violent crimes per 100K in 2020. At 361 incidents, these 15 relatively urban states had a violent crime rate 10% below the national average of 400.

Urban 15: WA, PA, CO, TX, AZ, CT, FL, IL, MD, RI, NV, MA, CA, NJ, NY.

The greatest reductions in violent crime rates in these “urban” states occurred in Florida, Maryland, New Jersey and Connecticut.

https://crime-data-explorer.fr.cloud.gov/pages/explorer/crime/crime-trend

15 Rural States

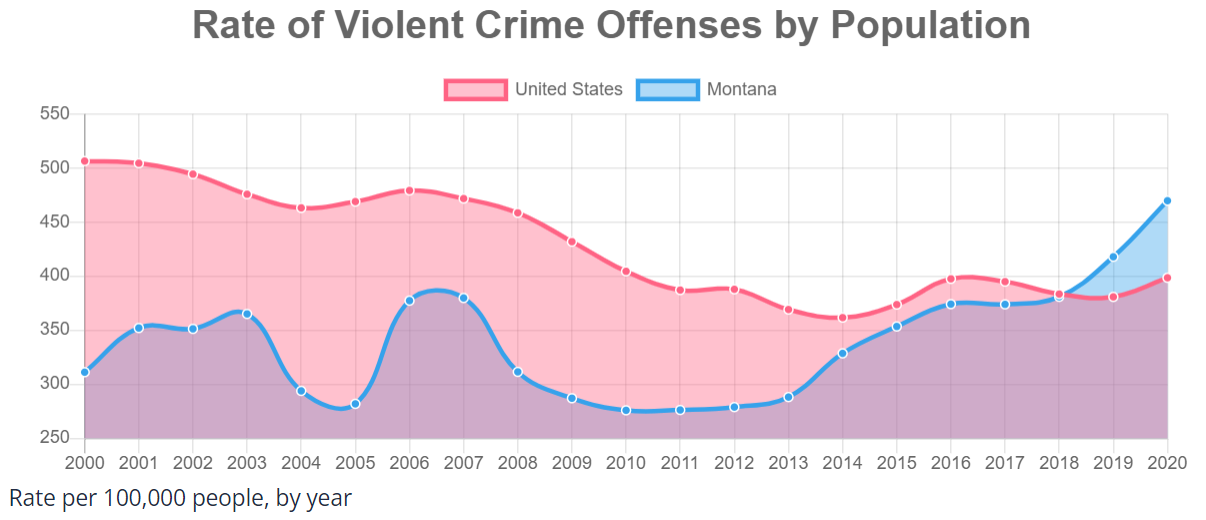
The 15 most rural states had crime rates of 321, 309 and 400 versus the national averages of 510, 400 and 400. The 15 rural states in 2000 had violent crime rates more than one-third lower than the national average. By 2020, they had increased to match the national average.

Rural 15: WY, MT, SD, AK, VT, MS, ME, ND, WV, AR, IA, ID, AL, KY, NM.

Six of the 15 states had very high violent crime rate increases. North Dakota and South Dakota based upon the “fracking” boom disruptions and Vermont, Montana, Arkansas and Alaska based upon other drivers.

https://crime-data-explorer.fr.cloud.gov/pages/explorer/crime/crime-trend

Summary

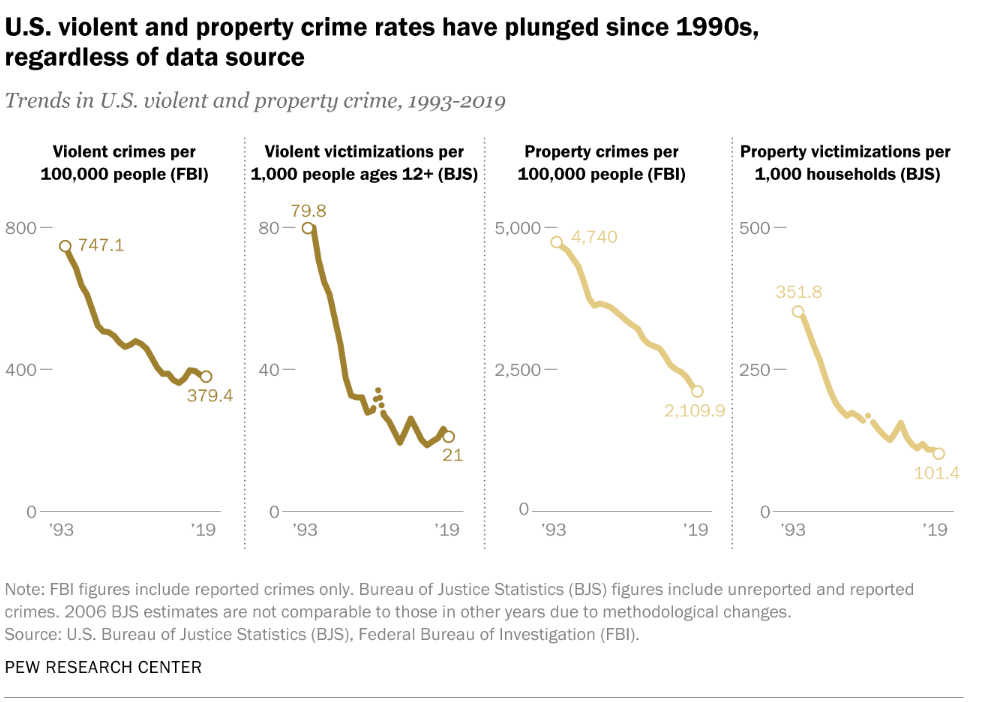
Despite the news media’s focus on urban homicide rates in 2019-20-21, the overall US violent crime rate continued to fall from 2000-2010 after an amazing drop from 1993-2000 and then stayed constant/flat for the next 10 years. This “flat” crime rate from 2010 to 2020 was AFTER a 40% drop in violent crime measured by the FBI stats and a 75% drop measured by the Bureau of Justice surveys of crime victims from 1993-2010.

The 15 urban states’ violent crime rates fell by 29% between 2000 and 2020. The 15 rural states’ violent crime rates INCREASED by 25% between 2000 and 2020, then roughly equaling the national average.

Violent crime rates fell by another 10% between 2010 and 2014, reaching a modern low. Unfortunately, they increased back to the 2010 level in 2020.

Good News: Lower US Workplace Injury and Death Rates

Injuries

https://fitsmallbusiness.com/workplace-injury-statistics/
https://www.bls.gov/charts/injuries-and-illnesses/total-nonfatal-work-injuries-and-illnesses-by-year.htm#
https://www.bls.gov/opub/mlr/2015/article/the-quest-for-meaningful-and-accurate-occupational-health-and-safety-statistics.htm
https://www.globaltrademag.com/industries-with-the-highest-rates-of-workplace-injuries/
https://www.workerscompensation.com/news_read.php?id=27835
https://www.bls.gov/charts/injuries-and-illnesses/number-and-rate-of-nonfatal-work-injuries-and-illnesses-by-industry.htm
https://www.bls.gov/iif/oshwc/osh/os/osch0054.pdf
https://www.bls.gov/opub/mlr/2015/article/the-quest-for-meaningful-and-accurate-occupational-health-and-safety-statistics.htm
https://www.bls.gov/iif/oshwc/osh/os/osch0054.pdf

Workplace Fatalities

https://www.insurancejournal.com/news/national/2020/02/21/558963.htm
https://www.bls.gov/news.release/pdf/cfoi.pdf
https://govfailure.com/item/osha-didnt-speed-decline-in-workplace-deaths/

1915 rate estimated to be 60.

https://www.bls.gov/opub/mlr/2016/article/the-life-of-american-workers-in-1915.htm

https://www.bls.gov/news.release/pdf/cfoi.pdf
https://www.bls.gov/iif/oshwc/cfoi/cfch0016.pdf
https://www.bls.gov/charts/census-of-fatal-occupational-injuries/number-of-fatal-work-injuries-by-employee-status-self-employed-wage-salary.htm
https://www.bls.gov/iif/oshwc/cfoi/worker_memorial.htm
https://www.cdc.gov/mmwr/preview/mmwrhtml/mm4822a1.htm
https://www.bls.gov/news.release/pdf/cfoi.pdf
https://www.cdc.gov/mmwr/preview/mmwrhtml/mm4822a1.htm
https://www.bls.gov/iif/oshwc/cfoi/worker_memorial.htm
https://www.cdc.gov/mmwr/preview/mmwrhtml/mm4822a1.htm
https://www.bls.gov/charts/census-of-fatal-occupational-injuries/number-and-rate-of-fatal-work-injuries-by-industry.htm
https://www.bls.gov/iif/oshwc/cfoi/worker_memorial.htm
https://www.bls.gov/iif/oshwc/cfoi/cfch0016.pdf
https://www.bls.gov/charts/census-of-fatal-occupational-injuries/civilian-occupations-with-high-fatal-work-injury-rates.htm
https://www.bls.gov/iif/oshwc/cfoi/cfch0013.pdf
https://www.bls.gov/charts/census-of-fatal-occupational-injuries/number-and-rate-of-fatal-work-injuries-by-occupation.htm
https://www.publichealthpost.org/databyte/men-hard-at-work/
https://www.insurancejournal.com/news/national/2020/02/21/558963.htm
https://www.bls.gov/charts/census-of-fatal-occupational-injuries/rate-of-fatal-work-injuries-per-100000-fte-by-age.htm

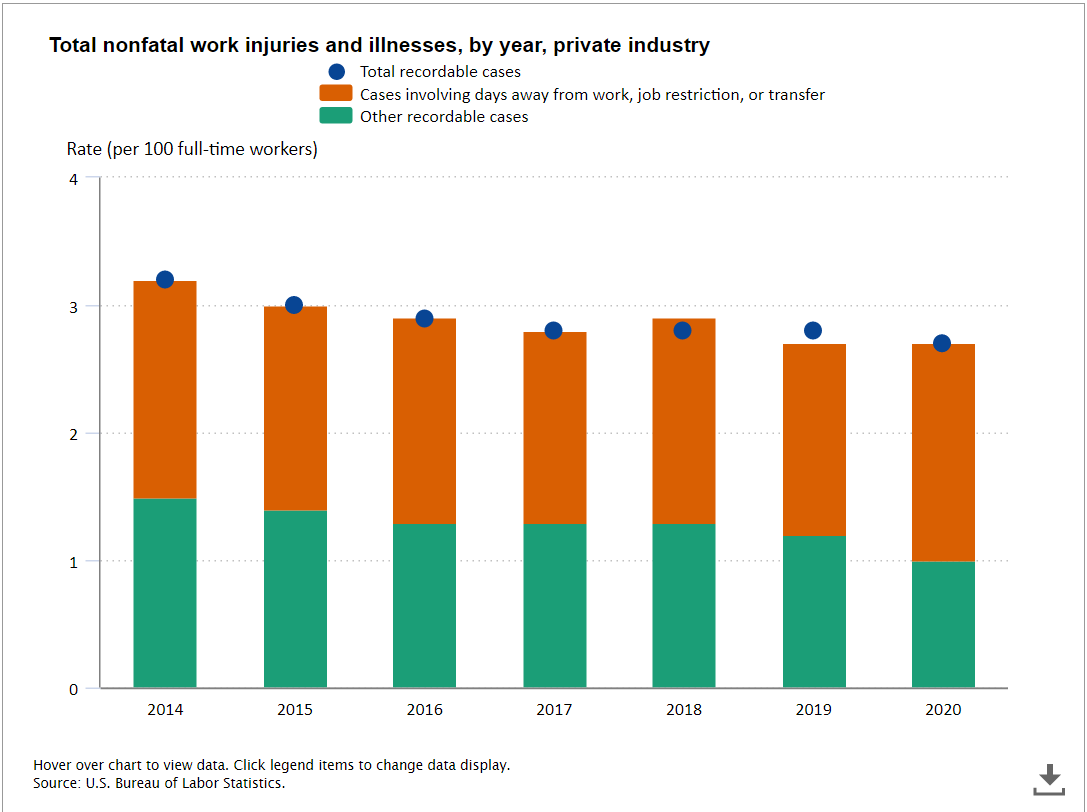
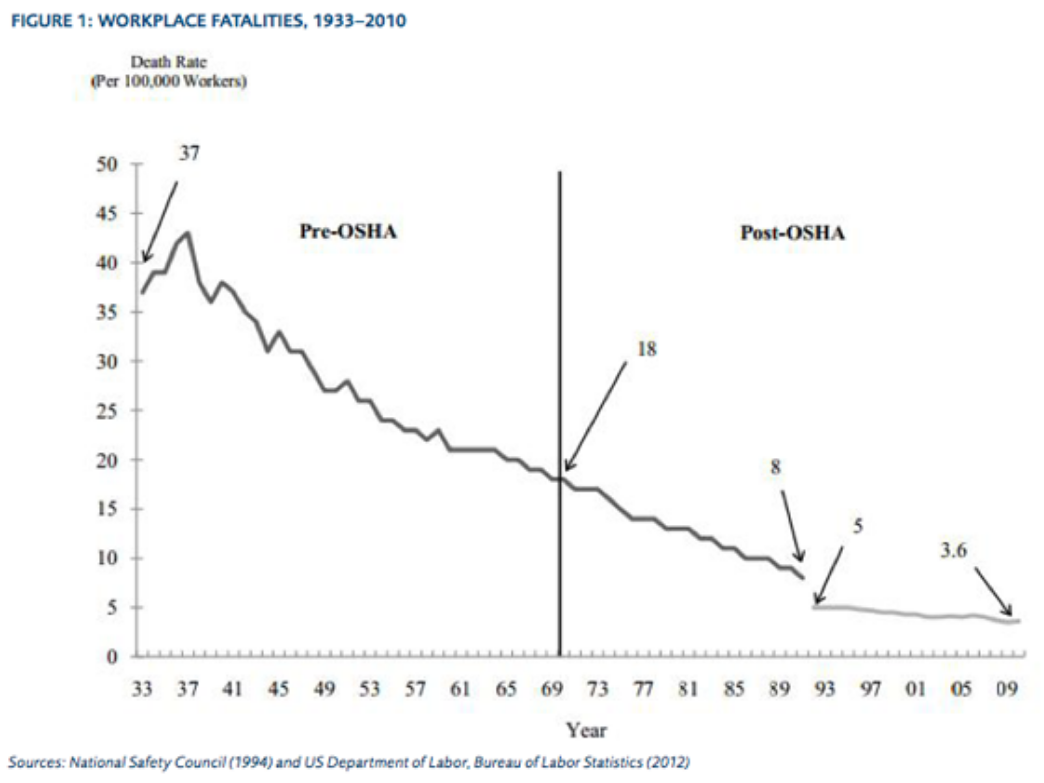
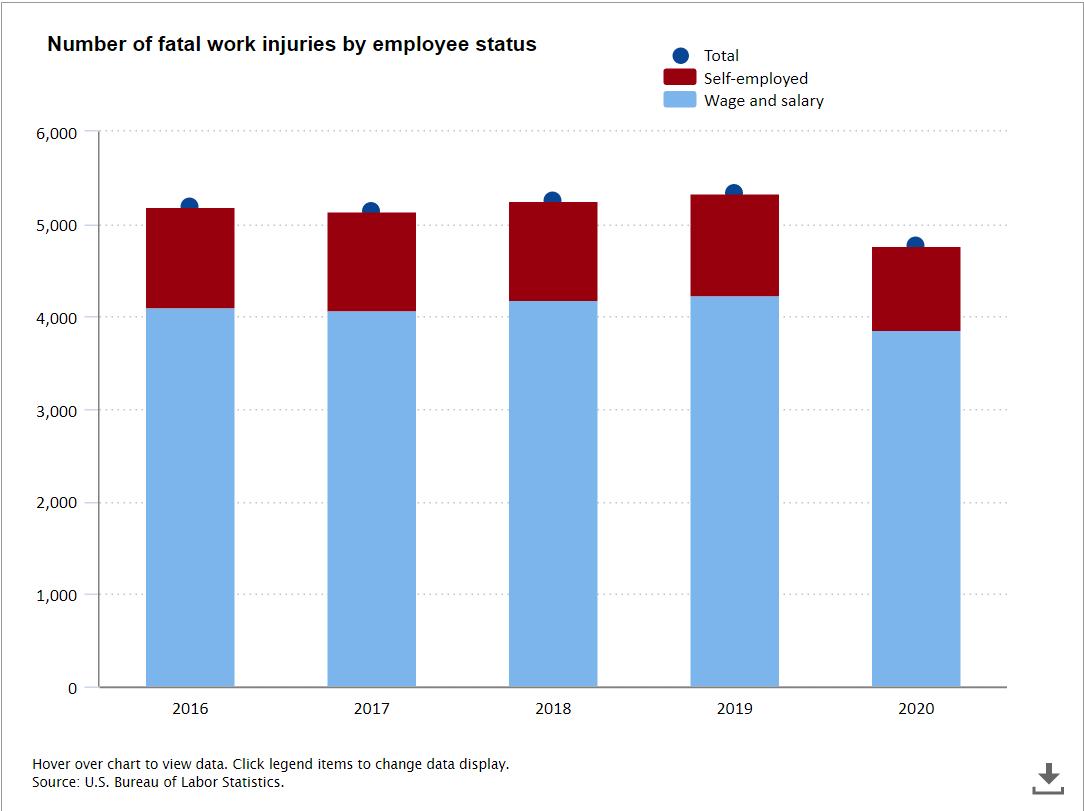
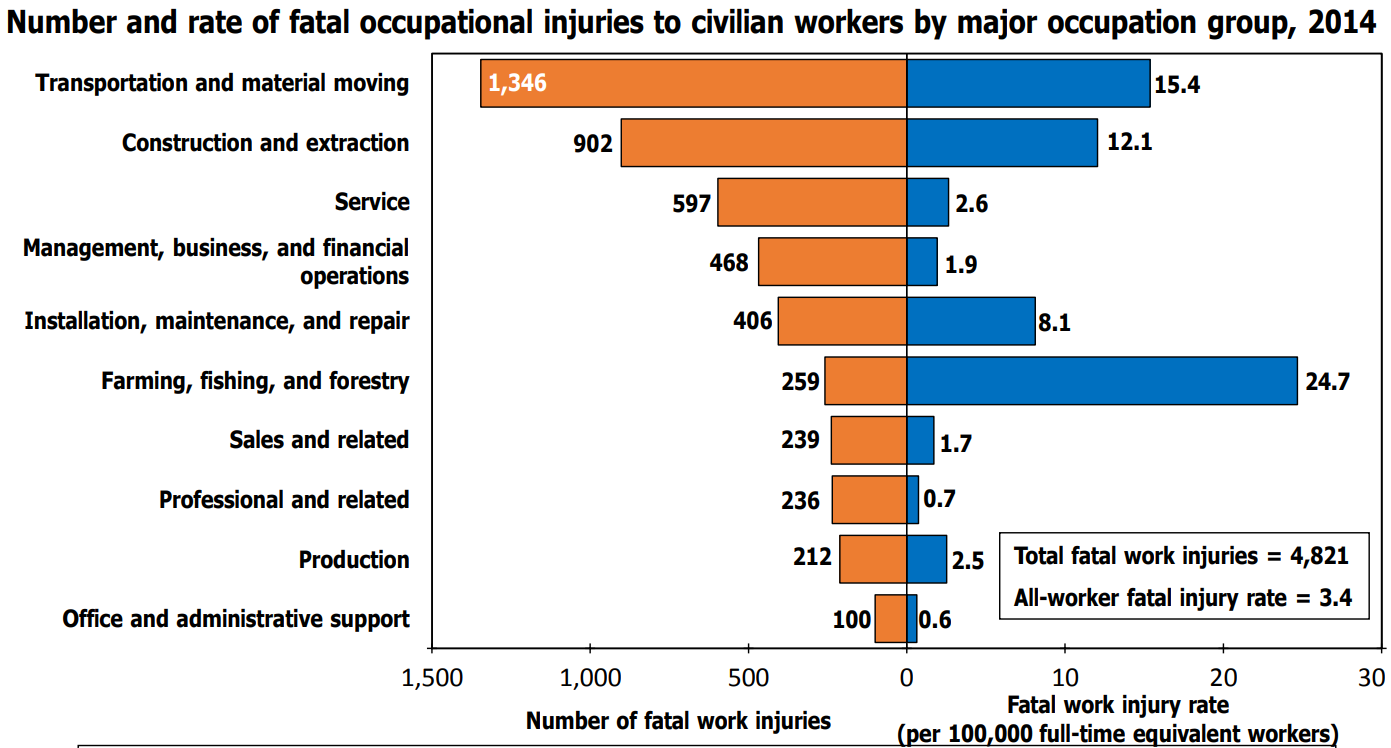
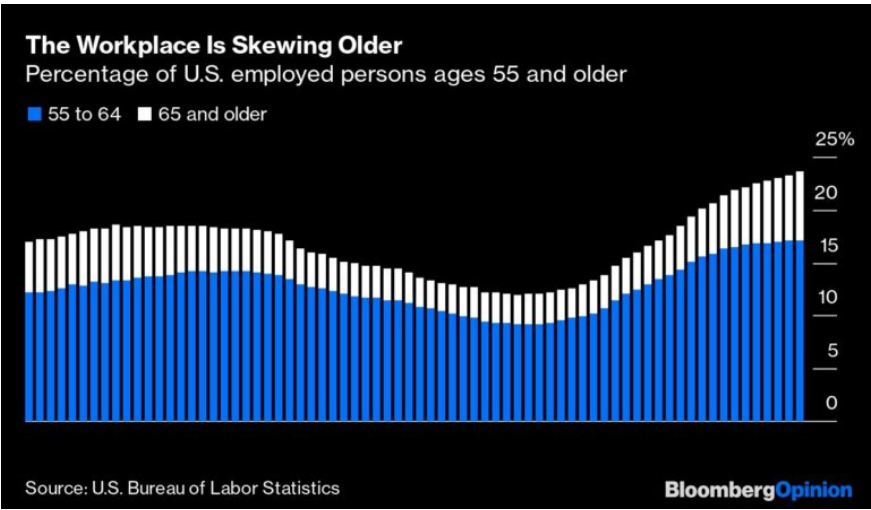
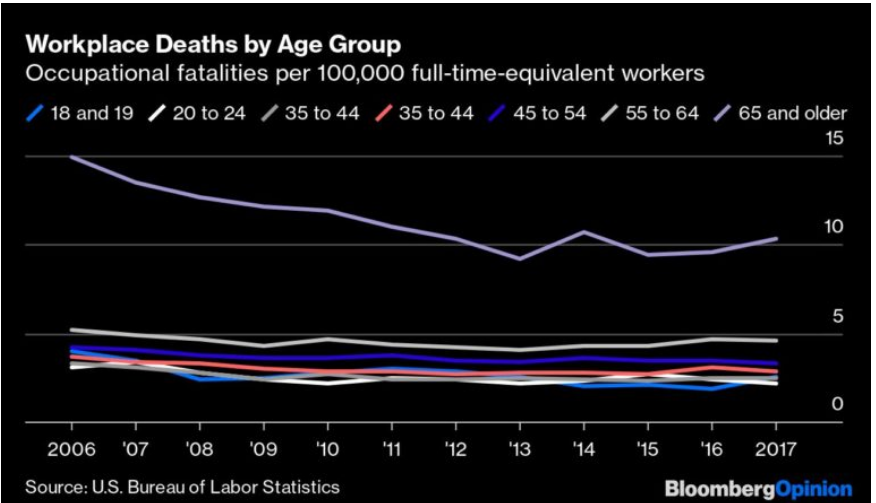
The baby boomers have caused the relatively higher death rate aged 55+ groups to almost double their share of total workers. While the death rate for EACH age group has gone down in the last 20 years, the blended average has been flat for the last decade.

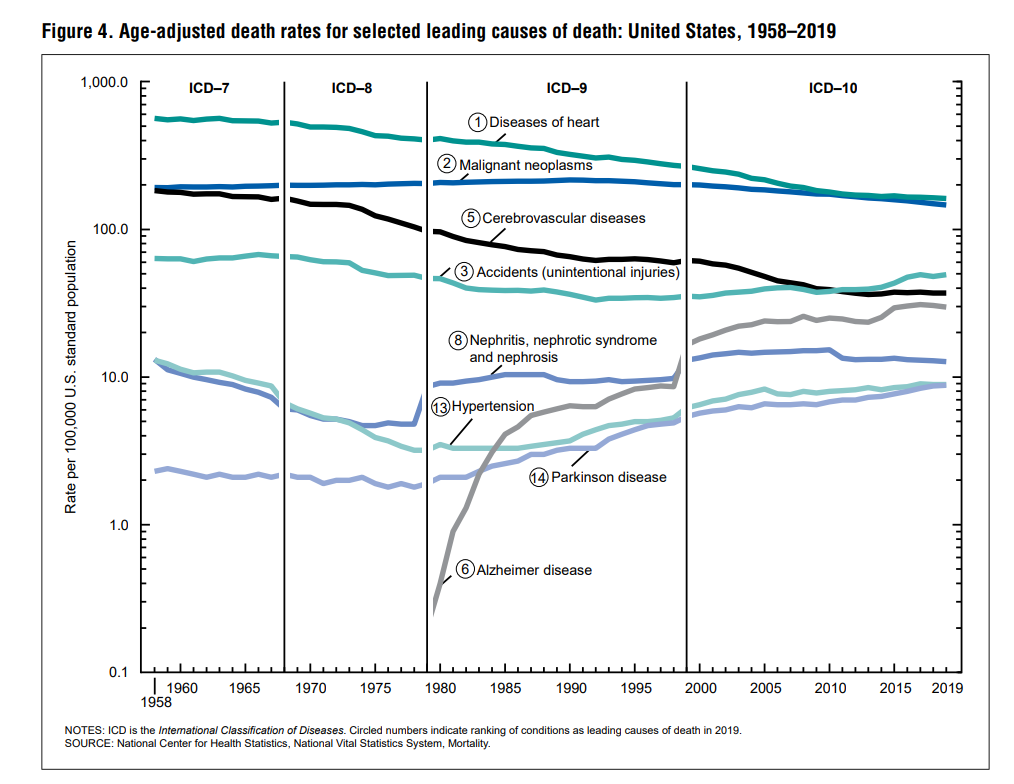
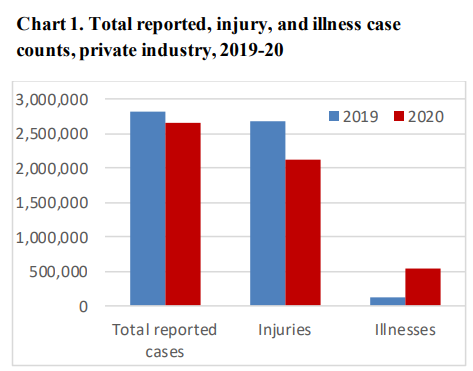
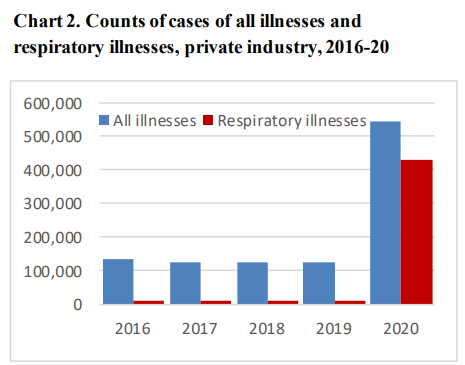
Covid Provided Special Challenges and the Results Could Always Be Even Better

https://www.bls.gov/news.release/pdf/osh.pdf

https://www.cnbc.com/2021/12/29/bls-estimates-that-13-us-workers-die-on-the-job-per-day-on-average.html

https://aflcio.org/reports/death-job-toll-neglect-2021

Good News: International Travel to US Trends Upward in 21st Century

https://ntlrepository.blob.core.windows.net/lib/79000/79200/79277/TSAR_2020_Compressed_20210104.pdf
https://qz.com/2020189/the-us-is-losing-its-appeal-as-a-global-tourism-destination/
https://www.trade.gov/sites/default/files/2021-03/Fact%20Sheet%20International%20Visitation%20FINAL.pdf
https://ntlrepository.blob.core.windows.net/lib/79000/79200/79277/TSAR_2020_Compressed_20210104.pdf
https://qz.com/2020189/the-us-is-losing-its-appeal-as-a-global-tourism-destination/

US Top Recipient of Foreign Travel Dollars

https://data.worldbank.org/indicator/ST.INT.RCPT.CD?most_recent_value_desc=true
https://www.trade.gov/sites/default/files/2021-03/Fact%20Sheet%20Exports.pdf
https://www.ustravel.org/sites/default/files/2021-12/research_fact-sheet_travel_and_trade.pdf

Many US Cities/Destinations Remain Attractive

https://www.worldatlas.com/cities/america-s-10-most-visited-cities.html

https://www.bts.gov/archive/publications/state_transportation_statistics/summary/table_04_19

Future: Forecast, Challenges, Opportunities

72% Recovery in 2022, 100% in 2024

https://www.ustravel.org/research/travel-forecasts

Less “America First” Headwinds

https://qz.com/2020189/the-us-is-losing-its-appeal-as-a-global-tourism-destination/

Marketing Investment Opportunities

https://www.ustravel.org/press/us-travel-market-share-continue-decline-through-least-2023-report

Good News: US Coal Usage is Falling

https://en.wikipedia.org/wiki/Coal_mining_in_the_United_States
https://www.eia.gov/todayinenergy/detail.php?id=48696
https://en.wikipedia.org/wiki/Coal_mining_in_the_United_States

Exports First Exceeded 10% of Production in 2012

https://www.eia.gov/coal/annual/pdf/acr.pdf
https://www.eia.gov/coal/annual/
https://www.eia.gov/todayinenergy/detail.php?id=38172
https://www.eia.gov/todayinenergy/detail.php?id=37692
https://www.eia.gov/todayinenergy/detail.php?id=43895

Coal Accounts for 20% of Electricity Generation

https://www.csis.org/analysis/phasing-out-coal-us-electricity-increasingly-regional-challenge

https://en.wikipedia.org/wiki/List_of_coal-fired_power_stations_in_the_United_States

30% of Coal-Fired Power Plants Closed 2010-19

https://en.wikipedia.org/wiki/List_of_coal-fired_power_stations_in_the_United_States

https://www.eia.gov/todayinenergy/detail.php?id=50658

Up to Two-thirds of 240 Remaining Coal-Fired Power Plants to Close by 2028

https://www.reuters.com/business/energy/us-coal-fired-power-plants-scheduled-shut-2021-10-28/

https://www.eia.gov/todayinenergy/detail.php?id=50658

https://abcnews.go.com/US/wireStory/coal-fired-power-plants-close-wastewater-rule-81328300

https://www.newsweek.com/26-coal-fired-power-plants-14-states-plan-stop-burning-coal-due-new-rule-1652009

Remaining Coal-Fired Power Plants are Concentrated in a Dozen States

https://pubs.usgs.gov/of/1996/of96-092/Comp/main.gif
https://www.csis.org/analysis/phasing-out-coal-us-electricity-increasingly-regional-challenge

Coal Production and Consumption Temporarily Rebounded in 2021 as the Economy Recovered from the Pandemic and the Cost of Natural Gas Increased

https://www.iea.org/news/coal-power-s-sharp-rebound-is-taking-it-to-a-new-record-in-2021-threatening-net-zero-goals

https://www.cnn.com/2021/10/18/business/coal-power-climate-crisis/index.html

Good News: Polio is Almost Gone

The US averaged 35,000 annual cases of polio in the 1940’s. The disease was eradicated in the US by 1979.

Global cases were 350,000 in 1988. Concerted efforts by governments, health care professionals, philanthropists and civic organizations (Rotary) eliminated polio from 5 continents by 2020. The last African case was reported in Nigeria in 2016.

Active cases were reported in only Afghanistan and Pakistan last year.

Soon, this will be the second ever human infecting disease to be eliminated (after smallpox).

https://www.cdc.gov/polio/progress/index.htm#:~:text=The%20annual%20number%20of%20wild,certified%20as%20eradicated%20in%202019.

https://ourworldindata.org/polio

https://www.cdc.gov/polio/what-is-polio/polio-us.html

https://www.rotary.org/en/our-causes/ending-polio

Good News: US Forests Are Growing

Forest Coverage is Up for a Century

Added 51M Sq Miles, 1987-2017: Size of North Carolina

Added 28M Sq Miles, 1990-2020: Size of South Carolina

Timberland Has Grown as Part of Total Forest

Healthy Stock by Volume, Diameter, Age, Carbon

https://usafacts.org/articles/how-us-forests-affect-the-environment-and-help-stabilize-the-climate/

https://crsreports.congress.gov/product/pdf/R/R46313

Annual Growth and Harvest are Sustainable

Ownership, Preservation, Management Plans

US in Global Context

Threats are Real, But Often Exaggerated

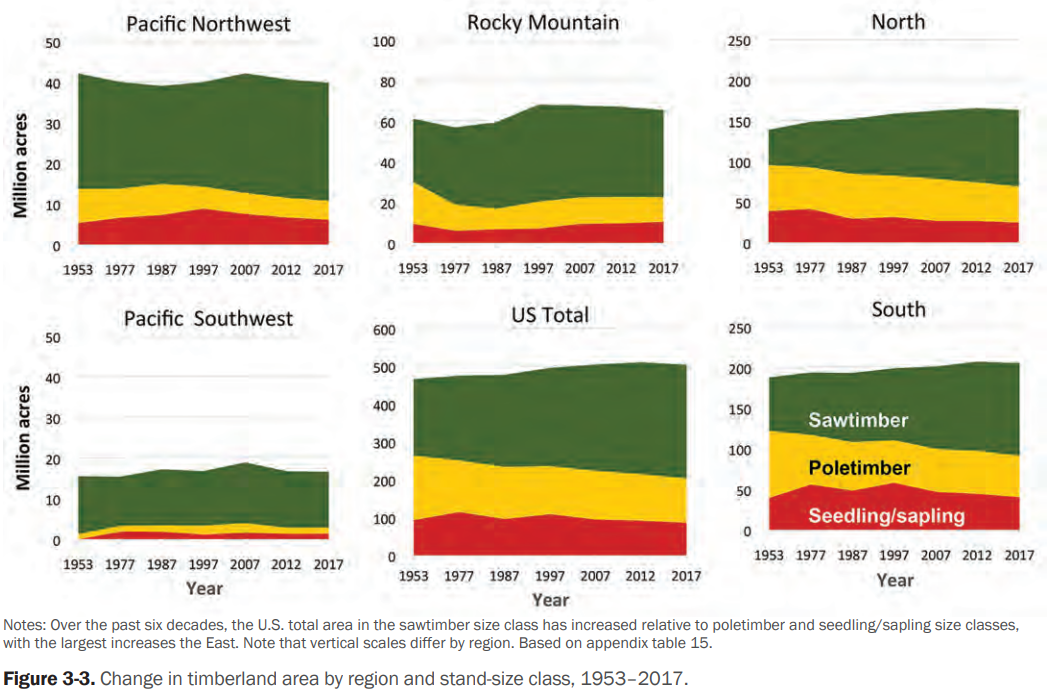
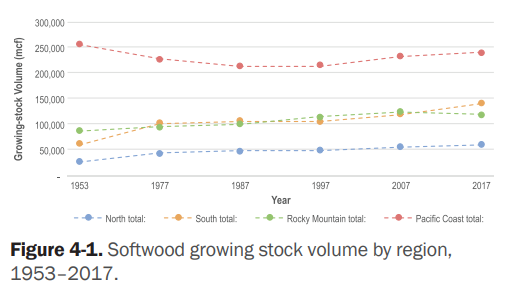
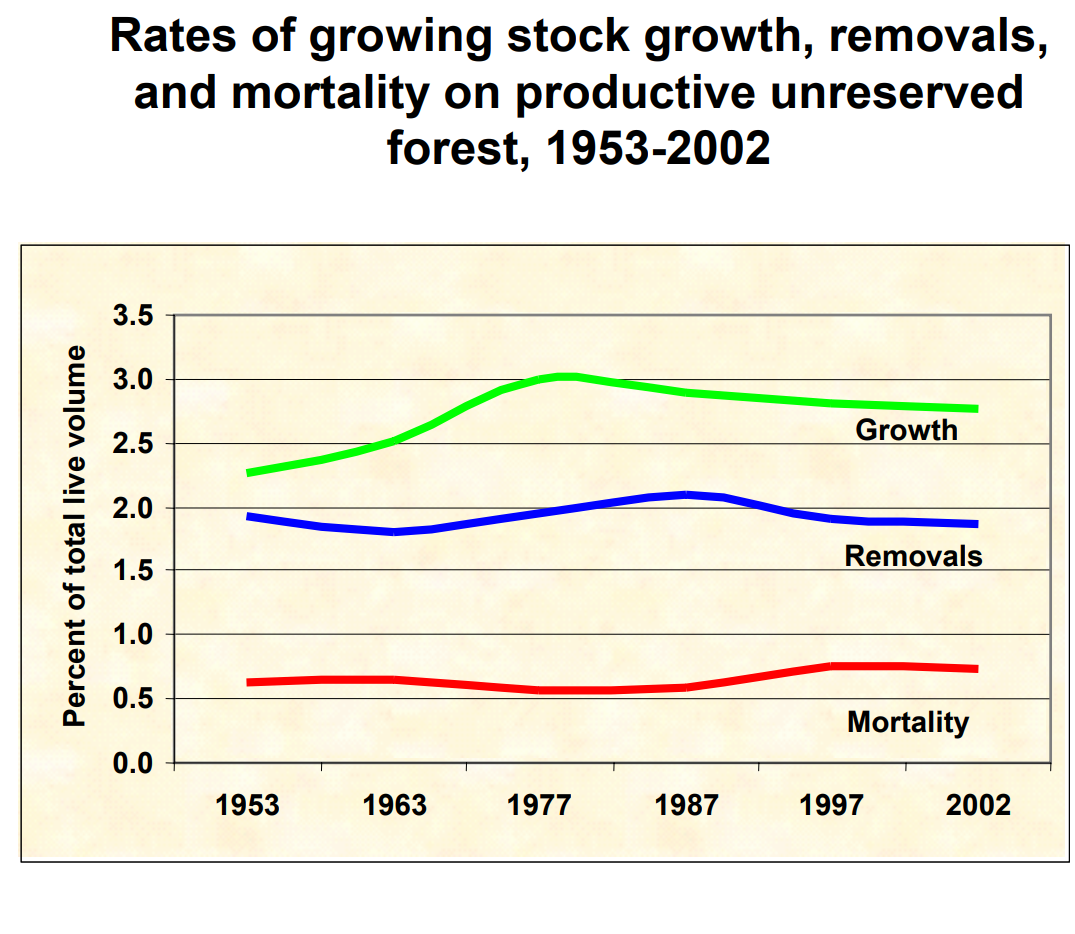
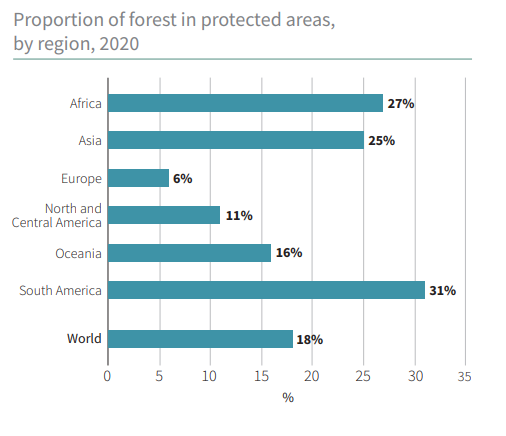
“Many challenges are associated with drought, wildfire, invasive species, and outbreaks of insects and disease—all made worse by climate change. Warming temperatures mean more energy in the atmosphere, which is consistent with severe weather events, such as floods, tornadoes, blizzards, ice storms, and hurricanes.” 

https://www.fs.usda.gov/speeches/state-forests-and-forestry-united-states-1

https://www.cnn.com/2019/07/20/health/iyw-cities-losing-36-million-trees-how-to-help-trnd/index.html

https://www.treehugger.com/more-trees-than-there-were-years-ago-its-true-4864115

https://usafacts.org/articles/how-us-forests-affect-the-environment-and-help-stabilize-the-climate/

https://ourworldindata.org/grapher/proportion-of-forest-area-with-long-term-management-plan?time=2020

Good News: God is NOT Dead In the US

Nietzsche Declared It In 1882: 7 Generations Ago

https://philosophybreak.com/articles/god-is-dead-nietzsche-famous-statement-explained/

Time Magazine Taunted 1966: 3 Generations Ago

80-90% Believe in God or a “Higher Power”

https://www.pewtrusts.org/en/trust/archive/fall-2018/when-you-say-you-believe-in-god-what-do-you-mean

56% believe in God as described in the Bible. Another 23% have a less literal belief in God. Of the 20% who answer “no”, fully one-half believe in some kind of higher power or spiritual force. Only 10%, in 2017, fully rejected any supreme being/force/concept.

Time Says 90% Believe in God

https://time.com/4283975/god-belief-religion-americans/

Gallup Poll Reinforces 80-90% Belief

https://news.gallup.com/poll/268205/americans-believe-god.aspx

US Belief In God Is Twice as High as In Europe

56% in US believe in Biblical God versus 27% in Europe.

https://www.pewtrusts.org/en/trust/archive/fall-2018/when-you-say-you-believe-in-god-what-do-you-mean

U.S. adults are more religious than Western Europeans

Belief in God Forecast to Grow Globally

The Future of World Religions: Population Growth Projections, 2010-2050

However: Non-Religion Affiliated Folks Grew

https://www.christianitytoday.com/news/2019/march/evangelical-nones-mainline-us-general-social-survey-gss.html

From 7% to 22% by this measure!

PRRI summarizes their data and Pew data to assert that the unaffiliated population grew from 16% to 25% but has recently fallen back to 23%.

Other analysts conclude that the “nones” account for up to 30% of the population.

https://www.deseret.com/faith/2022/4/14/23022509/god-is-not-dead-religion-data-politics-faith-in-america

https://www.nbcnews.com/think/opinion/2010s-spelled-end-white-christian-america-ncna1106936

This survey shows the “unaffiliated” category increases from 20% to 26%.

Fewer Young Adults Belong to Churches

Religious Believers Maintain Same Activities

https://www.deseret.com/faith/2022/4/14/23022509/god-is-not-dead-religion-data-politics-faith-in-america

Mainstream Protestants Fell, Bottomed, Recovered

https://www.christianitytoday.com/news/2019/march/evangelical-nones-mainline-us-general-social-survey-gss.html

From 28% to 12%, or from 18% to 13%.

Evangelicals Grew, Then Declined

https://www.christianitytoday.com/news/2019/march/evangelical-nones-mainline-us-general-social-survey-gss.html

About Three-in-Ten U.S. Adults Are Now Religiously Unaffiliated

Based on a “born again” definition, evangelicals have declined by 6%.

https://www.cnn.com/2021/07/10/opinions/american-evangelicals-protestantism-butler-bass/index.html

Evangelicals Increasingly Overlap With Republican Party Identification

https://www.christianitytoday.com/news/2019/march/evangelical-nones-mainline-us-general-social-survey-gss.html

https://www.sltrib.com/opinion/commentary/2021/10/27/ryan-burge-why/

Summary

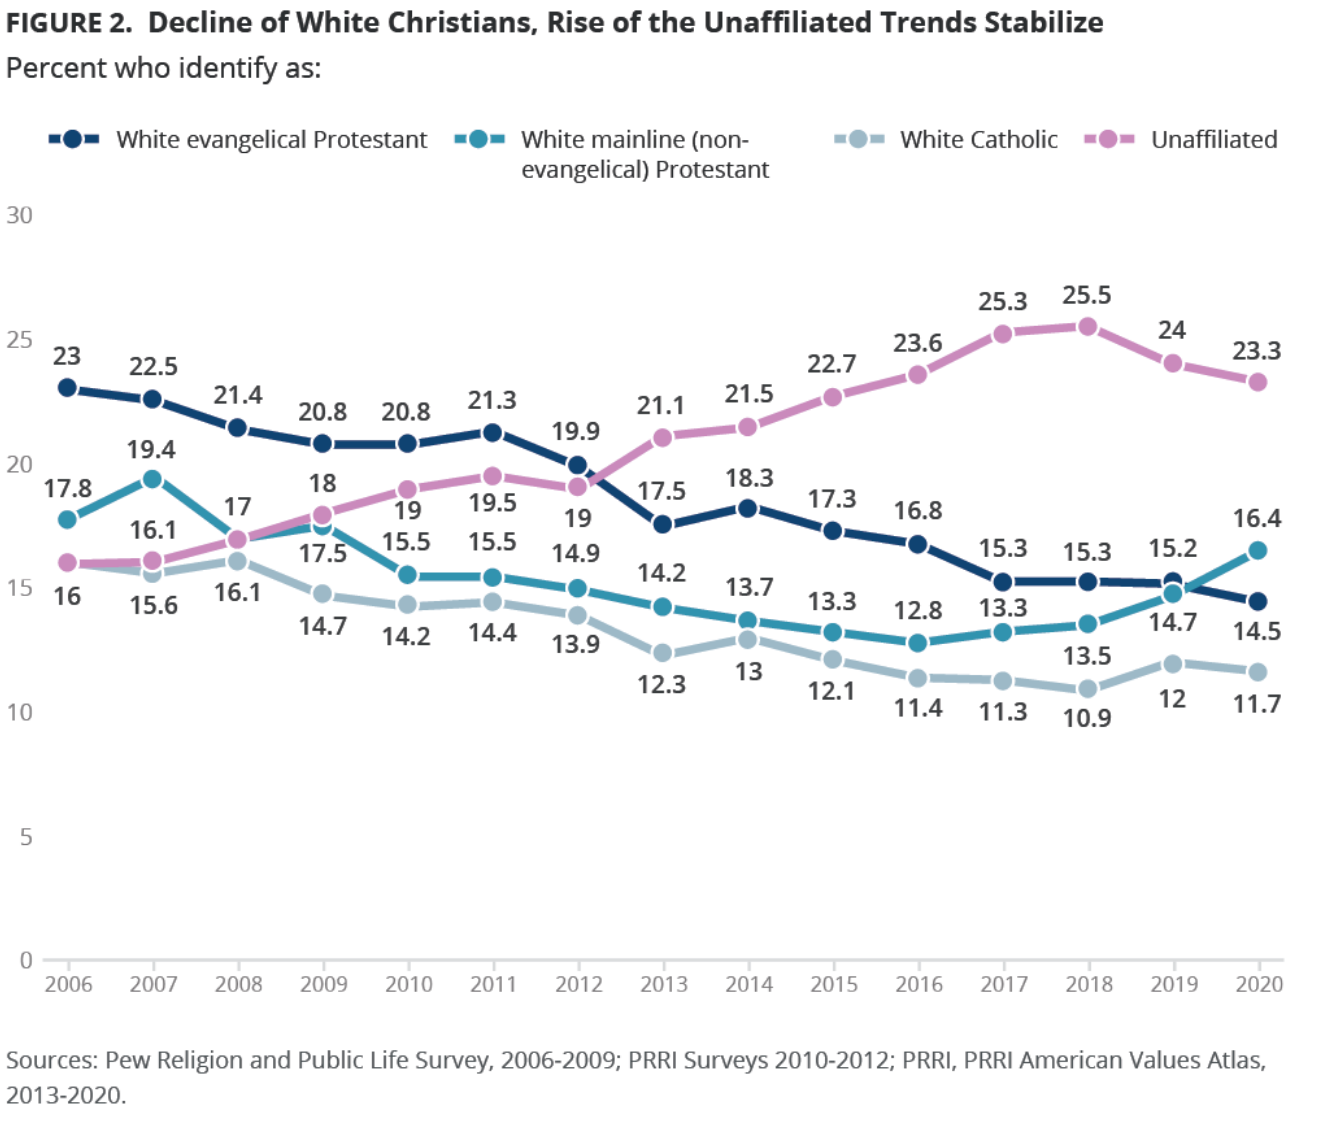
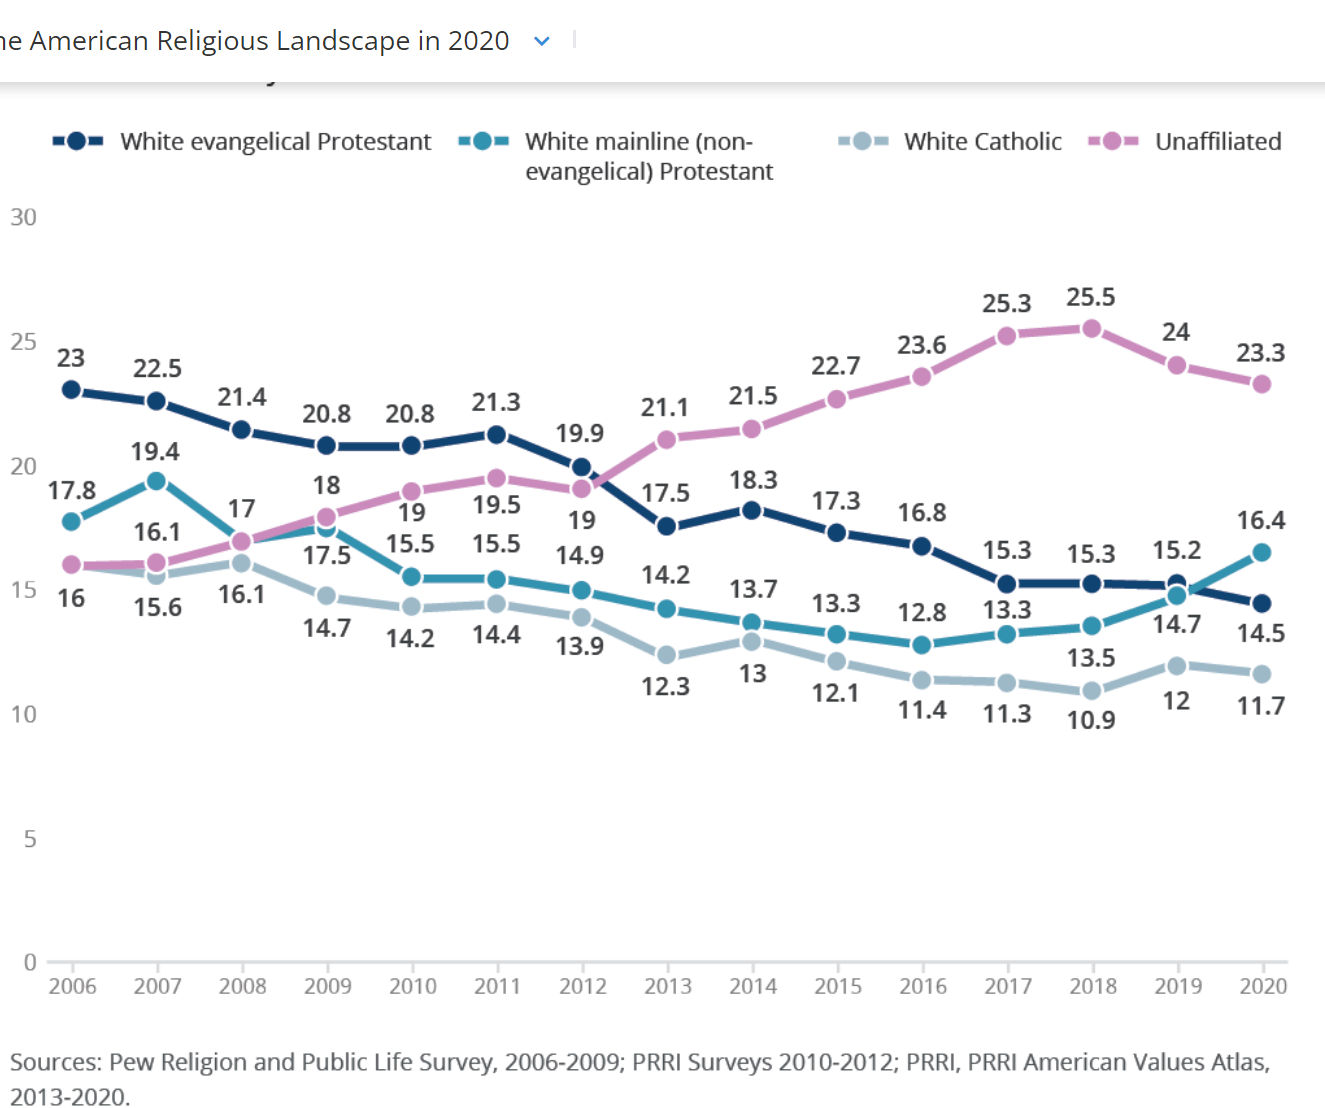
US citizens belief in God remains strong, between 80-90%. Church affiliation has declined to 70%. Mainline (liberal-centrist) Protestant believers have declined dramatically, but recently stabilized. Evangelical Protestant believers increased in the 1980’s and 1990’s, but have declined somewhat since then. Catholic membership has remained roughly constant, with Hispanics replacing Whites.

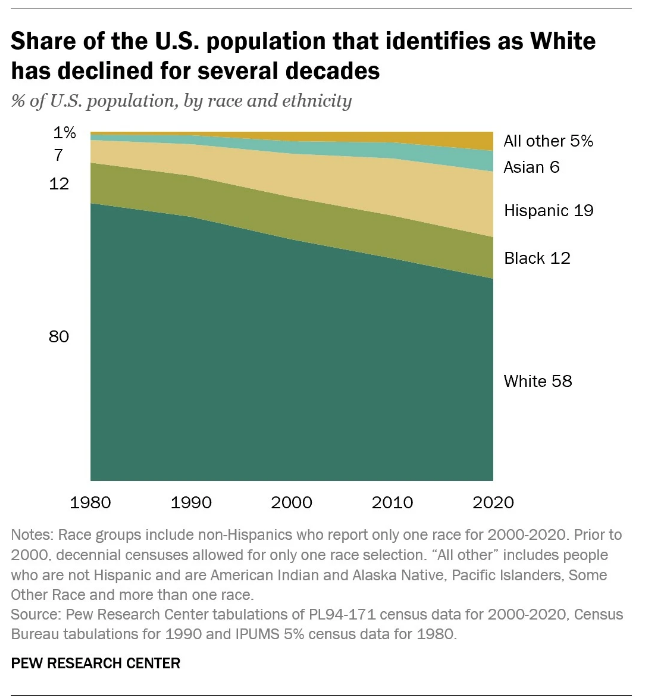
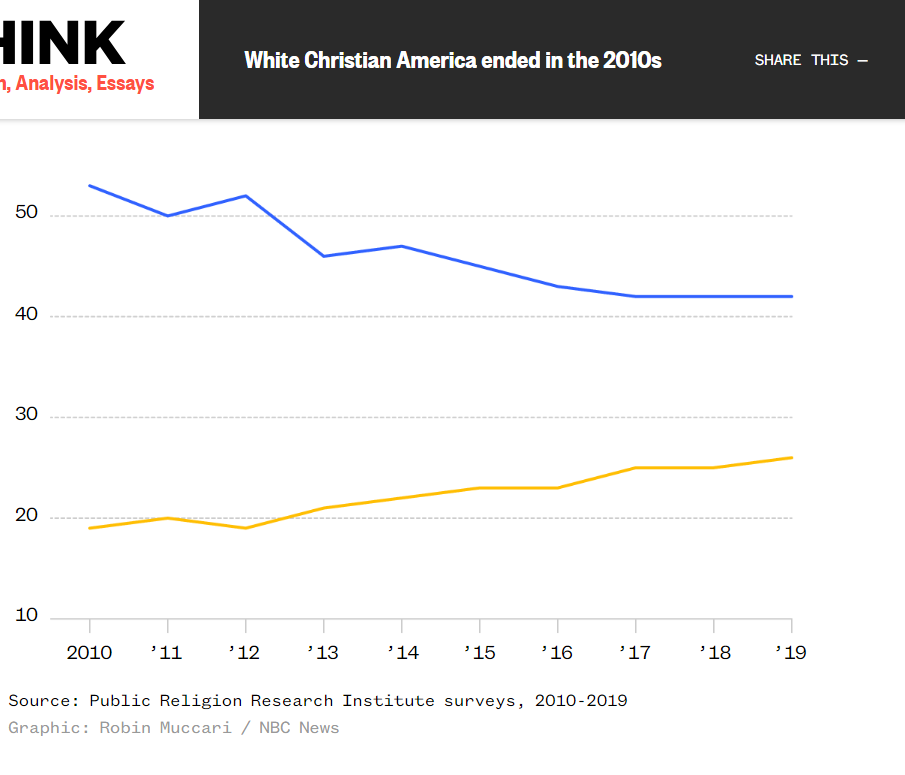
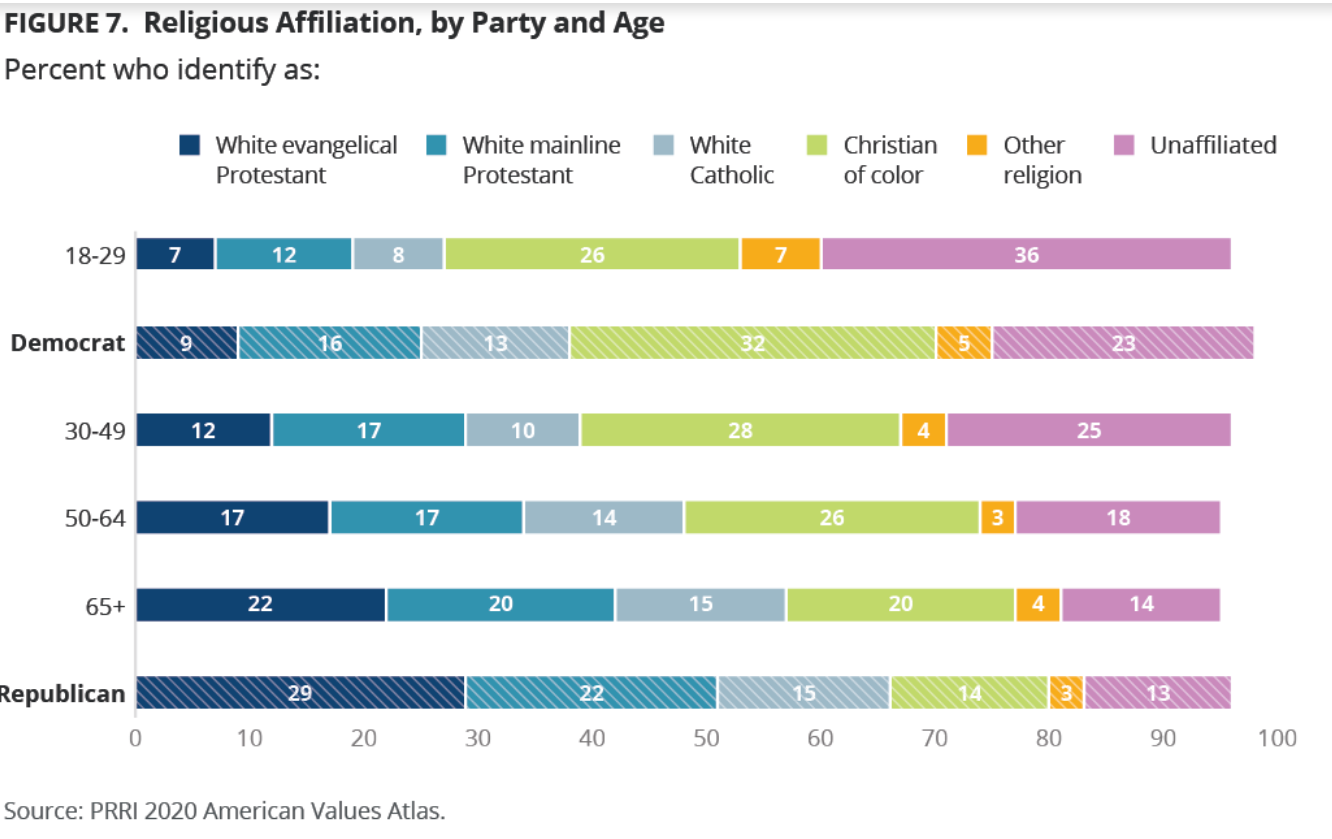
The decline in Whites as a percentage of the US population, combined with the increase in non/other believers has lead to headlines proclaiming the end of a majority White Christian America. This is true statistically, with politicians attempting to take advantage of the situation.

https://www.nbcnews.com/think/opinion/2010s-spelled-end-white-christian-america-ncna1106936