The IndyStar reported on the final recommendations of the “Governor’s Taskforce” earlier this month. I didn’t see much response locally. I believe this is a HUGE opportunity to cooperatively invest in Indiana’s future, by both parties. Indiana’s governor and two houses have been governed by a single party for many years. The historical low-tax, low-service, selective investment strategy has delivered low taxes, responsible local government services, respectable education, solid infrastructure, a diversified economy but mostly growth in just the Indy metro area and lower average incomes for the other 80 counties. The current very low unemployment rates are further squeezing employers reliant upon abundant relatively low wage/skills employees.
Focus. 30 Items are Too Many.
Eliminate One-third of the Lowest Value Initiatives.
Digital development grants. Employers will invest in high ROI projects by themselves.
2. Indiana Talent Agency. No extra bureaucracy.
3. Career Network. No extra bureaucracy. Finding jobs on-line is easy today.
6. College retention incentives. Colleges already have incentives.
10. Immigration reform. Yes, but Indiana will not drive this nationally.
11. Miscellaneous student grants. These would help, but not critically.
12. Transportation funding. Helpful, but not critical.
21. High school diploma flexibility. Critical thinking skills or true CTE skills are essential, Don’t dilute them further.
23. Incentivize CTE credentials. Not needed. If credentials were clearly defined and understood, students and workers would pursue them out of self-interest.
24. STEM curriculum, courses, etc. Focus on schools and teachers first.
29. Scholarship for dual credit completers. These highly talented and motivated students are already moving in the right direction.
Digital Skills (1)
No need for #4 bureaucracy. Basic digital skills should be completed in junior high school. Is the state requirement clear? Advanced digital skills courses should be required in HS and community college for graduation. Make existing courses available for free to firms for remedial on-site training. Make relevant Western Governor’s University courses free. Digital skills should be like “breathing” for Indiana residents. No extra state overhead is required.
University STEM Degrees (2)
No incentives to universities required (5). Provide STEM degree completers with a $25K graduation cash rebate. IU/Purdue (7) should offer more diverse STEM degrees, but so should all Indiana publicly funded universities. Let the students drive the faculty levels.
Career and Technical Education Certifications (3)
Fine-tune the certification program to really recognize workplace, digital, team, industry and technical skills. If the program was recognized like a CPA, licensed plumber, six sigma blackbelt, PMP project manager, Microsoft IT skills, state licensed professional, etc., it would have great value, increasing employee pay and transferable value. (8, 9, 22, 30).
Early Childhood Education (4)
Fund pre-K and K for all. Fix the detailed regulatory limits (13). Defining pre-K detailed results is not essential (26).
Community College (5)
Clearly define “advanced manufacturing” curriculum and degree (1). Reduce community college tuition fees further with state subsidies to encourage universal participation in higher education (like Tennessee). Radically change community college to be local county (or county groups) funded and managed educational institution. Ivy Tech has failed repeatedly as a state-run organization to graduate students. Let local counties decide if they want to invest in education and actively manage this.
Reading (6)
Invest whatever it takes to ensure that all 3rd graders can read at grade level. This is the most essential gateway (28).
Administrative Improvements/Investments (7)
15. Offer employers a $1K fee per class to offer on-site classes.
16. Simplify criminal expungement.
17. Auto enroll eligible students in 21st C scholars.
18. Require HS seniors to file FAFSA.
19. Increase college funding grants for lower income students.
20. Increase credit for prior learning.
28. Fund Dolly Parton library to encourage reading.
High School STEM Classes (8)
25. Allow any person with a BS degree to teach any STEM class at HS and community college level. No need for more detailed subject matter or education course qualifications. They will “figure it out”.
Indiana is not winning the modern global competition for value added jobs and firms. Students and adults must have modern skills. Educational institutions must provide these skills. This requires focused investments and administrative changes.
This is a follow-up article to my recent post on “A Very Robust Long-term US Labor Market (1970-2021). Rather than focus on total growth or the “skill-level” of jobs in the labor market, I want to focus on the roles or functions (like career clusters, similar to industries) played by the 150 million US workers in 2021. I’ve grouped the 500 detailed occupations into 17 categories so that we can look at subtotals ranging from 1% to 20% of the total, with an average of 16%. Enough detail to highlight the very significant changes in the last half-century.
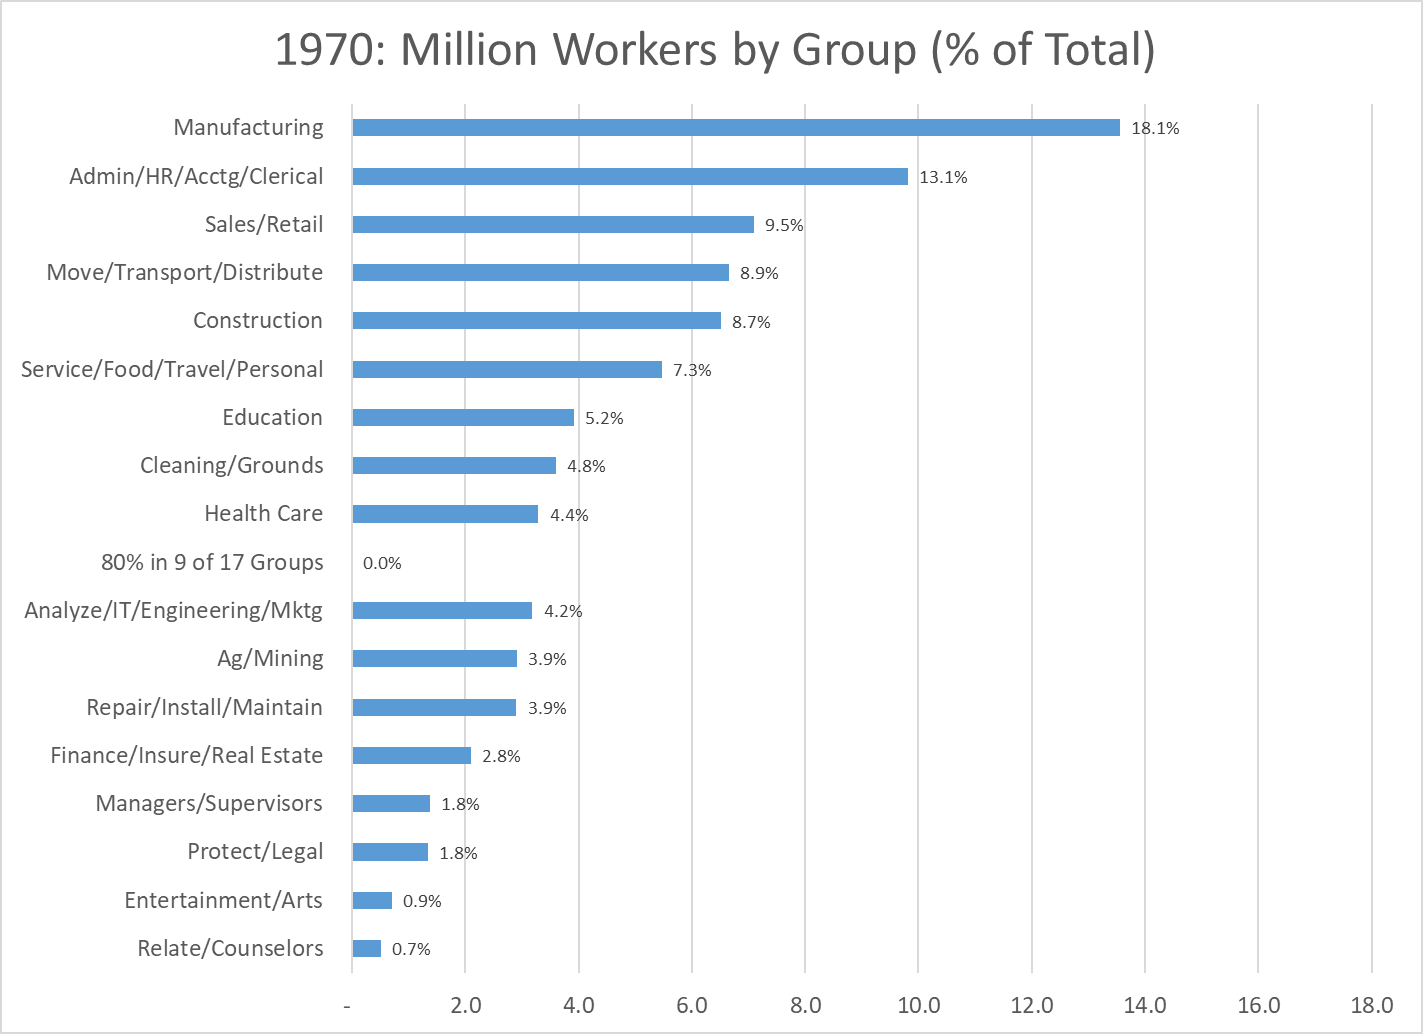
Let’s start with the 1970 data. 75 million employees. Manufacturing was the “big dog”, with almost 14 million workers, 18% of the total, a little less than one out of five.
Administrative workers, including clerical, HR and accounting staff at all job levels were the second largest group, with 10 million people and 13% of the total, one out of eight jobs. These two traditional categories accounted for 31% of the total, not quite one-third.
The next three groups each accounted for 9% of the total, one of every eleven employees. Sales workers, at managerial, professional and retail/clerical levels. Members of the logistics industry broadly defined, including both transportation and distribution staff. Employees of the construction industry. Once again, classic job functions in 1970 that would have been familiar in 1930.
The narrowly defined “service sector”, combining staff in the food service, travel and personal services industries contained 5.5 million workers, or 7% of the total. These six together included 70% of all workers.
Six other categories were each a much smaller 4-5% of the total: Education (KG-post secondary), Cleaning and Groundskeeping, Health Care, Analysis (finance, IT, operations, engineering and marketing), Ag/Mining and Repair/Installation/Maintenance.
The final five categories each averaged just 1.5% of total jobs: Finance/Insurance/Real Estate, Managers/Supervisors, Protection/Legal, Entertainment/Arts and Relating/Counselors.
By 1970 production agriculture had already declined to an immaterial share of the economy. The historically male and blue collar dominated Manufacturing, Logistics, Construction and Repair categories combined to account for 40% of all jobs; two out of five. The historically more female friendly Administration and Sales functions held 25% of all jobs, one in four. Education was the largest “information industry” at 5%, largely dominated by traditional elementary and secondary school teachers. A more broadly defined service group of food service, travel, personal service, cleaning/grounds and health care summed to 17% of the total, or one in six jobs.
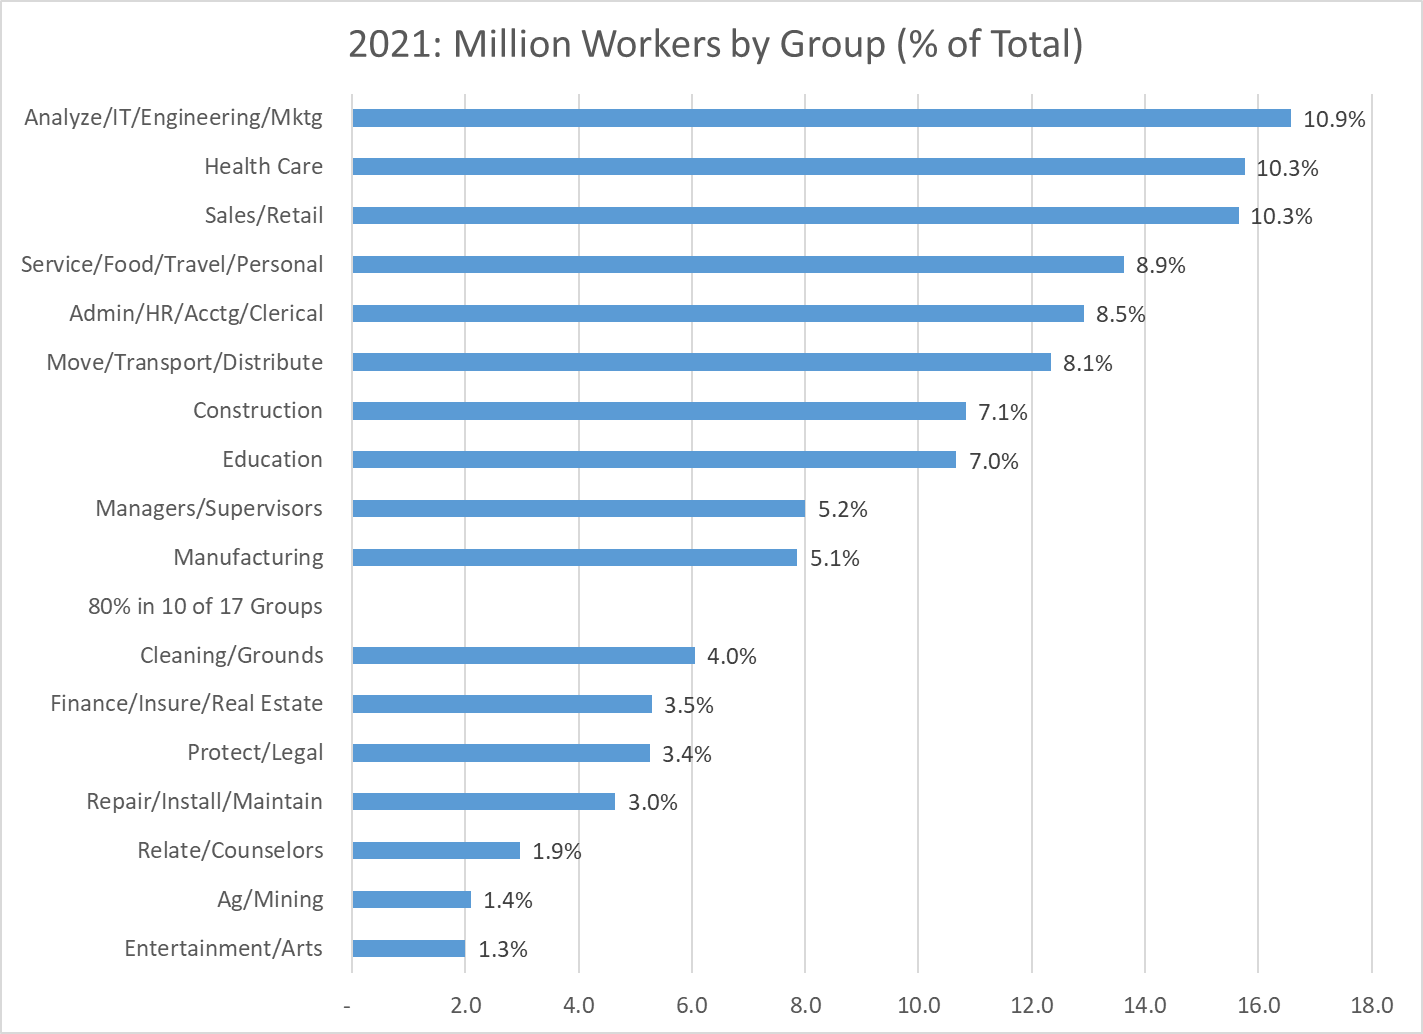
Six categories changed very significantly between 1970 and 2021. Manufacturing dropped from first place to tenth place, from 18% to just 5% of employment, from 14 to 8 million employees. US firms improved labor and overall productivity throughout this period, keeping the most productive firms and factories open, while closing and outsourcing work from the others. This was a tremendous change in the labor market, completed in just two generations of workers.
The Administrative category also declined markedly, from second place to fifth place, shrinking from 13% to less than 9% of total employment, but increasing slightly from 10 to 13 million staff. Process, computer and telecom changes drove improved productivity. Some administrative jobs were outsourced. While the Manufacturing sector lost two-thirds of its labor market share, the Administrative sector lost one-third.
The Ag/Mining group was the third losing category, dropping by nearly two-thirds from 3.9% to 1.4% of all employment. When politicians talk about “reviving” manufacturing, mining or production agriculture they are working against very strong long-term trends.
The largest growth was in the “Analysis” category, which grew by two and one-half times as a share of the total, from 4% to 10%. There was incremental growth in the existing Engineering sub-category, adding 2 million roles. The IT category grew added almost 6 million roles from a base near zero. The operations, finance, marketing analysis group added another 6 million positions to its base of 1.5 million. The “Analysts” category rose from tenth place to first place as firms became more complex and found ways to better employ the talents of individuals with high level analytical skills. At 11% of the economy, one out of every nine jobs falls into the analysis category.
Health Care increased from ninth place to second place, moving from 4.4% to 10.3% of all jobs (2.5X). The number of jobs grew by 13 million, from 3 to 16 million.
The Managers/Supervisors category climbed from fourteenth to ninth place, rising from 1.8% to 5.2% of the economy, adding almost 7 million jobs. The 1970 detailed coding was somewhat different from the modern approach, with many supervisors and managers grouped with other professions or industries. My best guess is that on a comparable basis, the 1970 category would have been closer to 2.5 million than the reported 1.4 million managers and supervisors. This would have put this group in thirteenth place in 1970. Hence, the growth as a share of the total market would be smaller, from 3.3% to 5.2%, but still quite significant. Once again, larger firms with more complexity demanded more managers and supervisors.
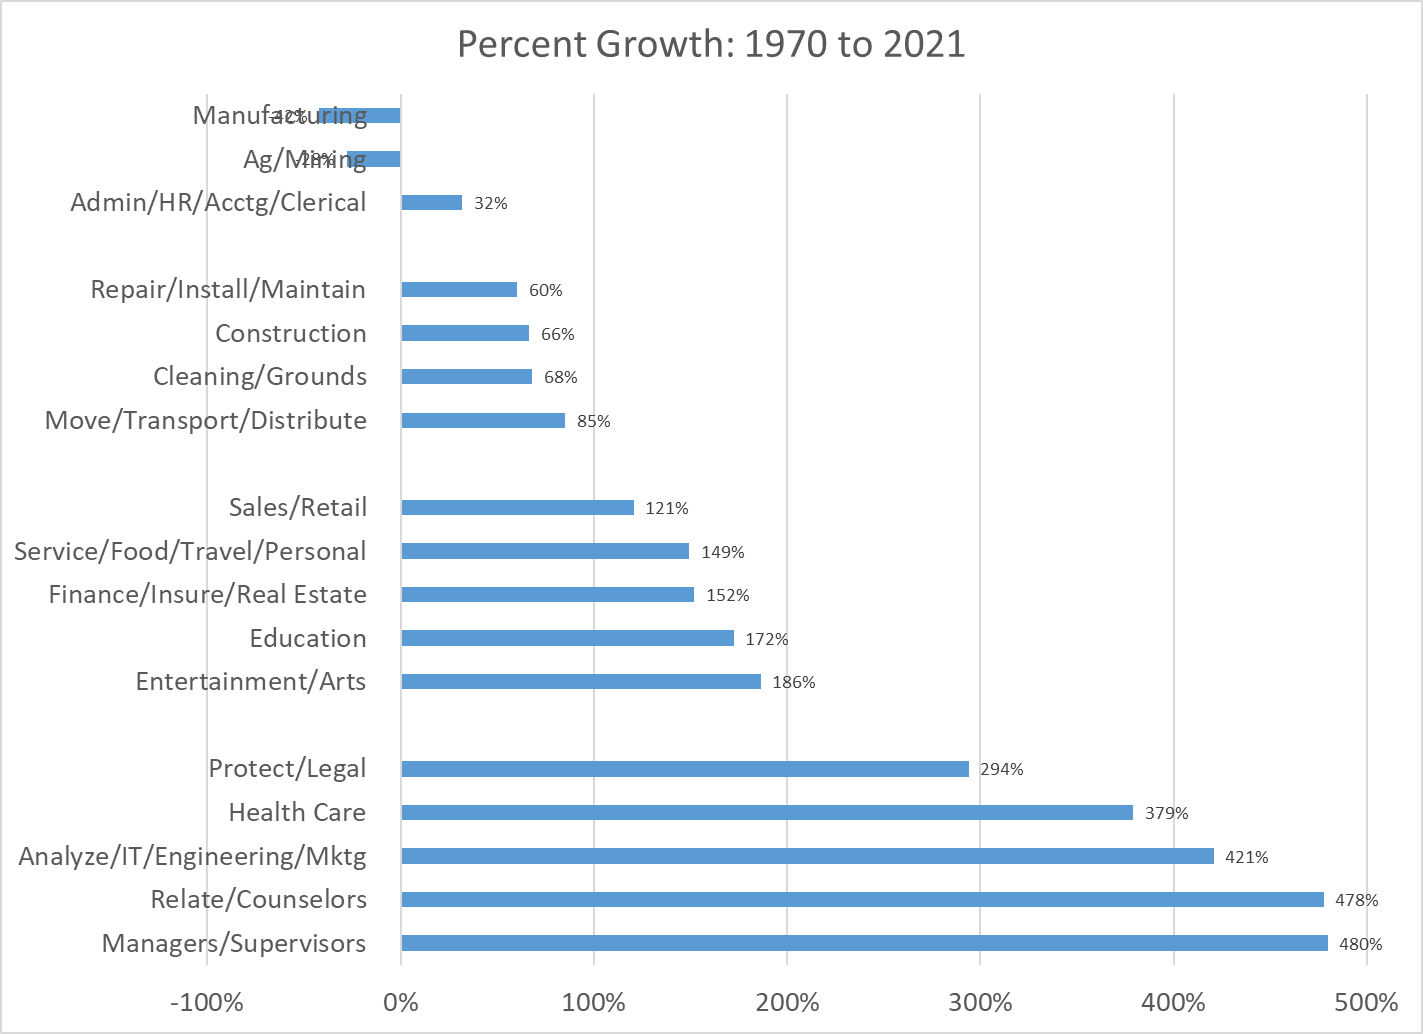
In total, we have 20% (1/5 workers) leaving the Manufacturing, Administration and Ag/Mining sectors and 16% (1/6 workers) joining the Analysis, Health Care and Managers sectors.
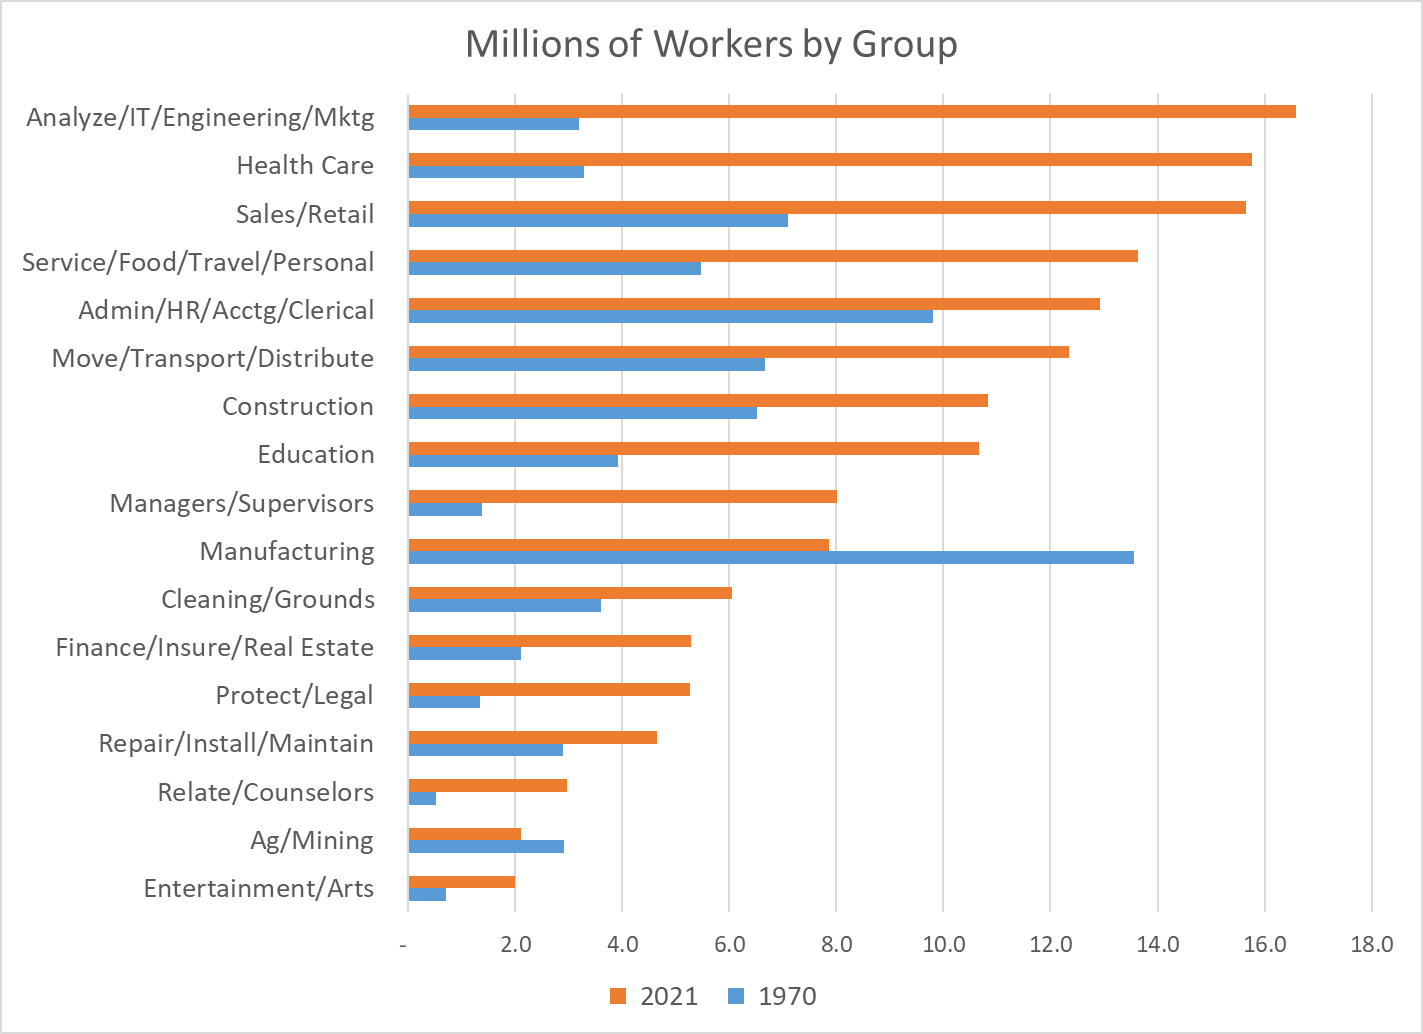
Comparing the millions of employees in 1970 to 2021 by sector clearly shows the massive changes in the labor market. The Health Care and Analysis sectors leapt from a small 3 million workers each to 16 million workers each. Manufacturing fell in absolute terms from 14 to 8 million workers. The Sales and Service sectors began as large sectors, so their relatively normal growth still added about 8 million roles each. Construction and Administration began as larger sectors and were able to add 3 million employees each, despite slower than average growth rates. Logistics grew slightly slower than the market, but added 6 million workers. Education grew faster than average, adding 6 million colleagues.
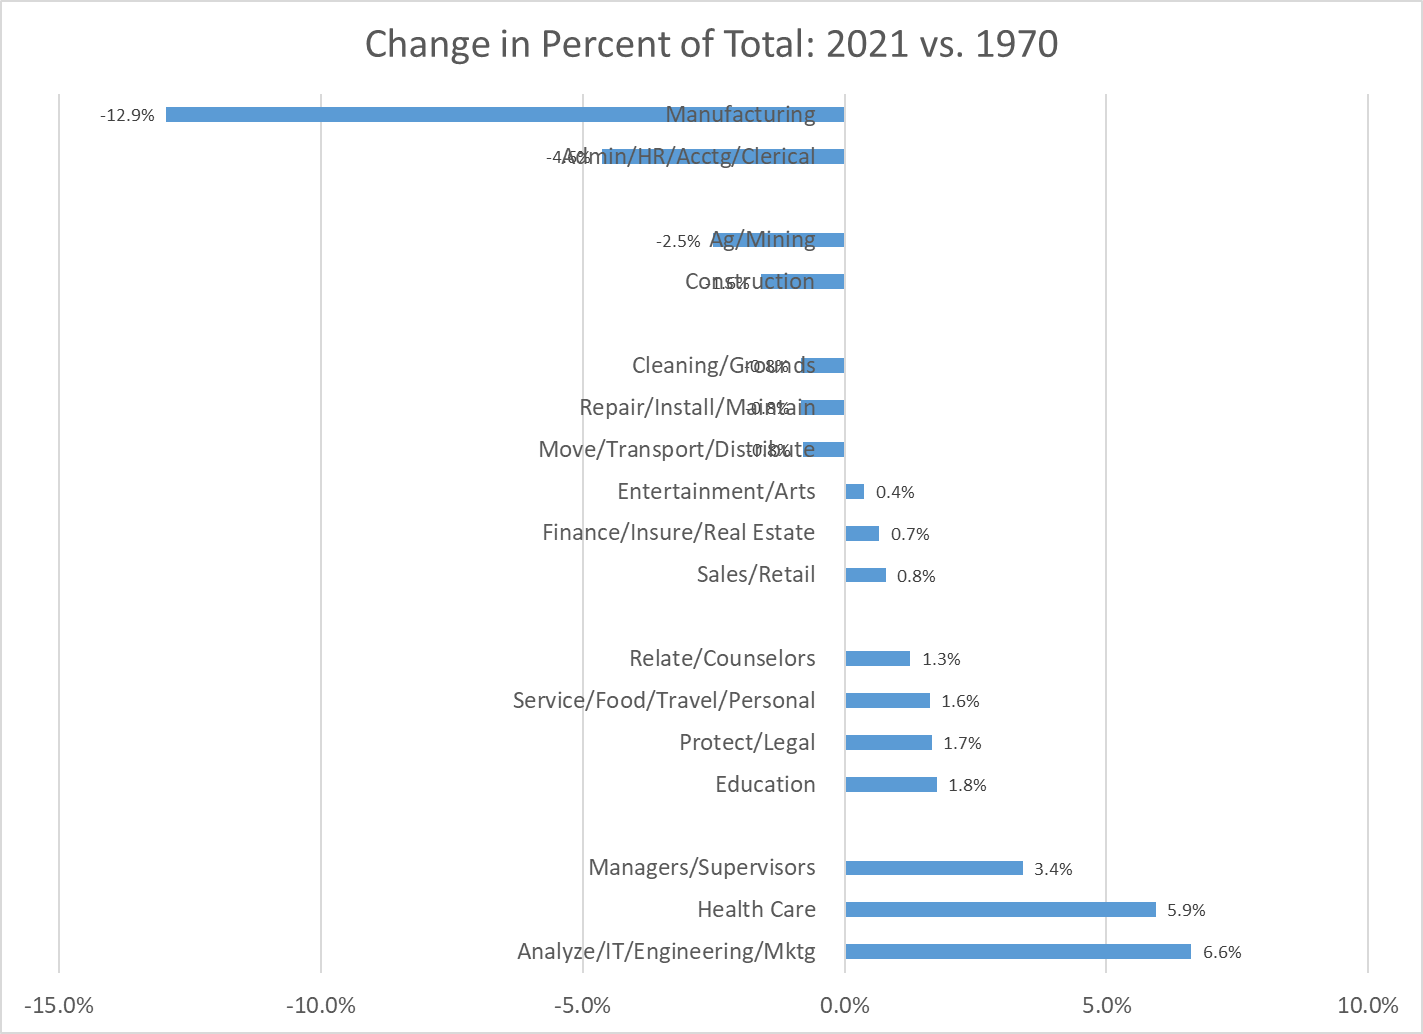
Relative growth rates as a percentage of the 1970 base or as a percentage of the total mostly tell the same story. Manufacturing, Administration and Ag/Mining have declined sharply. Analysis, Health Care and Management have grown materially.
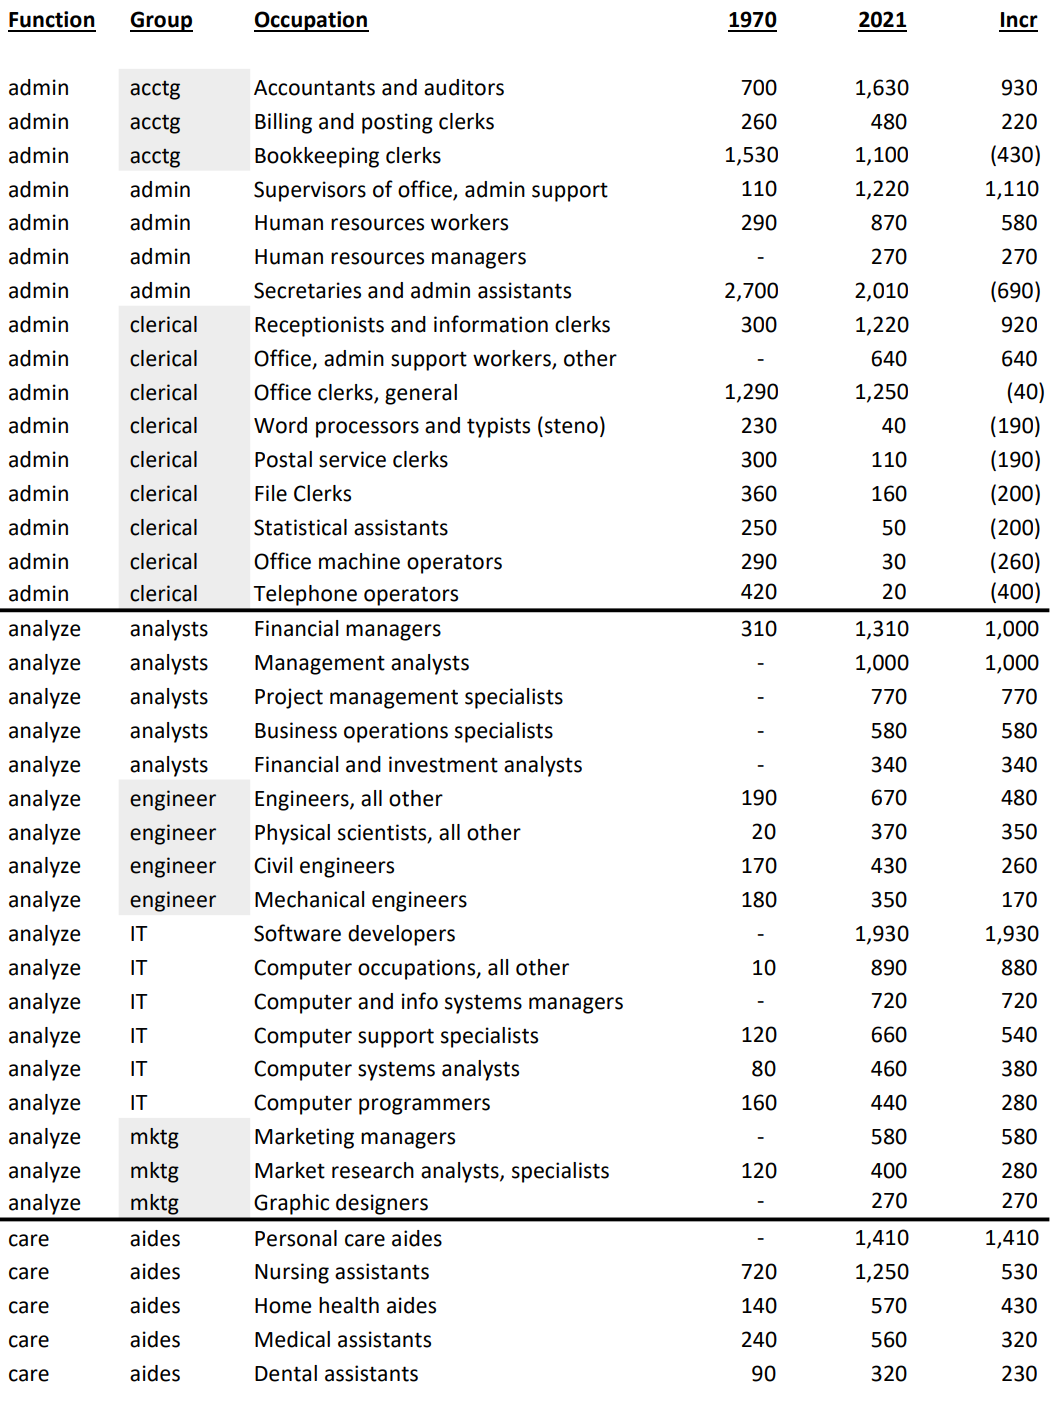
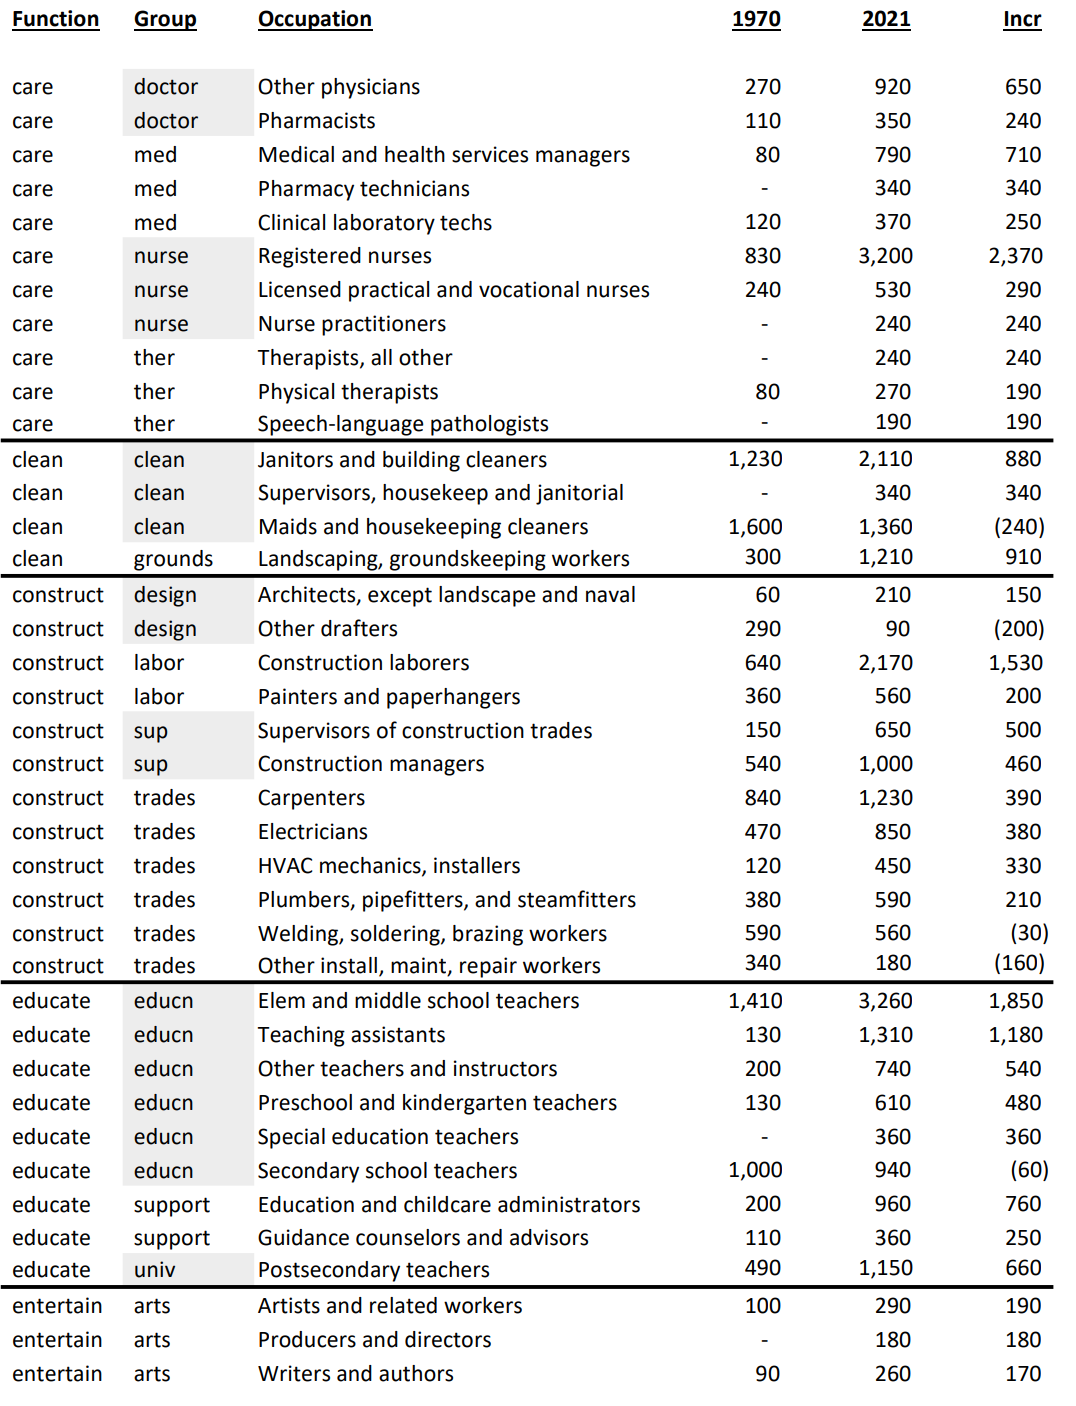
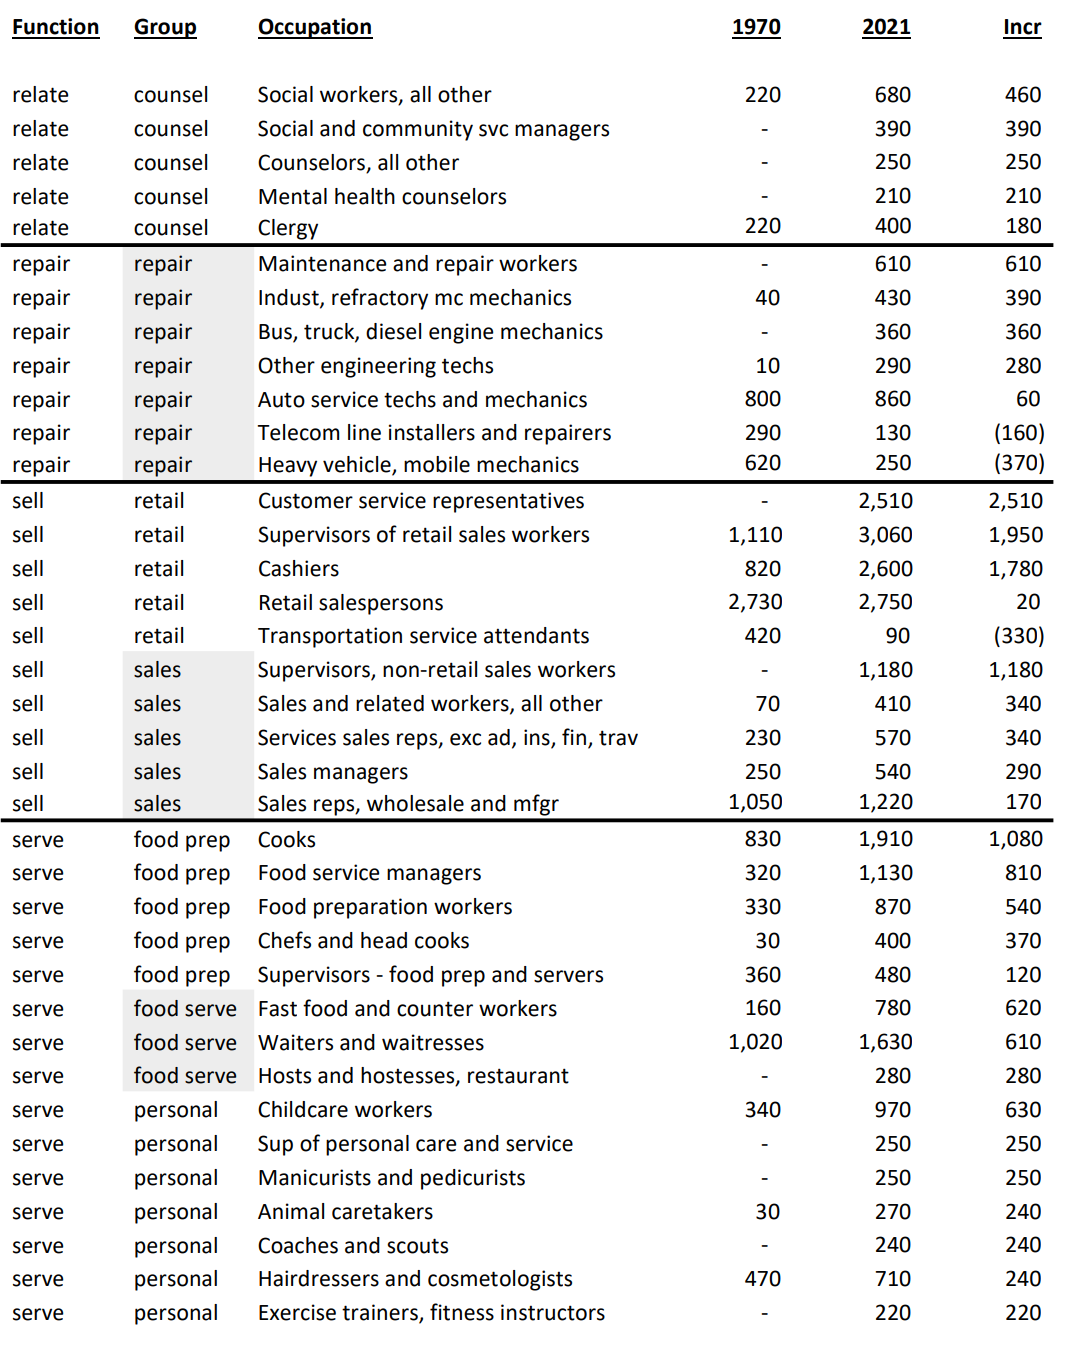
The 152 largest detailed occupations and those with the greatest change in employment are documented below. They account for 91 million jobs, 59% of the 2021 total.
Economists assert that the principles of comparative advantage drive national economic activity. In essence, nations, firms and individuals rationally do what they are “relatively” best at, which changes through time. We see this reduction in the role of agriculture, manufacturing and mining across long periods in the US.
Economists assert that consumers’ tastes change as they have higher income and the relative prices of goods change. Once basic “food, clothing and shelter” needs are met, people turn to other “needs” and “wants”. These tend to be “services” and we also see this transformation.
Economists assert that profit maximizing firms will employ labor that provides a return on the investment based on the marginal or incremental value added by the labor resource. In a more complex economy, professional and managerial skills are in greater demand. Firms (and not-for-profits and governments) have adapted very well to these major changes in the last 50 years.
These changes are not without major pain to individuals, firms and local economies. The general trends in the economy (more automation, greater trade/outsourcing, more services, more personal care, greater role for analytical skills) are clear. Nations, firms, individuals and regions that adapt to the trends will be relatively successful. This requires wise individual and political choices and investments.
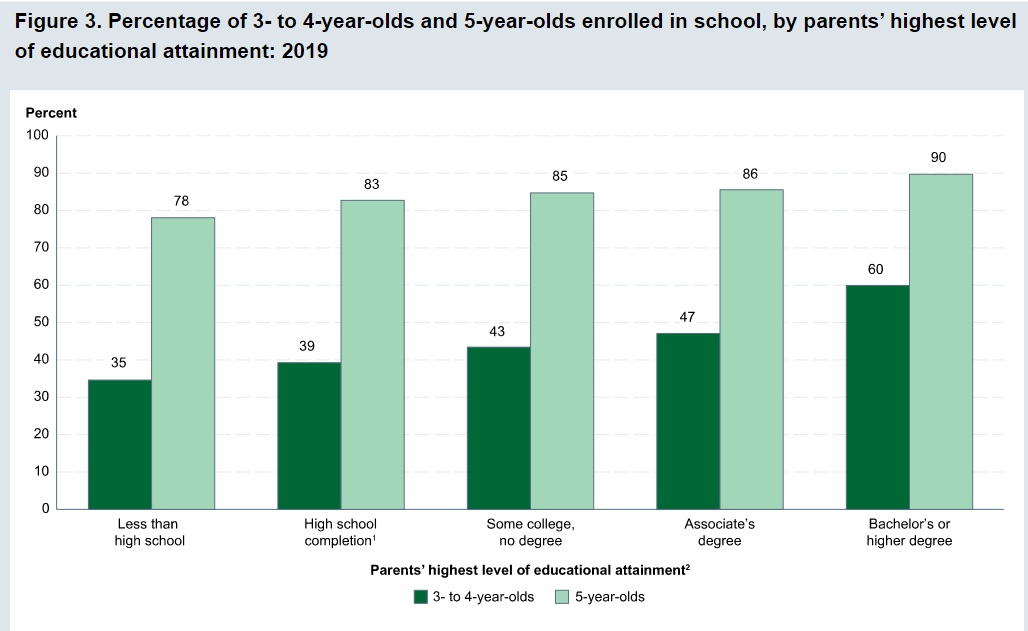
Higher Educated Parents Enroll Their Children at Somewhat Higher Rates, Especially at Ages 3-4
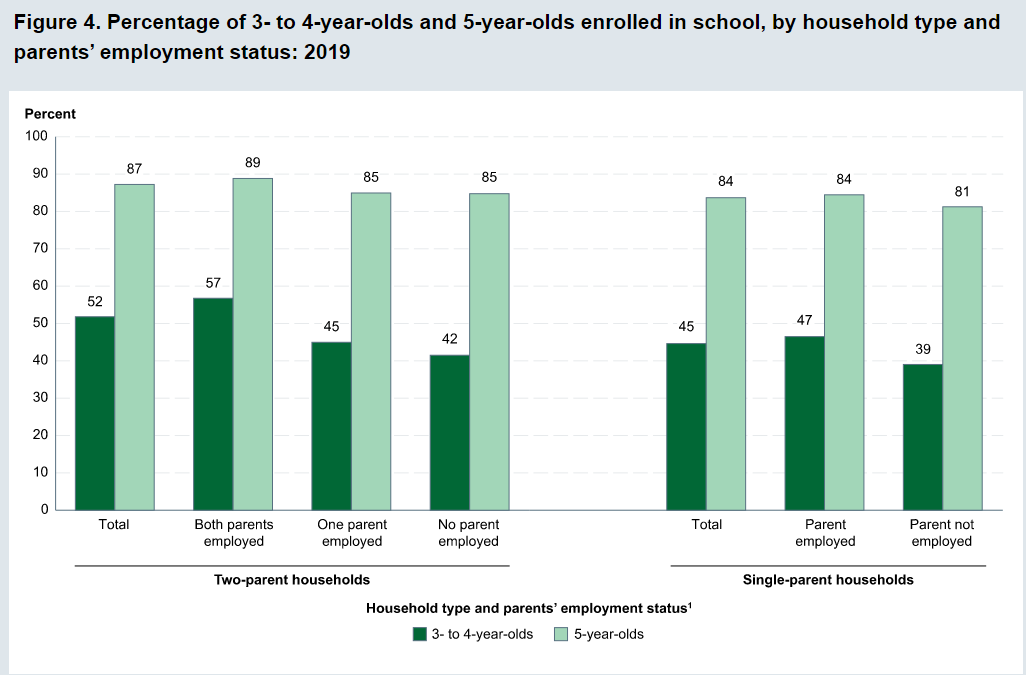
Single Parents Do OK, But the Unemployed Lag
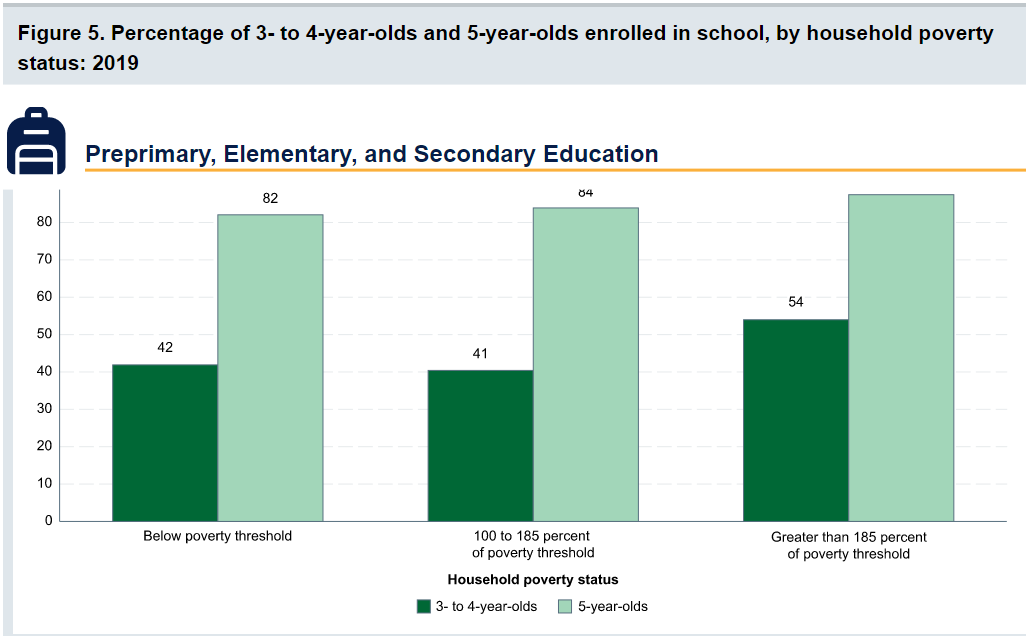
Poverty Level Has Limited Impact for 5 Year-olds, But Real Impact for 3-4 Year-Olds
Comments
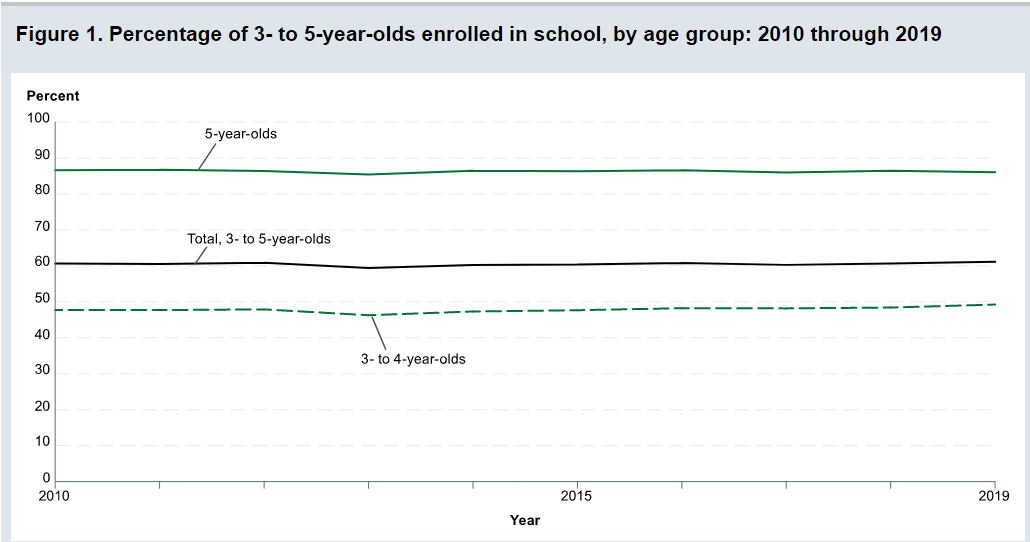
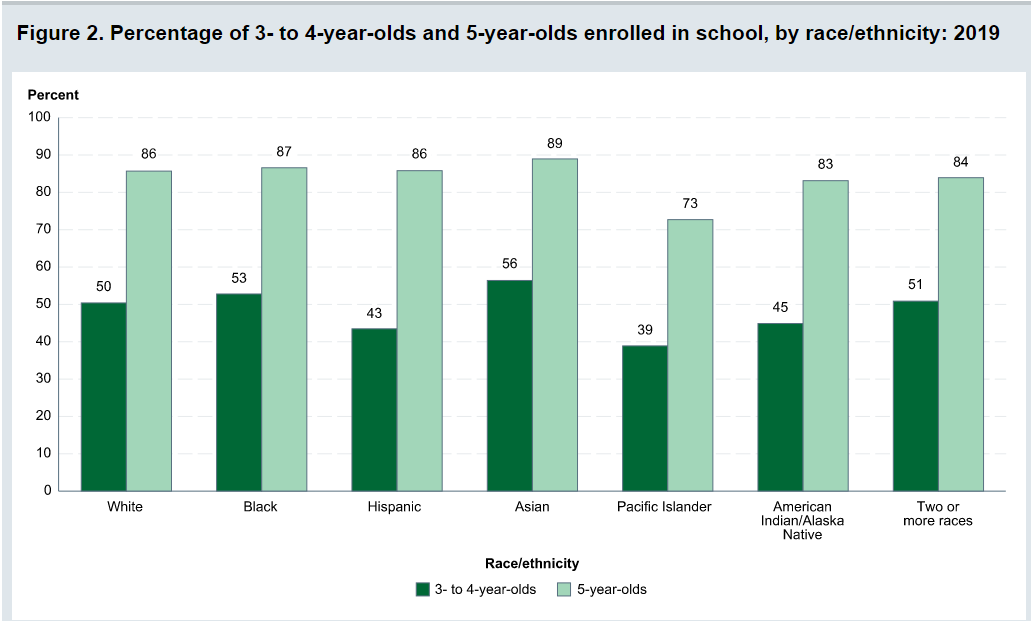
Research has shown that pre-school education can help children to prepare for school. More than 5/6 5 year-olds attend some kind of formal education. About one-half of 3-4 year-olds are enrolled. Some of the non-enrolled children could benefit from formal programs. State and local programs and funding could help these individuals. Access for 5 year-olds is relatively equal across groups, but access for 3-4 years-olds differs more significantly based upon race, income, household status and employment. There is room for improvement.
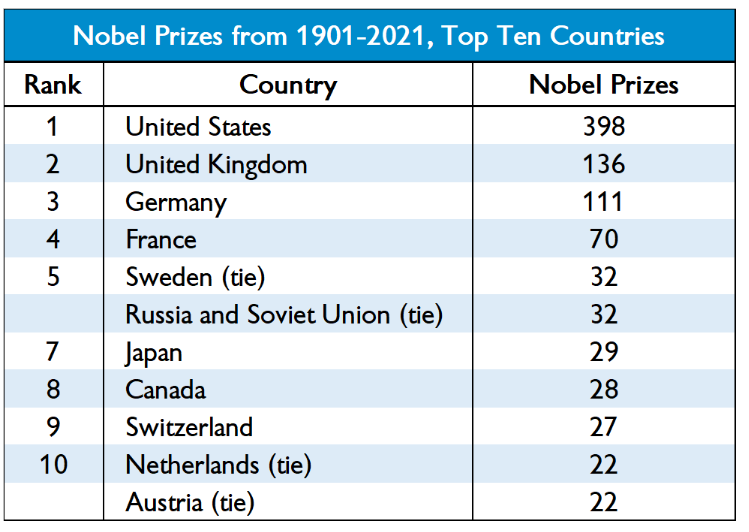
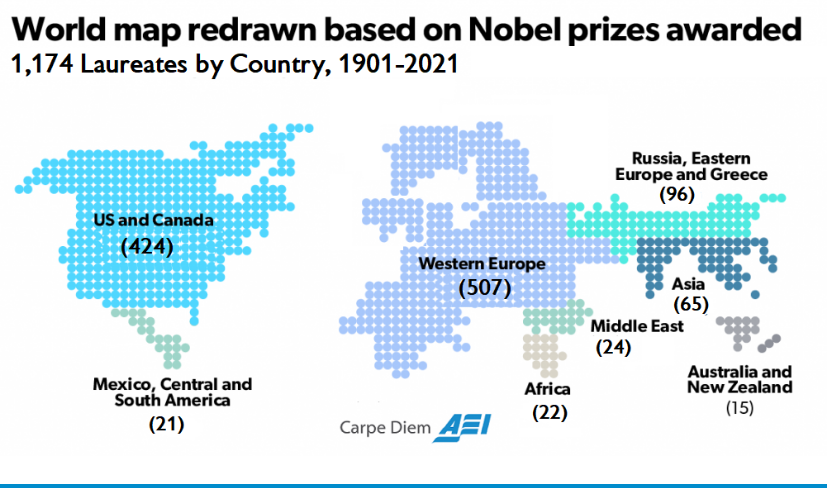
Various global university rankings use different measures and methodologies. US universities lead the way in all major rankings, averaging 18 of the top 30 spots, good for 60% of all world leaders.
Few of us will consider attending these institutions, but they do educate many of our college professors, they educate many of our national business leaders and their research is used in most fields of endeavor.
The overall US labor force participation rate is the ratio of those employed plus those actively looking for work among the non-institutional (military, prison, etc.) working age (16-64) population. It rose a quite substantial 8 points, from 59% in 1950 to 67% in 1990, mainly due to increased female participation rates. It remained in the 66-67% range through 2007, before declining by 5% in the last 14 years, a quite rapid decline. Note that the years selected are the ends of business cycle expansions plus the current year.
The overall rate mirrors the White rate as White’s make up the largest share of the population and because other racial participation rates are similar to the White rate. Black labor force participation has followed the White pattern, but been 2-3% lower than the White rate for most periods. The Hispanic rate started just below the White rate, but exceeded it by 1990, growing to a 3% advantage in 2021 at 65% versus 62%. The Asian participation rate has matched the White rate, sometimes being 1% higher.
The decline in the White share of the US population, especially in new births and school age children has been highly publicized and politicized for 40 years. The White share of the population has fallen from 5/6ths to just 3/5ths since 1950. African-American share grew by 2% in the 50’s and 60’s before settling at 12%. The Hispanic population has grown rapidly, from just 2% to 19%, passing the Black share by 2001. The broadly defined Asian population has grown from less than 1% to 6%. This breakdown does not include multi-race categories, which now amount to 3%. For labor force participation purposes, racial composition plays a minor role in the total rate.
Male participation in the labor force has fallen by 20 percentage points, from 87% to 67%. The increase in the 65+ age group from less than 4% to almost 8% of the total population accounts for more than 4% of this 20% decline, but 3/4ths or more is due to other factors. Female participation rates, working against this same 4% reduction due to the mix of older residents, grew from just 33% to a peak of 60% in 2001 before declining by 4%, about half of the male decline from 2001 to 2021. The expansion of opportunities for women and their choices to pursue the opportunities in the US is well understood. The increased share of aged 65+ women accounts for almost 3% of the 4% female decline. The reduction in male labor force participation is the big story.
Women, aged 55+ averaged just 22% participation through 1990. Most of the increased labor force participation in these 40 years was among younger women. More than one-third (35%) of women aged 55+ are now active labor market participants.
Their male counterparts in this age bracket show a 21 point decline, mirroring the overall male decline, but starting at the lower rate of 67% and ending at 46%. There is a mix variance here, as 55-64 year olds made up 4% of the population in the first 50 years, but now account for 6%, while the 65+ age group started at 4% for the first 25 years and then grew to 8%, so the share of 65+ citizens out of the 55+ total has risen from 45% to 56%. The mix variance accounts for a 5% decline in the participation rate, but the other 16% is due to other factors.
Demographers refer to the 25-54 year age group as the prime labor force. Here, we see women double their participation rate from 1950 (39%) to 2001 (77%) before falling off a bit to 74%.
For prime age men, we see a 9% point drop, from a near universal participation rate (97%) in 1950-60 down to 88% by 2018.
The White women data follows the total. A majority of Black women were labor force participants in 1970, 10 points higher than White women. They increased their labor force participation by 14 points, to a peak of 65% in 2001, before falling back by 5 points to 60% in 2021. This generally matches the pattern of White women, except that Black women have averaged an extra 4 participation points. Hispanic women started between the other two groups, at 45% in 1970 and then climbing to 60% in 2001. Their participation has remained close to 60%. Overall, relatively minor racial differences in female participation. About a 25 point increase in the second half of the 20th century followed by a 2 point decline in the last 20 years.
White men make up the largest share of the male total, so their data is close to the total, declining by 18 points, from 88% to 70%: from 7 out of 8 in the labor force to just 7 in 10. Black men follow the same Total pattern, but are consistently 4% less active in the labor market versus White men. Hispanic men first appear in the data in 1970, with an 85% participation rate, just above the 83% White male rate. However, Hispanic males stay at this level through 2007, while the White rate falls by 7%. In the last 14 years, the Hispanic male participation rate has dropped by the same 5% as the White and Black male rates, ending at 79%, 9 points above the 70% White rate.
Let’s start with the prime age labor force (25-54). From 1950 to 2001, we see a 19 point increase, from 65% to 84%. This is all due to the increase in female participation, which more than offset the significant decline in male participation. In total, from an economic point of view, this is great news. The total participation rate has slipped back a bit, from 84% to 81% in the last 2 decades, with men and women both falling back, but men falling faster. Aside from the distortion of the baby boom when it declined to 46%, the prime age group has typically been about 52-53% of the population. It has fallen by 1% in the last decade as the growth in older population groups has been faster than the decline in the childhood group.
The non-working age 0-15 year old childhood group reached a full 31% of the population total in 1960 and has since fallen to 19%. From an economic point of view, this too is good news, as the dependency ratio of non-workers to workers declines.
The teenager participation averaged 46% from 1950-1970. It averaged 55% in the mid-70’s to mid-90’s, but has quickly declined to just 34% in recent years. As teenagers make up 11% of the working age population, this drives a 2% decrease in the overall workforce participation rate. From an economic point of view, it is possible that the other activities of teens today are more valuable in creating human capital than the part-time entry level work that many more were performing in the 1970’s-90’s.
The labor force participation for young 20’s rose quickly from 64% to 77% by 1979 with increased participation by young women in the economy. The rate has declined to 70%. As this group accounts for 11% of the work age population, this has driven a nearly 1% point decrease in the overall work age participation rate.
The 55-64 year old group has a different pattern, averaging 61% in the 1950’s to 1970’s, decreasing 5 points to 56% in the mid-70’s through mid 90’s, before growing all the way back to 65% recently. The increased female participation rate did not impact this group significantly. During the 1975-95 time, more men took advantage of early retirement possibilities, some forced and some voluntary. This group increased from 9% to 12% of the total population. The 9 point participation rate increase since 1990 adds about one and one-half points to the overall participation rate, offsetting some of the 16-25 year old reduction.
The 65+ group pattern is similar to the 55-64 year olds, starting above 20%, falling down to 11% and returning to 20%. Economically, this recovery adds to the nation’s output, even if this group is not considered part of the work age population. This group has more than doubled as a share of the total population, reaching 15%.
With men and women combined, the total participation rate drops 5 points, from 67% in 2001 to 62% in 2021. The prime age group accounts for one-half of the working age population and shows a 3 point decline from 84% to 81%, with a one and one-half percent negative impact on the total rate. The significant declines in the 16-25 age group drives the rest of the 5 point decrease.
Data on labor force participation by educational attainment for ages 25-64 is available for 1970 through 2018. During this nearly 50 year period, the total participation rate increased from 70% to 79%, with a peak of 81% in 2001. Recall that the official total participation rate included the 16-24 year age brackets where participation fell significantly. We have only a 2 point decline from 2001 to 2018 rather than 5 points.
The big take-away is that participation rates for each group don’t change much through time. Those who didn’t complete high school average 61% pretty consistently. There are changes in the male and female participation rates and racial composition rippling through the data, but on average 3 of 5 people without a high school diploma participate in the labor market.
High school graduates average 76%, with a 3 point decline to 73% for 2018.
Individuals with some college classes have averaged 82% participation, except in 1970 when it was only 74%.
Those holding a college degree have averaged 86% participation, except in 1970 when they averaged 82%.
The proportion of citizens in each group has changed dramatically. Less than high school graduates dropped from 45% to just 10% of the post college working age population. College degree holders increased from11% to 35%. College attendees grew from 10% to 26%. High school grads started at 33%, increased to 38% and then declined to 29%. In total, the country shifted one-third of the population from non-high school education to college degree holders (BA and AA).
Given the consistency of labor force participation by level of educational attainment, the overall increase from 70% to 79% makes sense. Applying “typical” participation rates to each group (61.8, 74.5, 80.5, 85.7) produces an estimated participation rate for each year: 70, 73, 74, 77, 78 and 79. The 1990 and 2001 years stand out as having significantly higher actual than estimated labor force participation rates (+5 and +4). Perhaps some of the decrease in various rates since 1990 is due to there being an unusually high participation rate during this period as the economy expanded for relatively long periods with relatively mild recessions.
The prime age category is more than one-half of the labor force and contains individuals with the greatest earning power. Most attention has been focused on the 3 point drop from 2001 to 2021. It is also important to note the 19 point increase from 1950. We have data for men and women in this age group. Female participation essentially doubled from 1950 to 2001, before flattening out (down 2 points).
The male participation rate declines throughout the 70 year period, not just in the last 20 years. It falls from near universal 97% to 88%, meaning that 1 in 8 prime age males is not in the work force. As usually, the White rate matches the Total rate. Hispanic men have seen a 5 point decline from 1970-2018 while Whites fell 8 points. Hispanic men in 2018 had a higher participation rate than Whites. Black men started 7 points behind Whites at 90% and declined by an even larger 11% to just 79%. Whatever factors are driving prime age White men out of the labor force appear to be negatively impacting Hispanics and Blacks as well.
The overall participation rate for work age individuals (16-64) increased from 59% in 1950 to 67% in 1990 and has since dropped to 62%. The prime age group (25-54) increased from 65% to 84% before sliding back to 81%. For various age groups, the female participation rate doubled from mid 30 percent to high 60 percent range between 1950 and 2000 before slipping back a little. This drove the overall participation increase through 2001. The male participation rate for ages 16+ fell from 87% to 67% between 1950 and 2021. The prime age male (25-54%) rate dropped from 97% to 88%. Similar declines were seen for all races. The Obama white paper above (CEA) provides relevant details. The IBD article below is a good summary of this situation.
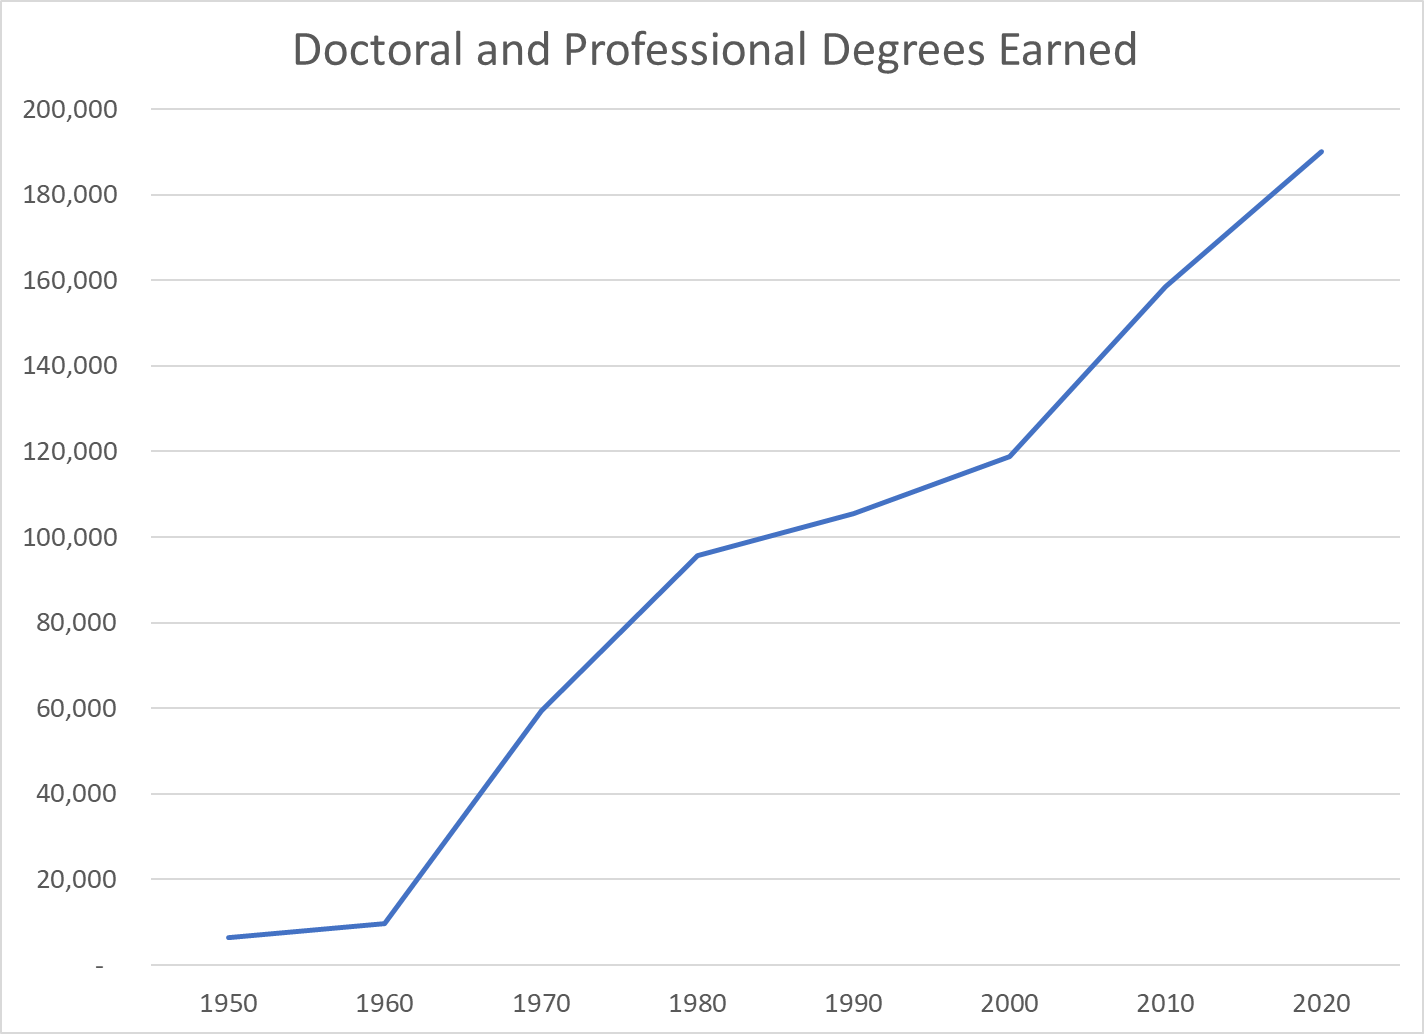
STEM degrees awarded at the bachelors, masters and doctoral level continue to increase in response to market demands from 2011 to 2019, increasing by 54% in total and by 45% for U.S. residents. Most of the increase has been at the bachelors level, from 255,000 to 379,000 degrees (+49%). Masters degrees have increased from 53,000 to 72,000 (+36%). Doctoral degrees have increased from 14,000 to 17,000 (21%).
African-American degree earners have increased by 46%. Hispanic Americans have increased by 137%. Asian-Americans have increased by 57%. White Americans have increased by 28%, from 224,000 to 287,000 (+63,000).
US resident male degree earners increased from 210,000 to 297,000 (41%). Female degree earners increased from 112,000 to 171,000 (52%).
By contrast, the US population increased by just 5% during this period, from 312M to 329M.
I don’t find many news stories highlighting this very good news. In a world that requires technological innovation, application, maintenance and understanding, the US is quickly increasing the number of graduates with these skills. Women and minorities are increasing their relative share of the graduates in these subject areas, which historically have been well paid.
There is room for improvement. Women and minorities are still underrepresented. They graduate at lower rates than white whites. Non-residents earn a significant (19%) share of US degrees awarded.
Bottom line: US residents are earning about one-half million STEM degrees each year. This is double the one-quarter million degrees awarded in 2000. Note that compounding of 31% and 54% growth yields 102% total growth, not just 85% (a core STEM skill).