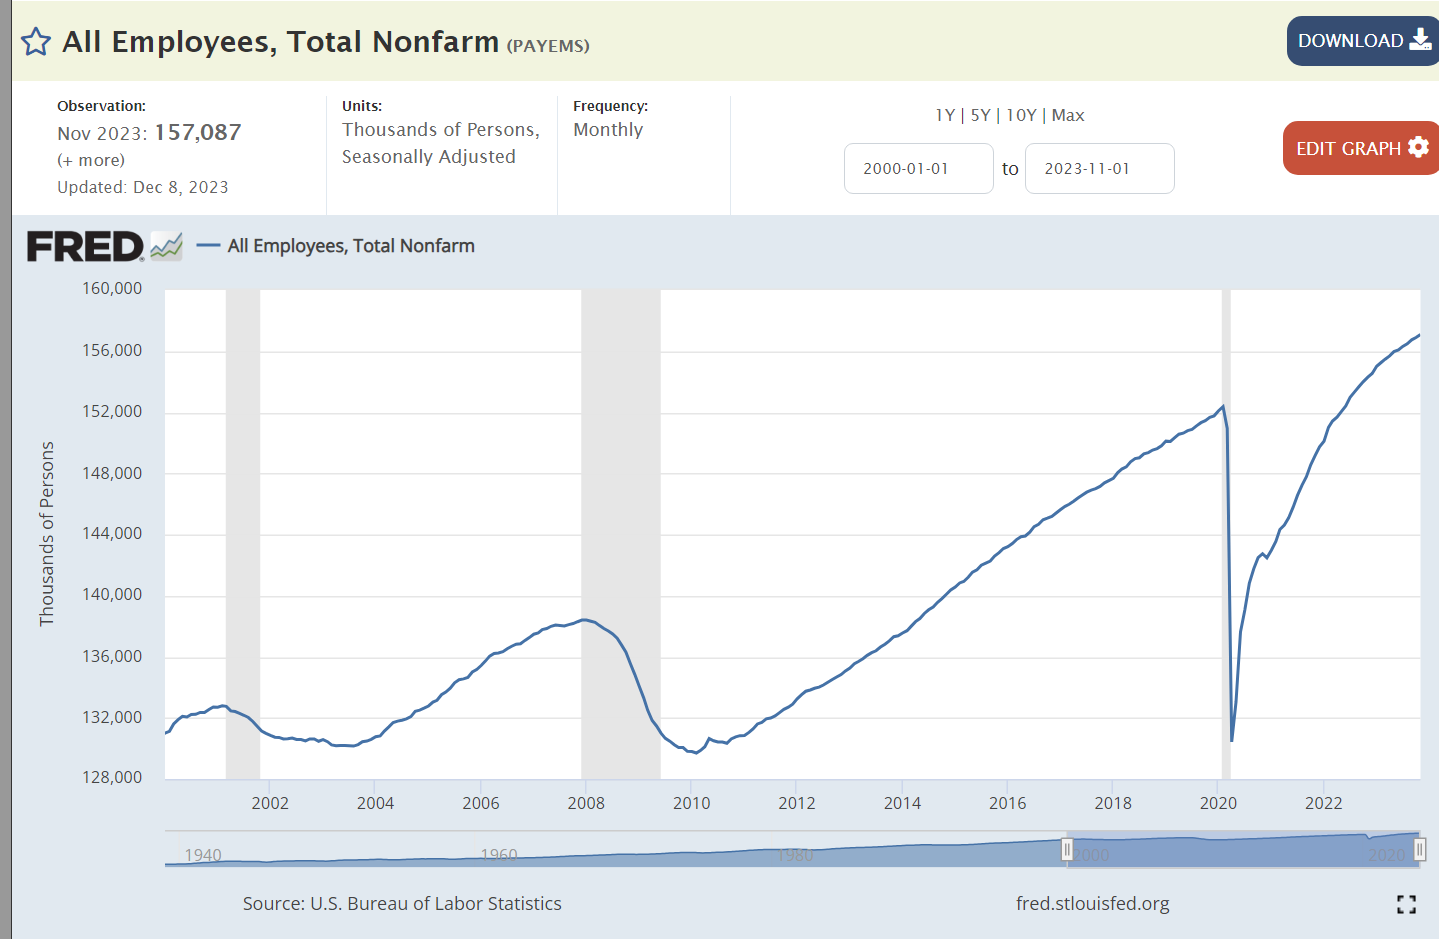
Economists prefer to measure data at business cycle peaks and troughs. After the Millenium Y2K scare, we endured a mini recession. Employment peaked at 132.8 million jobs in March, 2001. Today, in October, 2023, we have 156.9 million jobs, an increase of 24 million jobs in 22 1/2 years, almost 1.1 million new jobs created each year! This is despite the job destroying effects of the Great Recession and the Pandemic.
The longest business expansion in US history ended after 10 years in February, 2020. The pandemic eliminated almost 22 million jobs in 2 months, leaving the economy with just 130.4 million employed, barely above the trough of 129.7 million in February, 2010.
The economy replaced those jobs in just 26 months when the June, 2022 figures were reported! In addition to replacing the first 22 million jobs, the economy has added another 4.5 million jobs in the last 16 months, averaging 280,000 per month or 3.4 million per year! At the same period after the Y2K recession, the economy averaged 2.6 million new jobs per year. At the same period after the Great Recession, the economy averaged 2.8 million new jobs per year. Our economy averages 1 million new jobs per year and can accelerate to 3 million per year when recovering from a recession. The current recovery is stronger than either of the last two.
Another way to gauge progress is to measure jobs added from peak to peak. The economy added 5.6 million net new jobs by December, 2007, or 836K per year. In the 13 years until February, 2020 the economy added 22.7 million jobs, or 1.141M per year. Since then, the economy has added 4.5 million jobs, or 1.240 per year, a very solid result.
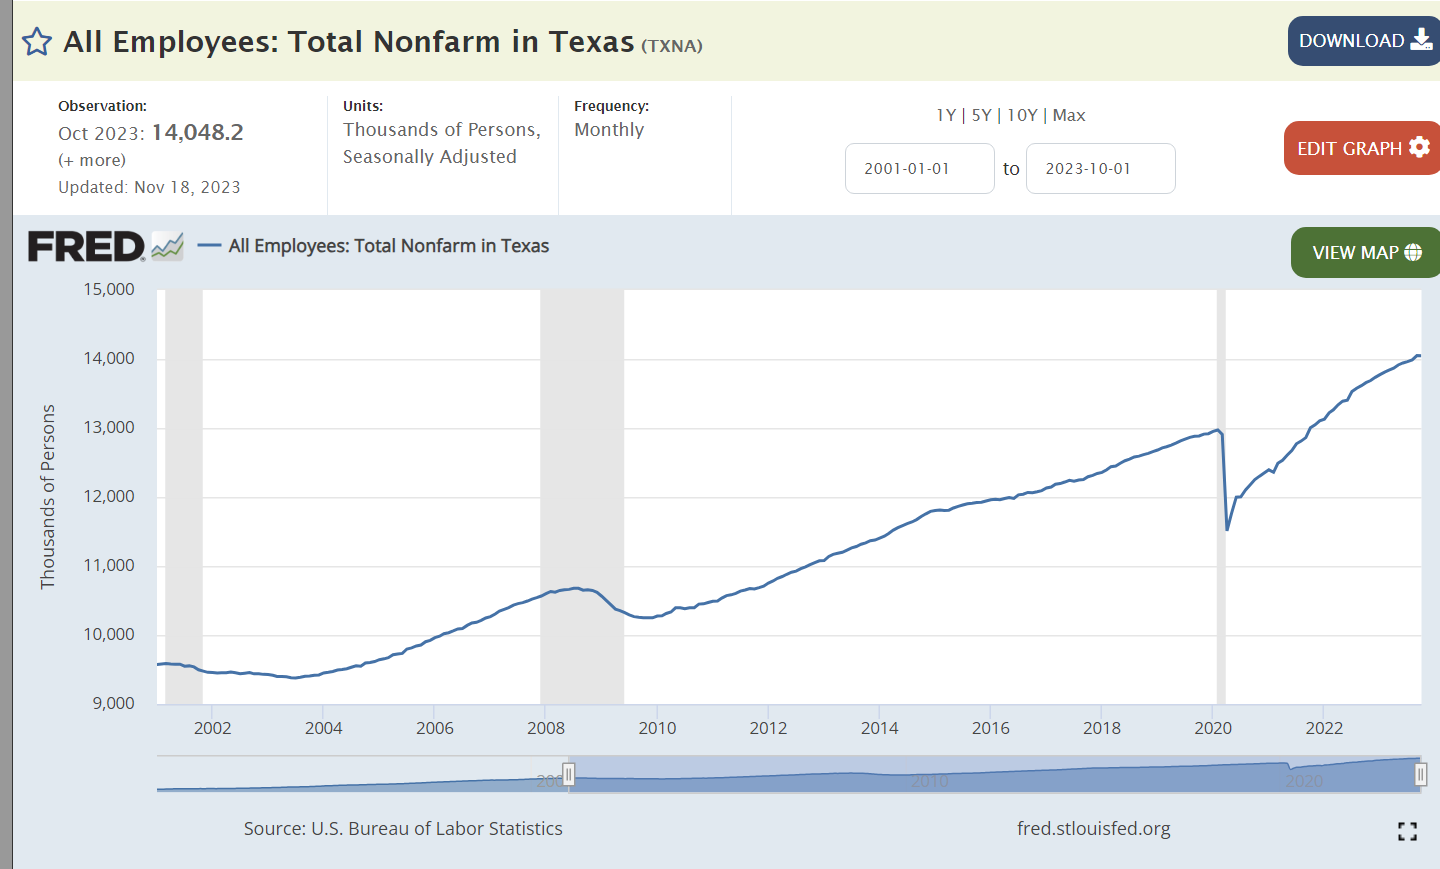
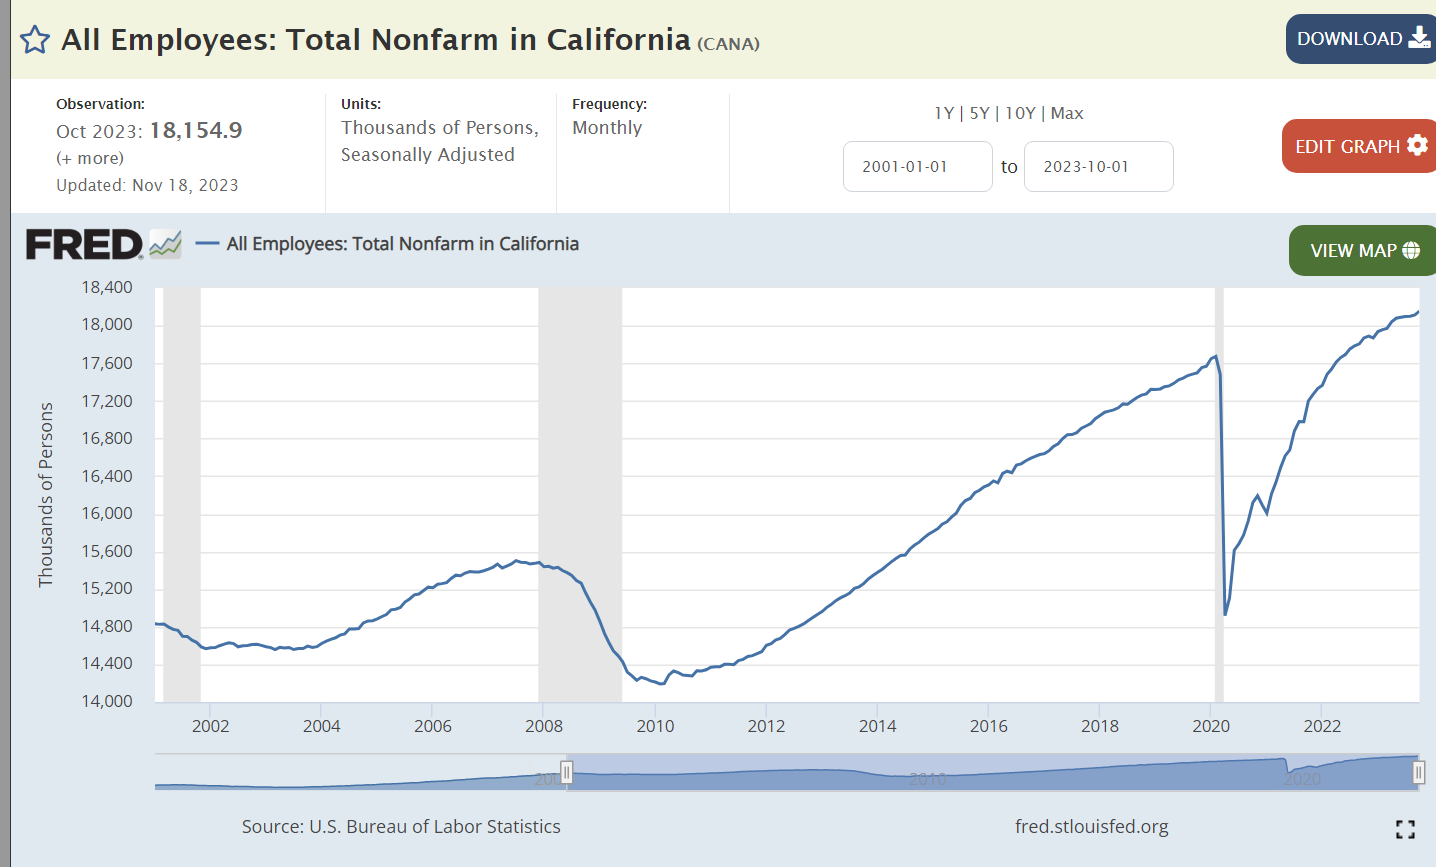
Where are the extra 4.5 million jobs? 38 states exceed their pre-Pandemic totals. Texas (1.1M), Florida (750K), California (500K), North Carolina (300K) and Georgia (250K) lead the way. Arizona, Utah, Tennessee, Nevada, South Carolina, Washington, New Jersey and Indiana each added at least 100K, for a total of 4 million by these 13 states. On the downside, New York remains 125K short and Vermont, DC, Hawaii and Rhode Island are more than 2% below February, 2020.
The post-pandemic economy is creating jobs slightly faster than the post-Great Recession economy. 17 states are growing at least 2% faster than their pre-Pandemic trend rate. Idaho, Nevada, Montana, Utah and Florida are growing at least 4% faster than before. 9 states trail their prior growth rates by at least 2%. North Dakota, Hawaii, New York and DC trail their prior growth rates by 4% or more, for various reasons.
During the full 23 years, Texas (4.5M), California (3.3M), Florida (2.7M), New York (1.1M) and North Carolina (1.0M) added the most jobs. Washington, Nevada, Arizona, Utah, Colorado, Tennessee, Georgia and Virginia each added more than one-half million, for a total of 18 million in the 13 leading states. While the nation added 18% more jobs during this period, 9 states grew by 3% or less: Louisiana, Mississippi, Illinois, Michigan, Ohio, West Virginia, Rhode Island, Connecticut and Vermont. These states accounted for more than one in six citizens in 2001, so their weak performances limited the overall economy.
Summary
The economy started the 21st century slowly with a small recession and weak jobs growth during the Bush years. Obama started his first 2 years with a 9 million job deficit before starting a very strong and long 10-year recovery that added 23 million jobs. Economists did not expect the recovery to last during the Trump administration but almost 9 million net jobs were added on his watch before the pandemic. Biden refilled the 22 million lost jobs in 26 months and has added 4.5 million more in the next 16 months. With the Fed’s higher interest rates, job growth is slowing but is generally expected to exceed 1.25 million in 2024. The US economy continues to outperform.
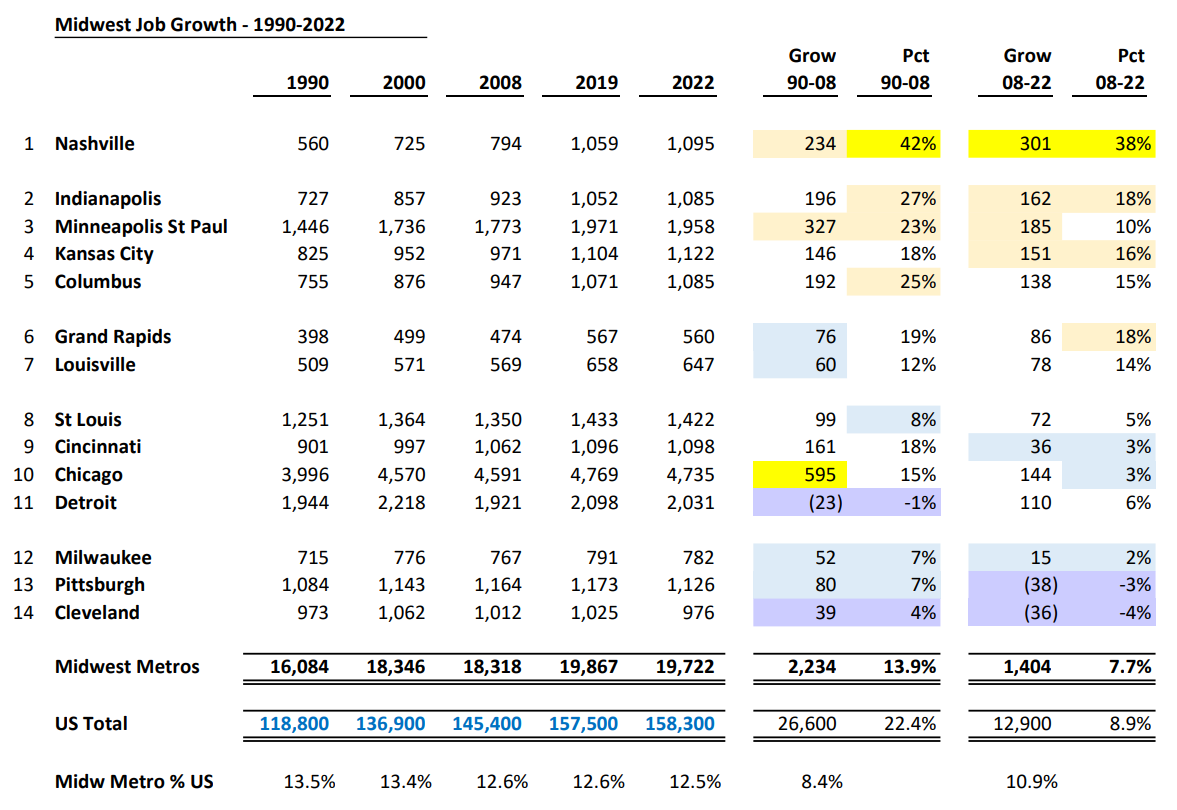
Between 1990 and 2008 US jobs grew by 22% but trailed in Midwest metro areas, increasing by only 14%. US jobs have grown by 9% since the Great Recession, with the Midwest trailing slightly at 8%. Metro Indianapolis has been a percentage growth leader in both periods, at 27% and 18%. Columbus and Kansas City show similar figures. Minneapolis has higher actual jobs added but slightly lower percentage growth on its twice as large base.
Chicago has added more total jobs, but its 18% growth is far behind Indy’s 49% and most of its growth took place back in the 1990’s. Nashville is typically grouped with the Southeastern states but if it was included in the Midwest, it would be the clear winner, nearly doubling its job base in 3 decades.
One of the “control centers” at MISO Energy in Hamilton County.
Hamilton County’s unemployment rate has averaged 3.1% since 1990, a little more than one-half of the nation’s 5.8% average. The Indy metro area has averaged 4.6%. In the last decade, Hamilton County has still averaged 2.0% lower than the national average of 5.3%.
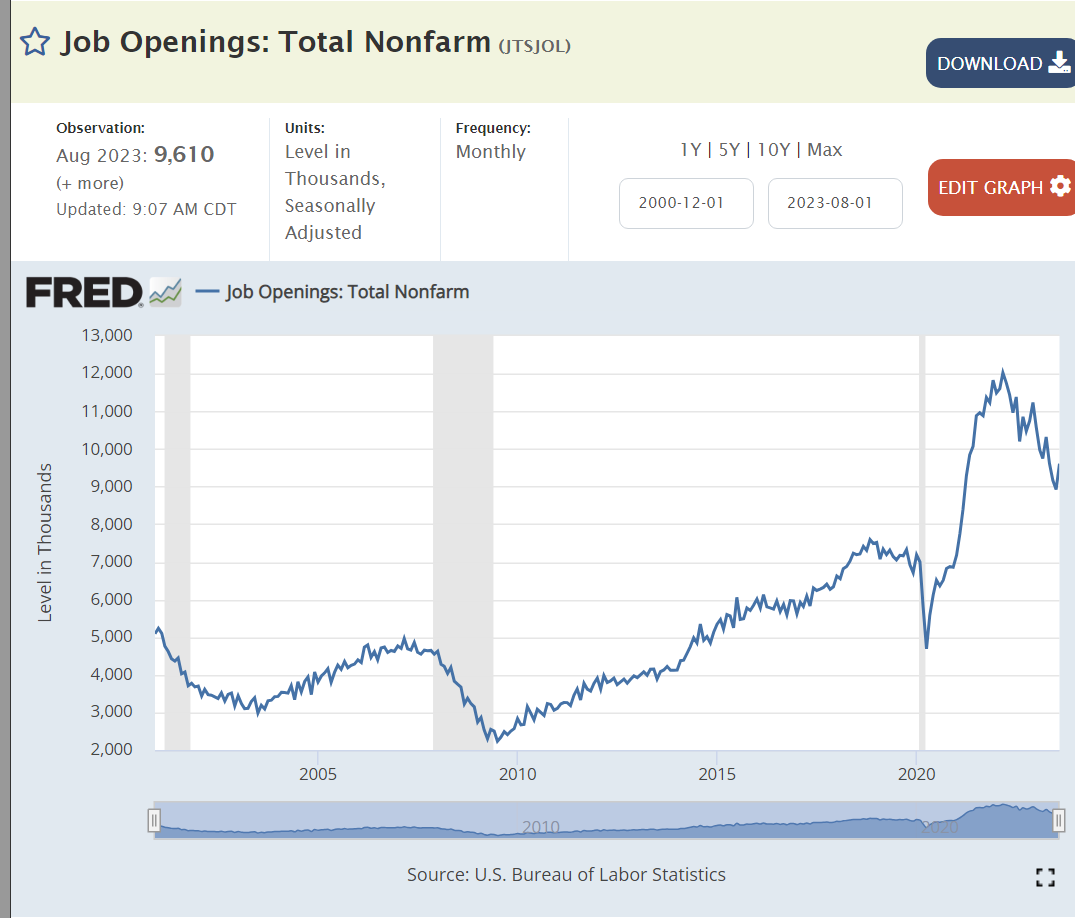
The stock market overreacted today. Job openings increased by 700,000 between July and August. Oh no! The labor market is too strong! Wages will increase! Cost-push inflation will build. The Fed will increase interest rates. We’ll be in recession soon! Boo!
Job openings are clearly falling. From an all-time high of 11.5 million to about 9.5 million in 18 months. With another 18 months of a “cooling” labor market, there will still be an historically high 8 million open positions in February, 2025. The labor market is slowly returning to “normal” after the Pandemic disruption.
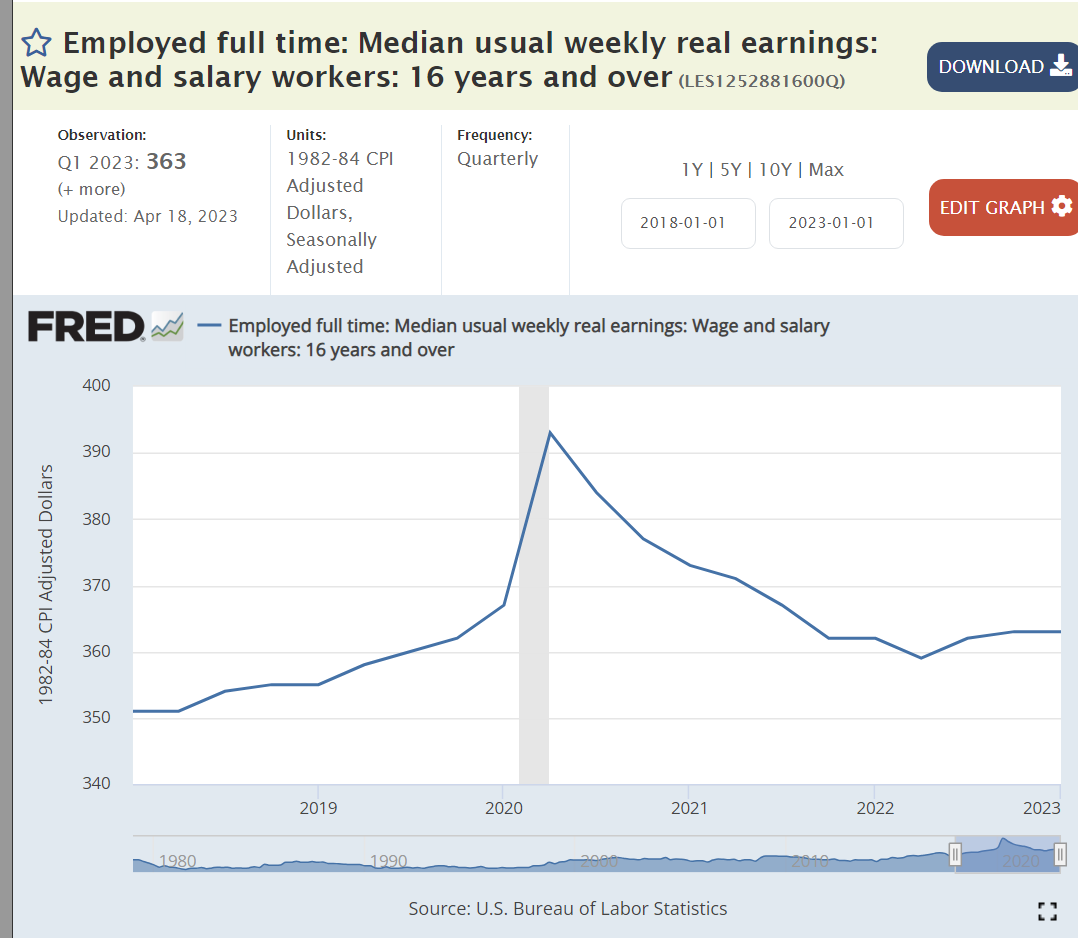
This is a solid labor market, not an overheated labor market. Real wages finally grew during 2016-2020, by 7%. They spiked during the pandemic but have been flat for the last 18 months.
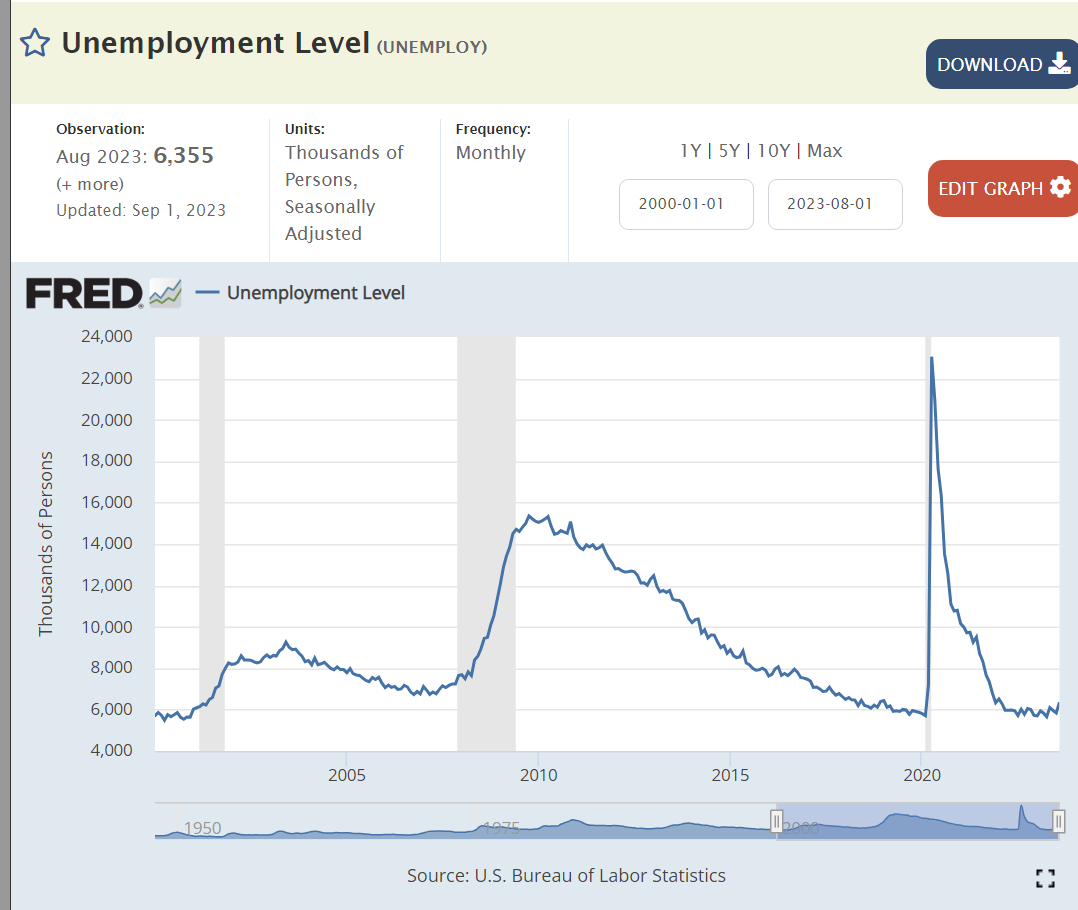
The number of unemployed people remains at 6 million, low by history, but not declining to unsustainable levels. 6 million is better than 8 or 15 or 23 million.
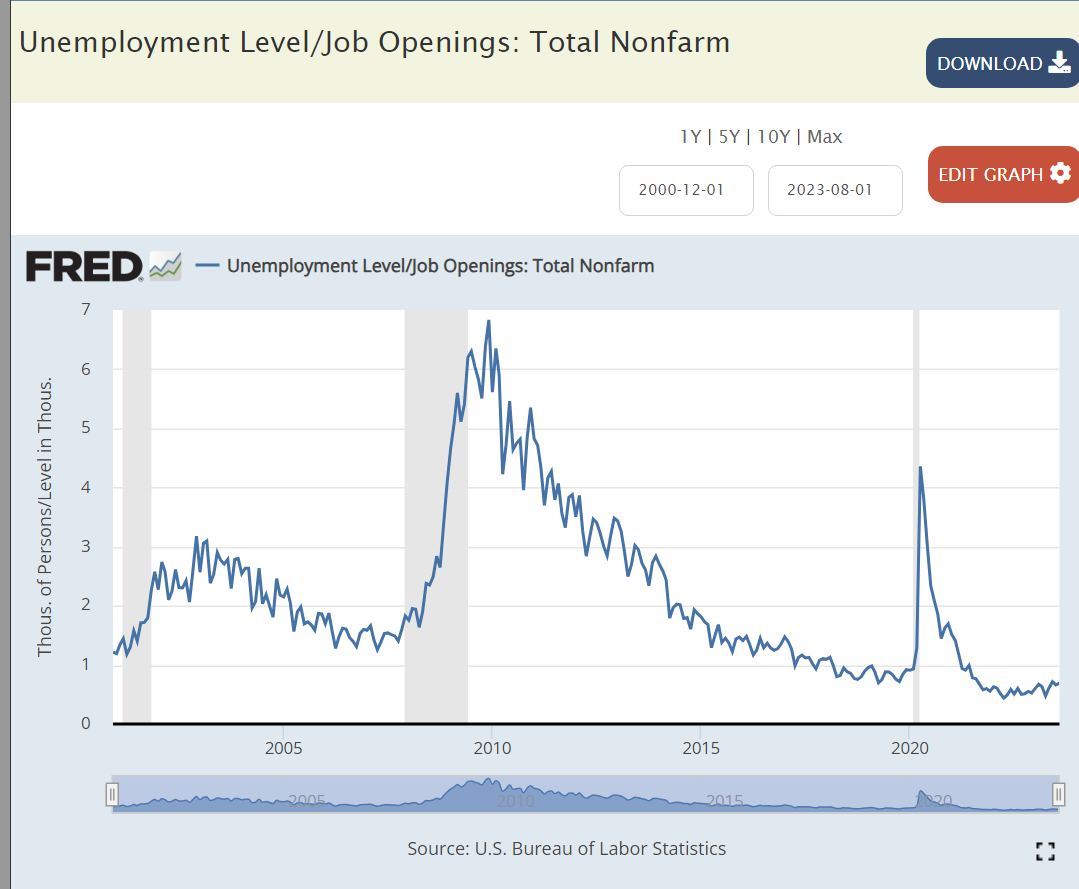
It’s a great time to be a job seeker, 3 jobs for every 2 job seekers. This is an historically positive ratio. It has been maintained for 2 years.
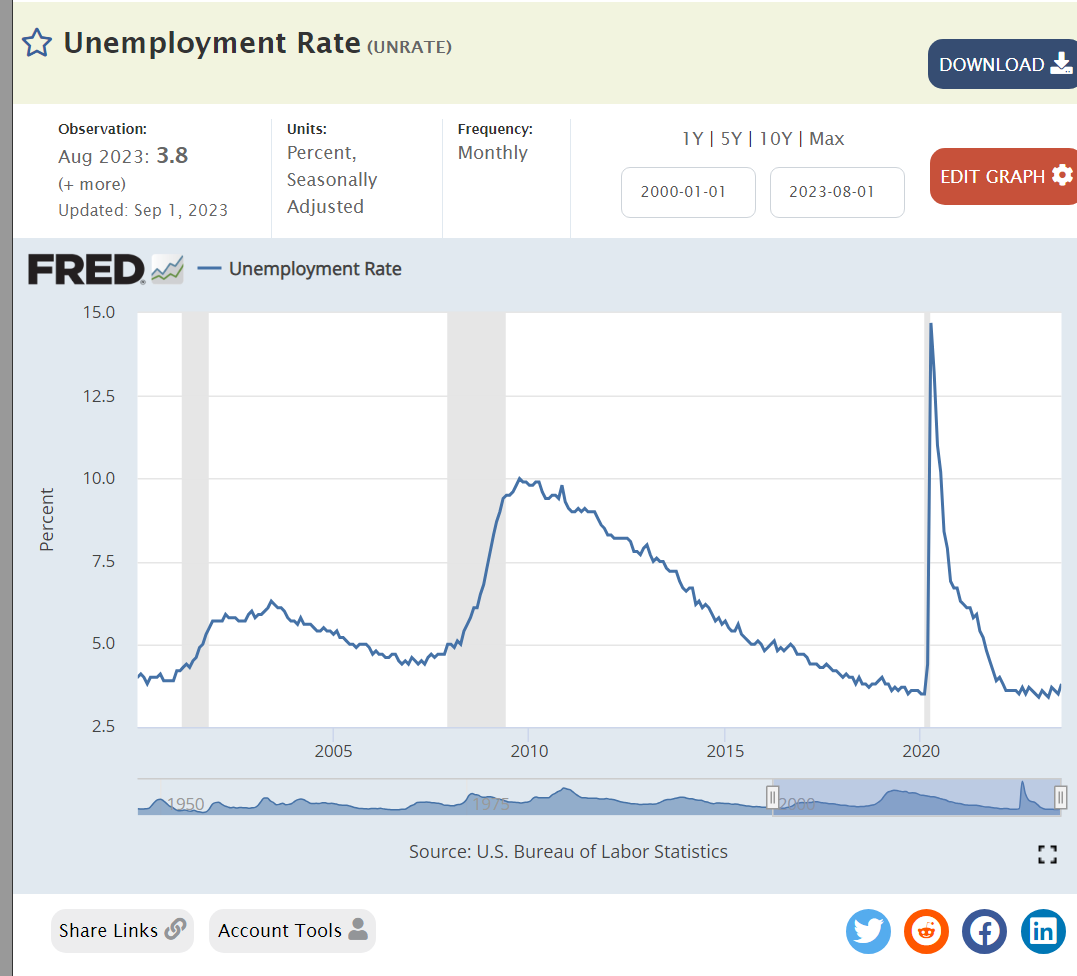
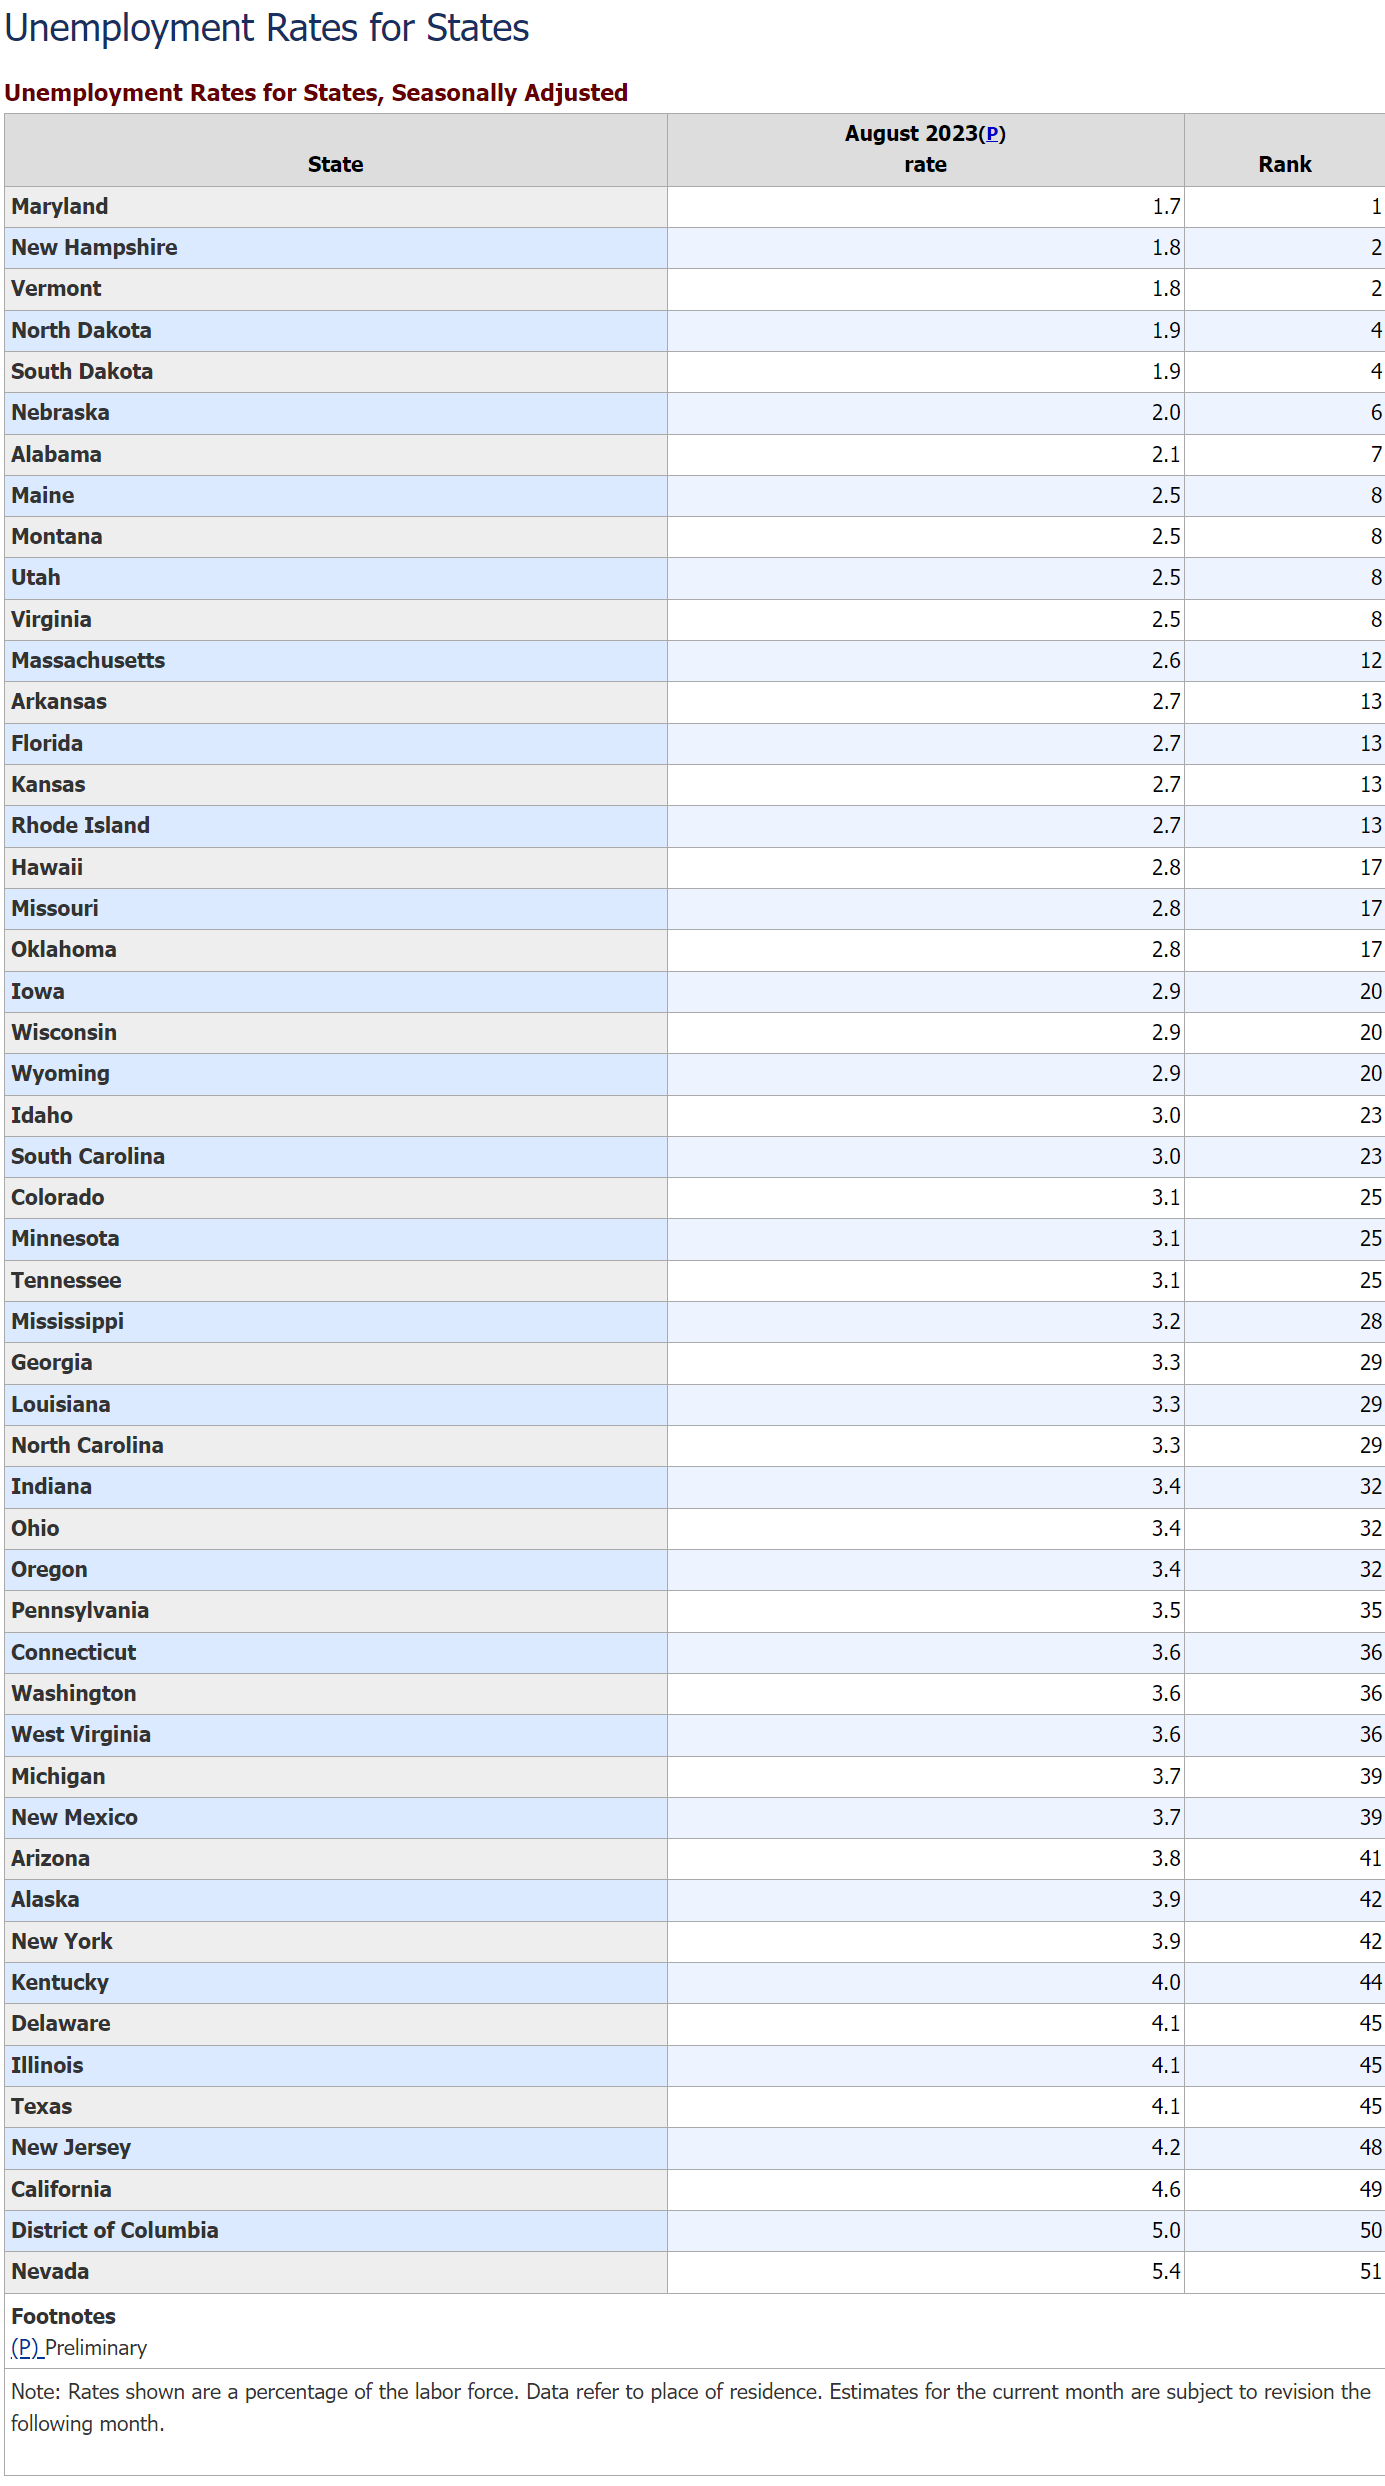
The unemployment rate remains at an historical low of 3.5% but is not falling.
Low unemployment is a widespread phenomenon. 22 states are below 3%. Only California, Nevada and DC are above 4.1%.
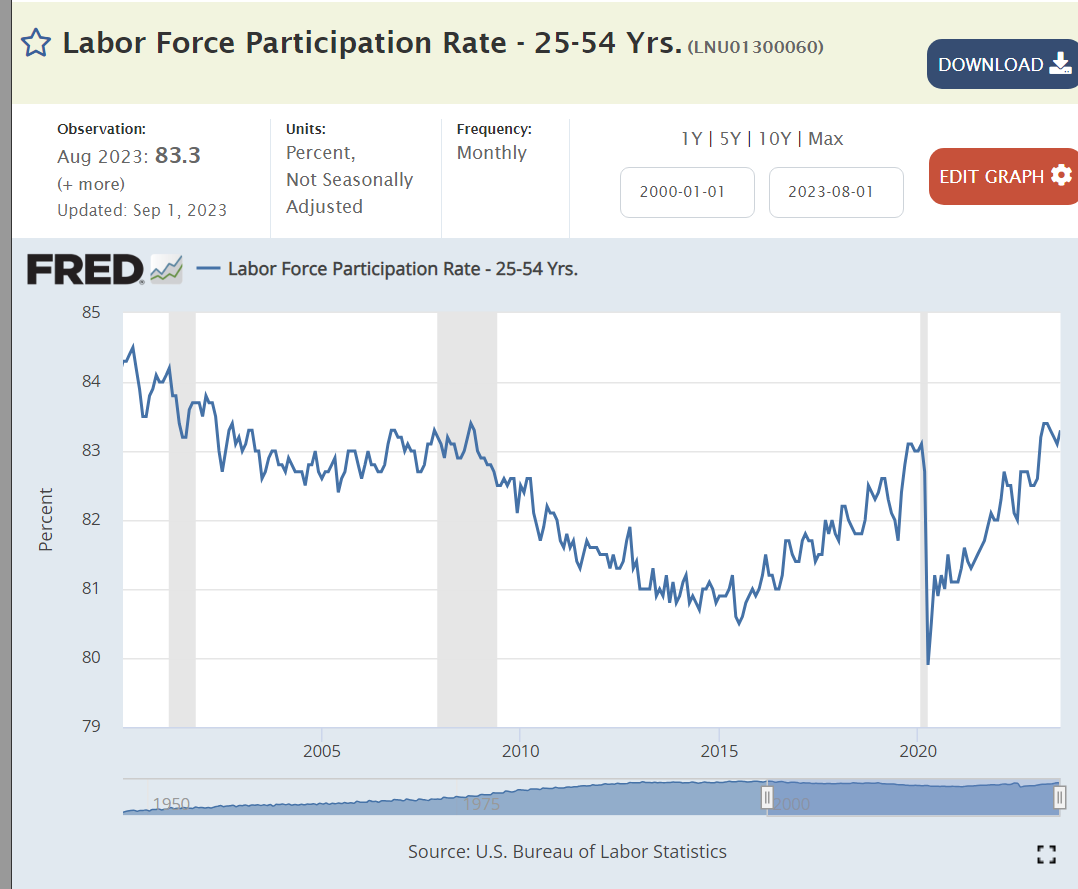
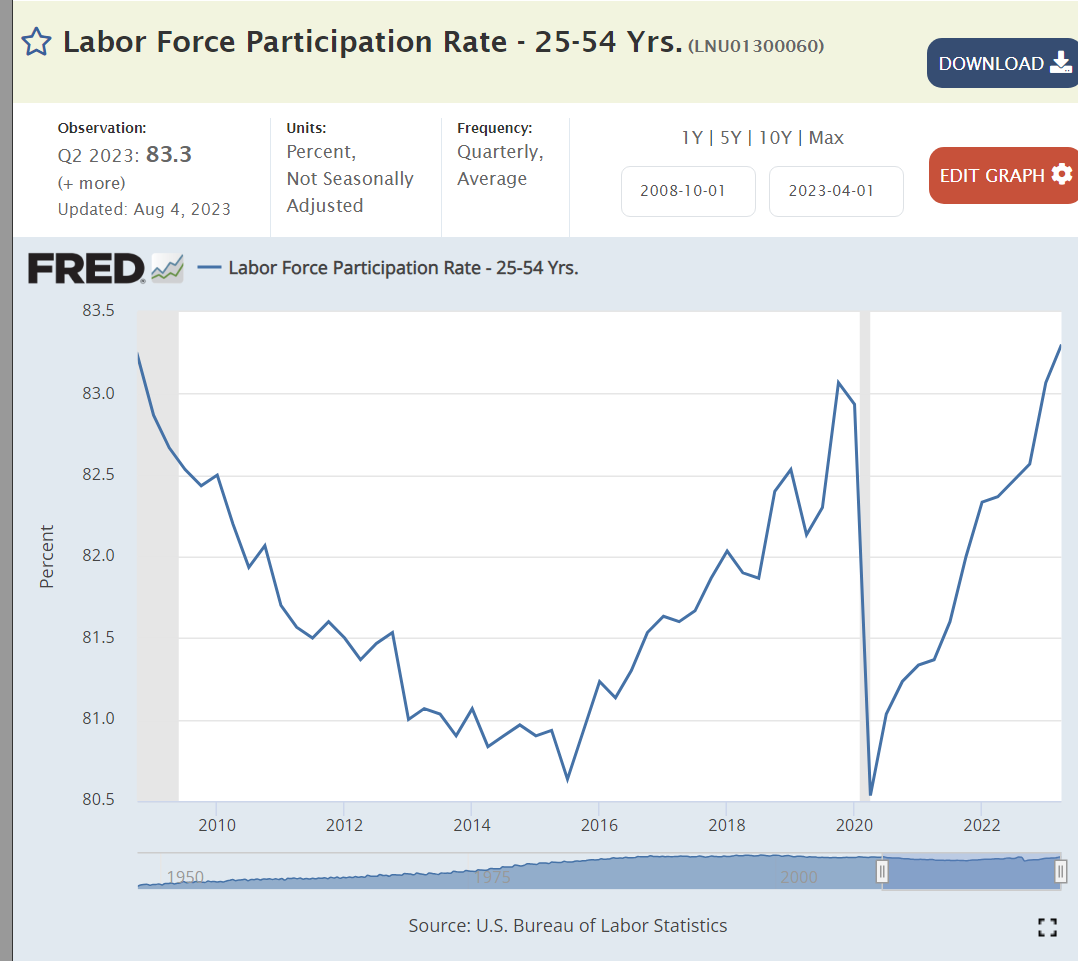
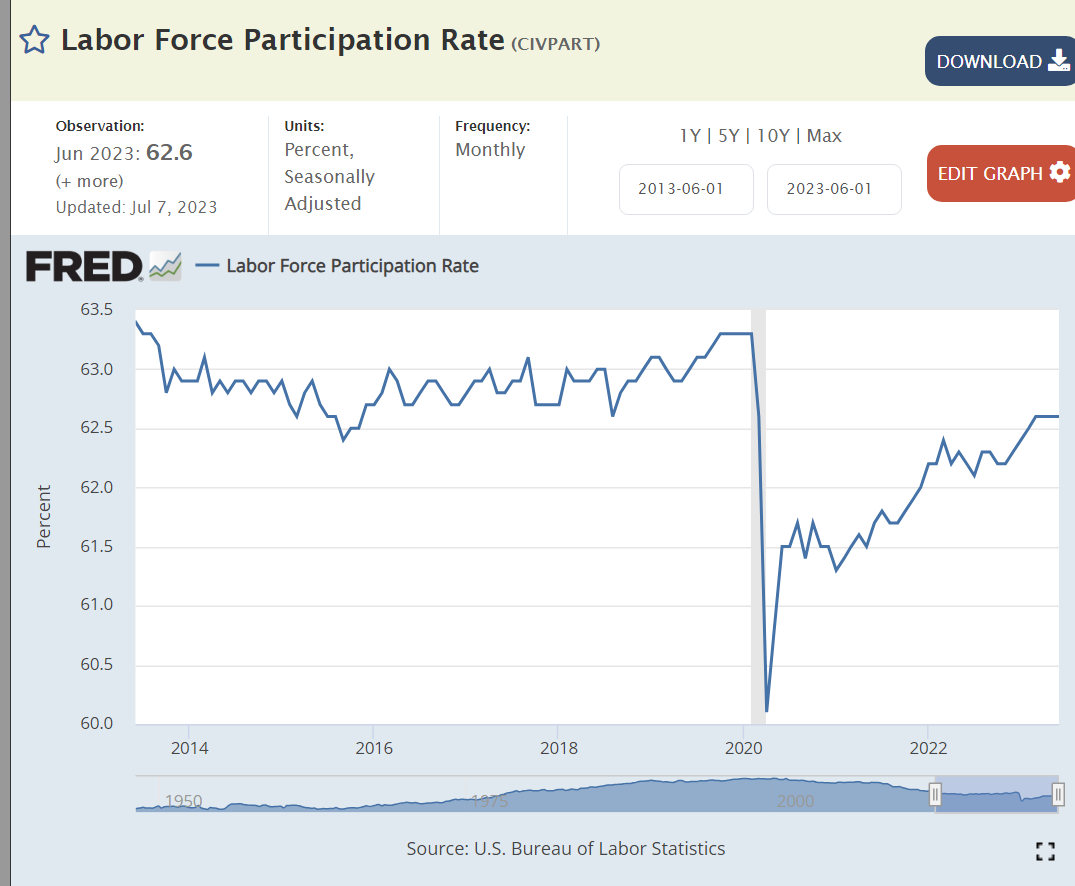
The labor force participation rate is at a 15 year high, with positive hiring and wage conditions attracting greater participation.
The quit rate remains above the pre-pandemic high, indicating that employees still see a positive labor market, but not an exploding market.
Total employment was flat for the first 11 years of the new millennium, parked at 132 million. Job growth accelerated for the next 8- and one-half years, adding a very solid 20 million new jobs. Post-pandemic, the economy has added another 4 million jobs.
Summary
This remains a Goldilocks labor market, neither too weak nor too strong. The Millennium pause, Great Recession and Pandemic have made us gun-shy. We don’t want to claim victory for fear of disturbing the labor market gods. But we are enjoying victory. 156 million employed versus 132 million employed a dozen years ago. An 18% increase.
Real mortage interest rates can be calculated as the difference between nominal mortage interest rates and the 10-year Treasury Bond interest rate. Although nominal interest rates have ranged from 3% to 16%, the real, after expected inflation, interest rates are remarkably consistent, averaging just 1.7% and ranging between 1.3% and 2.1% in 70% of the last 52 years. The peak real rate was 3.0% in 1982 following the unexpectedly high and remaining high nominal rates of the prior 4 years.
Banks, mortgage-backed securities investors and mortgage borrowers all take risks when they complete mortgage transactions. Lenders are betting that their present and future borrowing interest rates are and will be low enough to fund their mortgages at a profit. Each lender locks in funding commitments for a reasonable share of the loan life and counts on the consistency of interest rates over the business cycle to fund the remaining portion. Lenders that experience a mismatch put their stockholders’ equity at risk and face bankruptcy. Investors in mortgage-backed securities are subject to valuation change risks throughout the period in which they are invested. Most such investors hold diversified portfolios of mortgages (region, amount, riskiness, urban vs suburban vs rural) and non-mortgage assets to ensure that any investment decision will not be too damaging.
Fixed-rate mortgage borrowers are betting that inflation will not fall too much lower than the expected inflation rates when they borrowed. If so, they will be paying back the mortgage in higher real value dollars than expected. If inflation and mortgage rates drop by more than 2%, most borrowers will seek to refinance their mortgages at the new, lower market rates, paying another round of closing costs for this privilege. Fixed rate borrowers are also hoping that inflation will be higher than the expected inflation rates at the time they borrowed, allowing them to pay back their debt with cheaper real dollars. Mortgage originators do not generally have the legal right to “call” the debt and require a change in the rates and terms as many commercial lenders and bond issuers do.
The “good news” is that the US mortgage market is very efficient and the real interest rate premium for borrowing to own a home is just 2% more than what the US government pays for borrowing. Borrowers face interest rate change risks, especially being caught with a high interest rate mortgage when inflation rates fall if they are unable to refinance.
The market has been tested through 7 business cycles and held up very well. The “Great Recession” exposed excessive risk taking by mortgage originators and funders. They lost money and many went out of business. Riskier mortgages are rarely issued today, and government regulations provide some added protection against any future overreach.
For higher income households that itemize deduction on their federal tax returns, the nominal interest rate paid is a tax-deductible offset to earned income. These individuals typically pay 22%, 24% or 34% marginal tax rates. A 5% nominal tax rate can provide a 1%, 1.25% or 1.65% reduction in the effective interest rate, thereby making the 2% real mortgage rate less than 1%. Higher income households can benefit greatly from this tax benefit.
Real, after inflation, Gross Domestic Product is up by one-third, despite the pandemic. That’s 2% annually, despite the Great Recession and the pandemic. The US economy is very solid.
A 21% increase in per capita income during this time. Quite solid and constant growth.
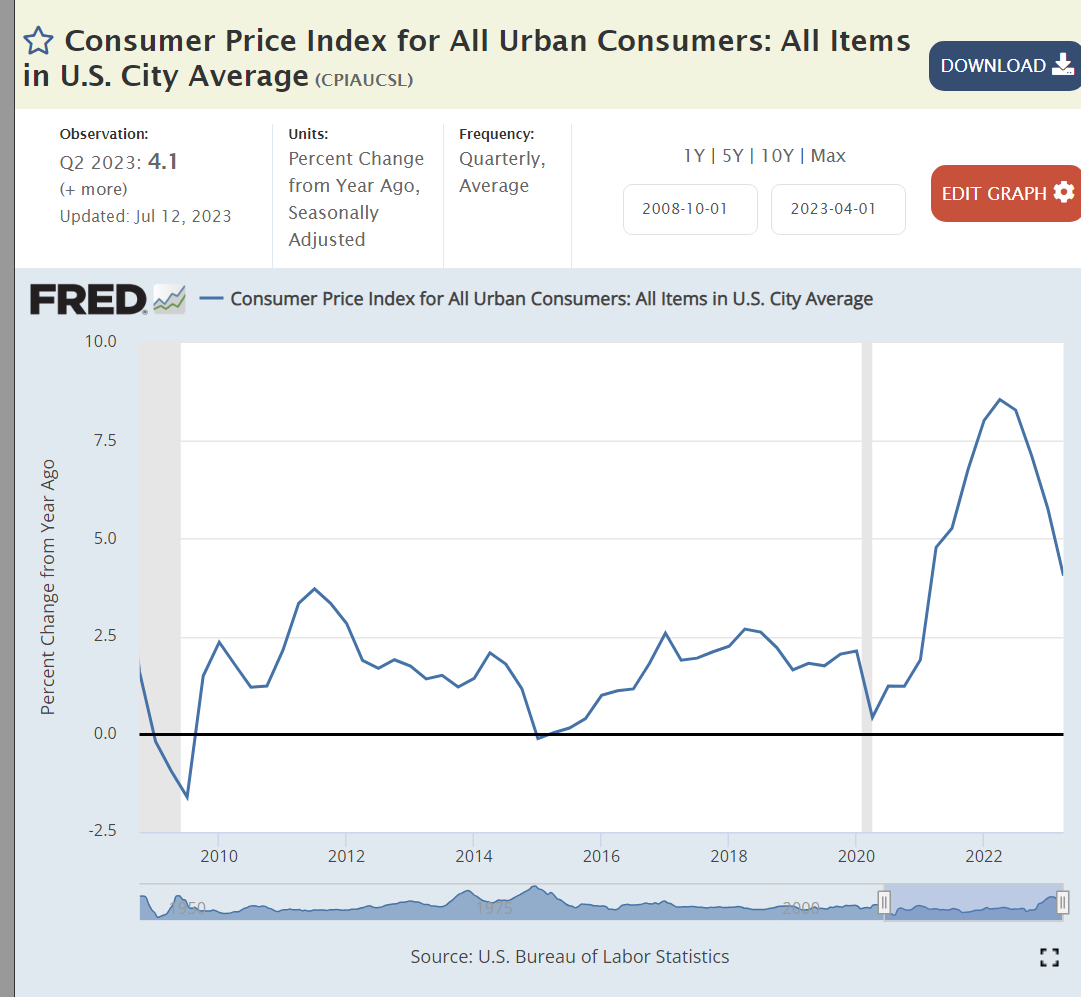
Inflation averaged a bit less than 2% before the pandemic, spiked to 8%, and has since declined to 4%. Experts disagree on whether it will return to 2% soon.
Gas prices are the most obvious component of inflation. They are largely driven by global supply and demand. Prices today are the same as in 2011-14, despite the general inflation increase of more than 20% since then.
Despite the pandemic, US unemployment is at a 50 year low!
Job seekers today encounter 3 times as many job openings.
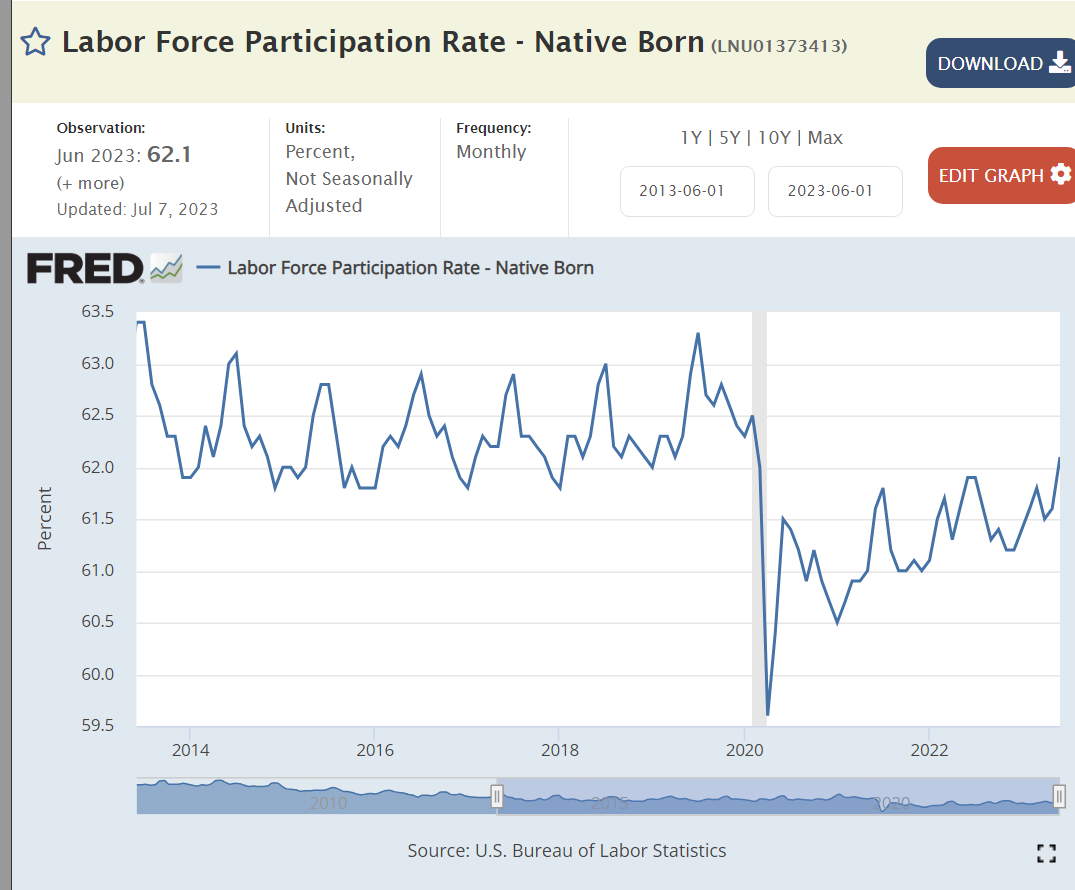
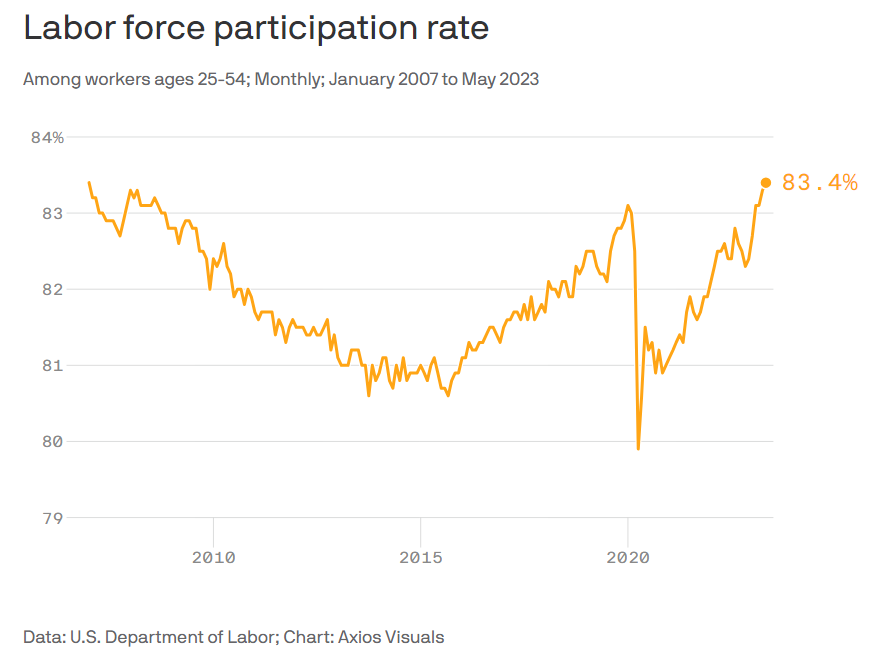
Core age labor force participation has snapped back after the pandemic.
Investment values have doubled.
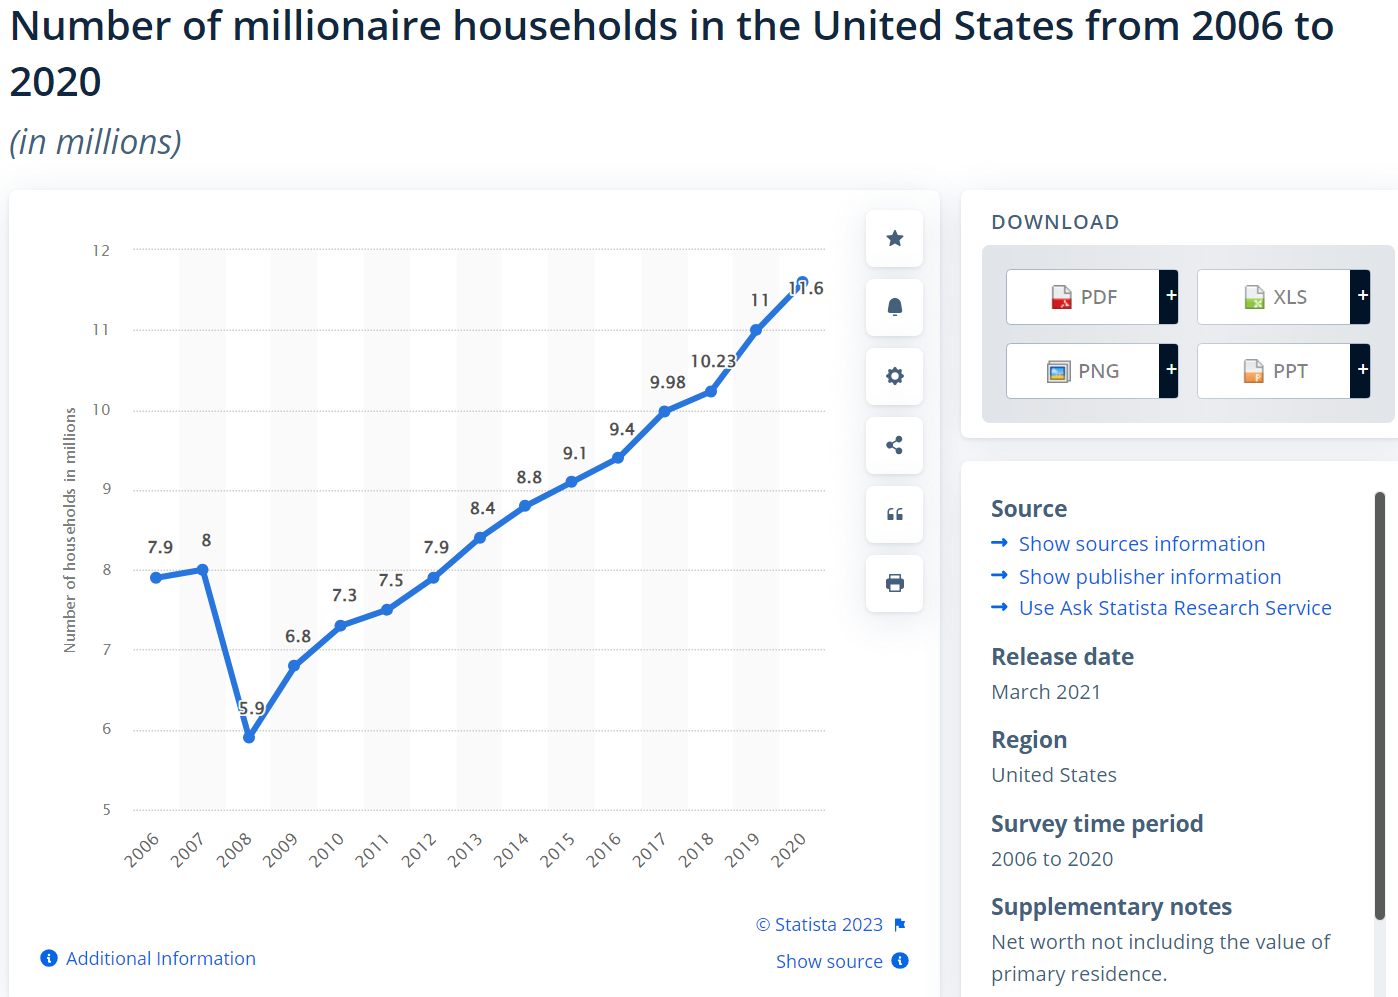
The number of millionaires and billionaires in the US has continued to increase.
Personal savings rates rose from 6% to 9% before the pandemic, shot up and fell back down to just 4% recently.
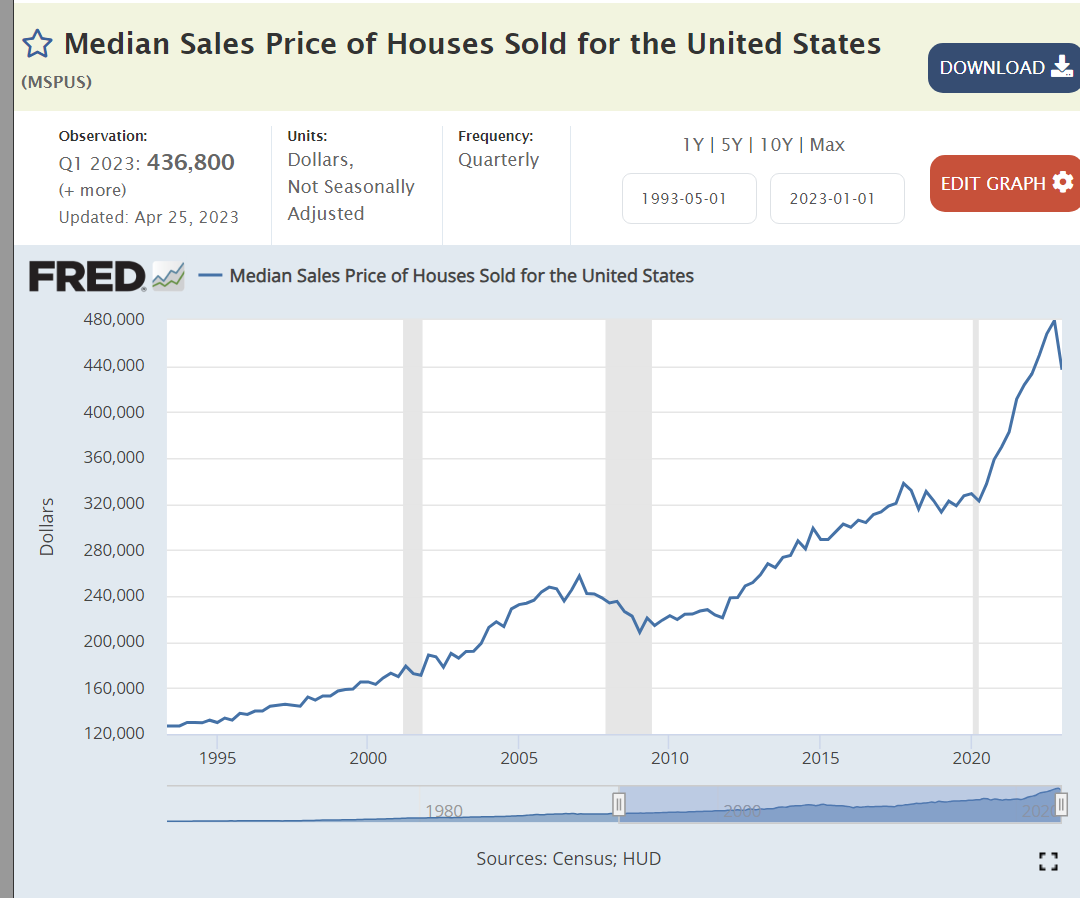
Housing values have doubled since the Great Recession.
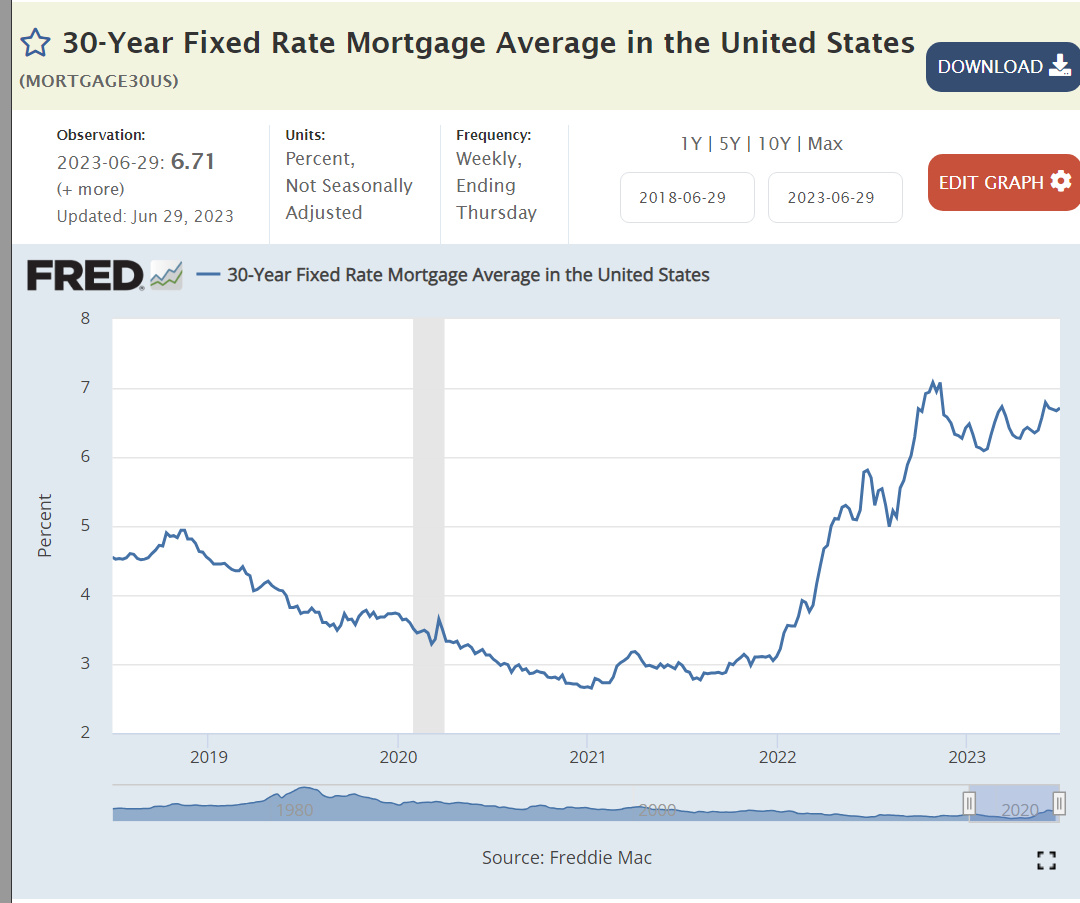
Mortgage rates averaged 4% after the Great Recession, dropped to 3% and then increased to 6%+ as the Federal Reserve raised interest rates.
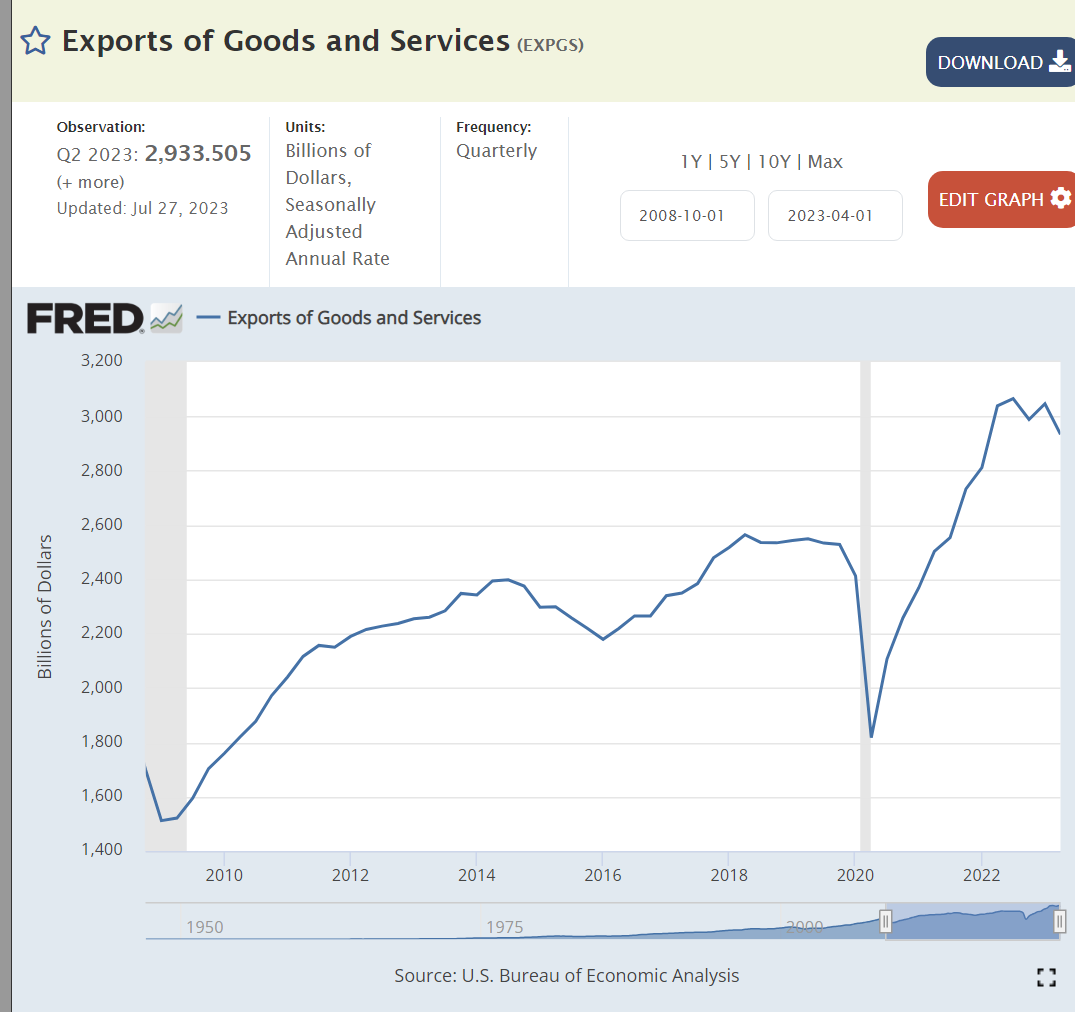
US exports have nearly doubled in 14 years.
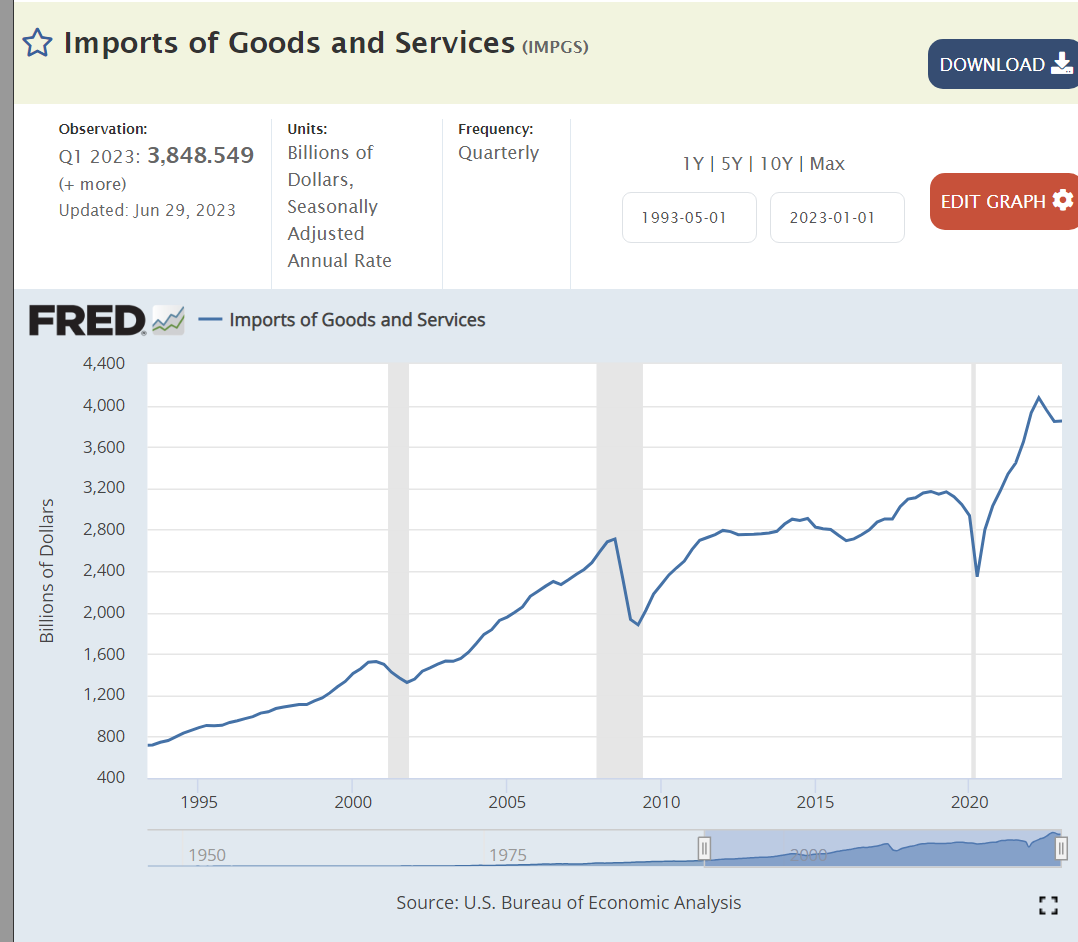
Despite the Trump tariffs, which Biden has maintained, imports have also nearly doubled.
Despite historically slower growth rates, higher budget deficits and looser monetary policies, the US dollar is more highly valued today than in 2008.
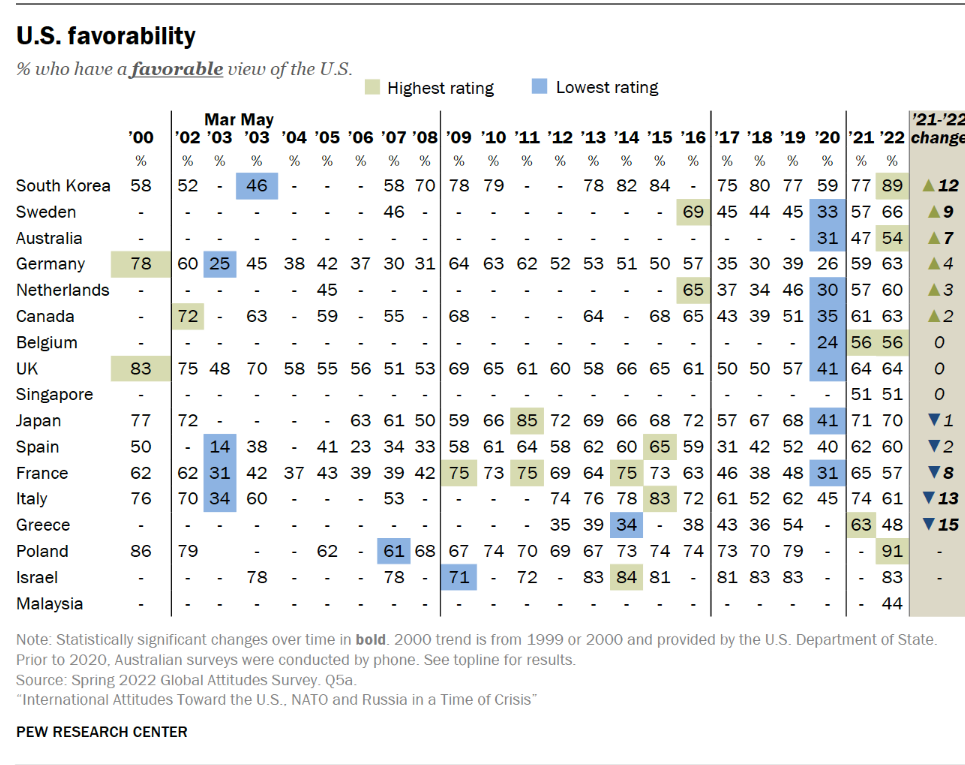
Foreign countries still see the US as a positive ally, despite their concerns during the Trump era.
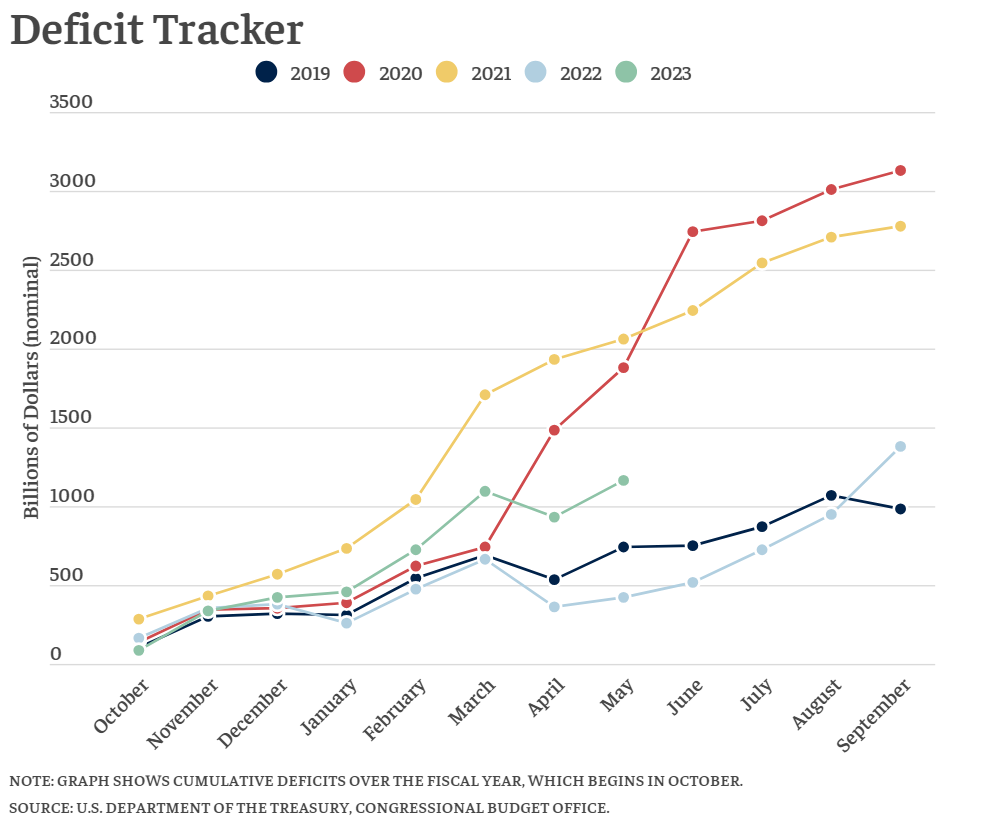
Obama returned the budget deficit to a “reasonable” 3% by 2016. Trump expanded it to 5% and then 15% as the pandemic struck. Biden drove some recovery to 5% by 2022, but has not driven further reductions.
US coal production is in a long-term decline.
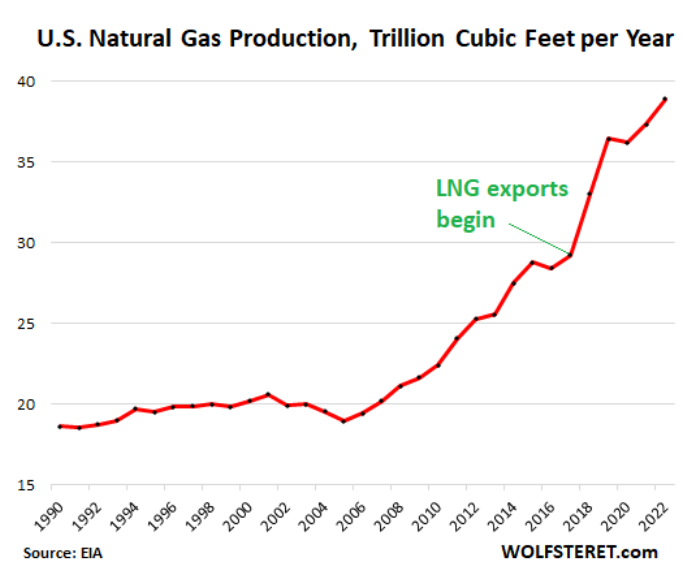
Natural gas production has nearly doubled in 14 years.
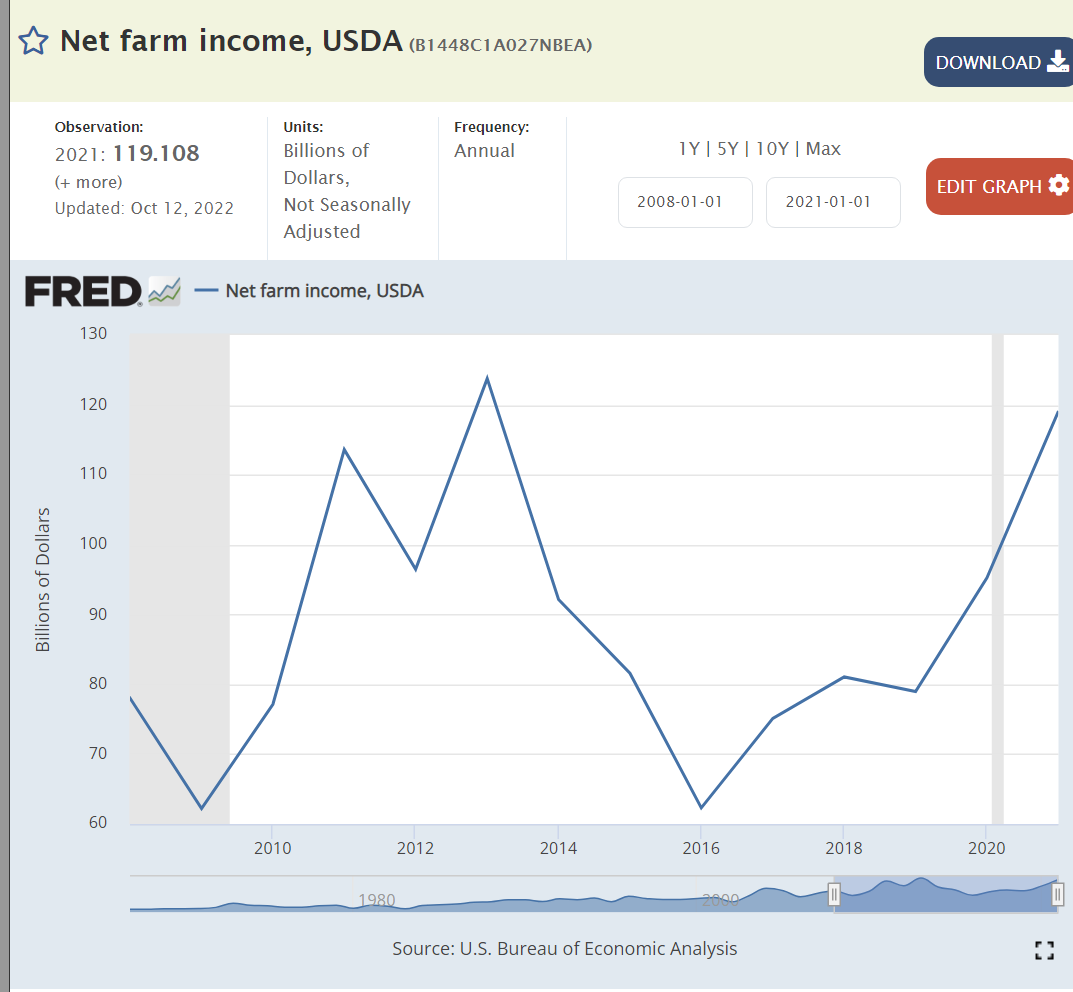
Net farm income has been significantly above the base for 6 of the last 14 years, despite lavish Trump farm subsidies.
Manufacturing employment has continued to rise slowly in the last 14 years against the headwinds of international competition.
It’s difficult to put the pandemic in perspective, but here we see a 2-year reduction in expected lifespans. Opioid deaths and so-called “deaths of despair”, alcohol, drugs, suicide, also play a role.
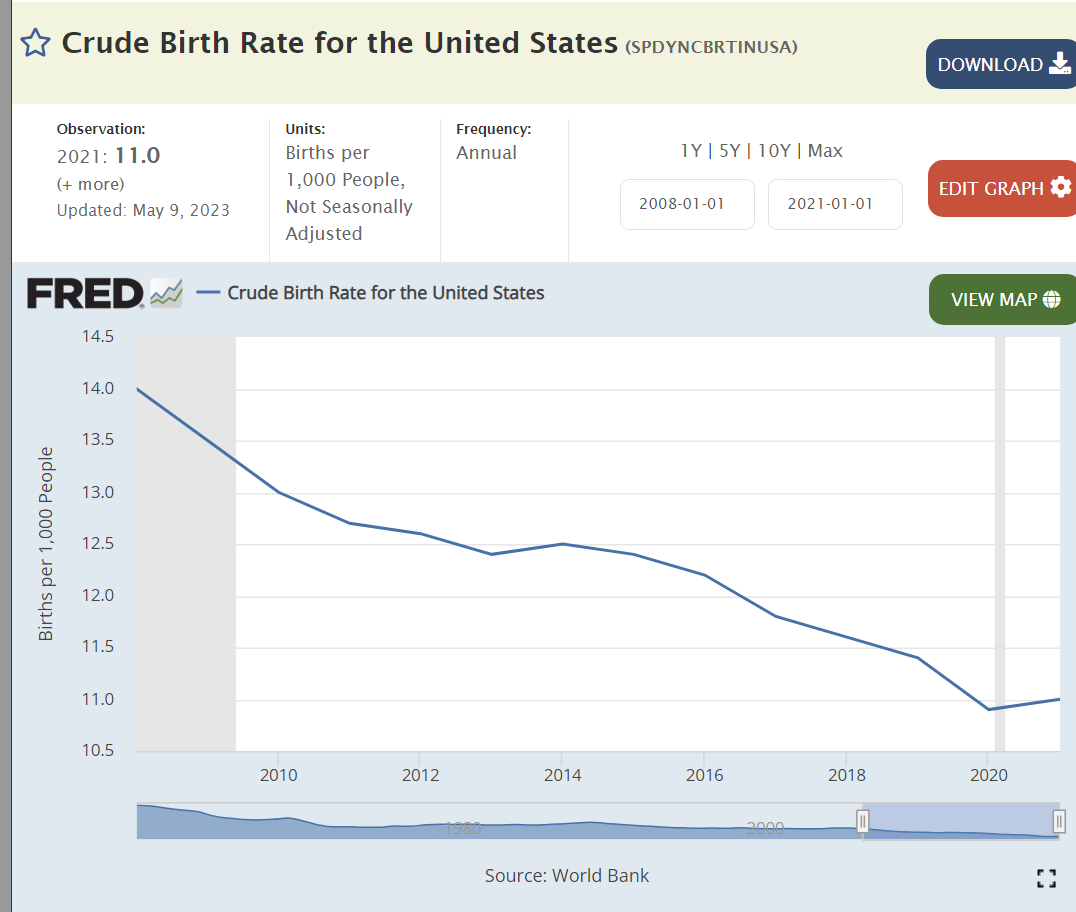
Birth rates continue to drift lower as seen in all regions of the world.
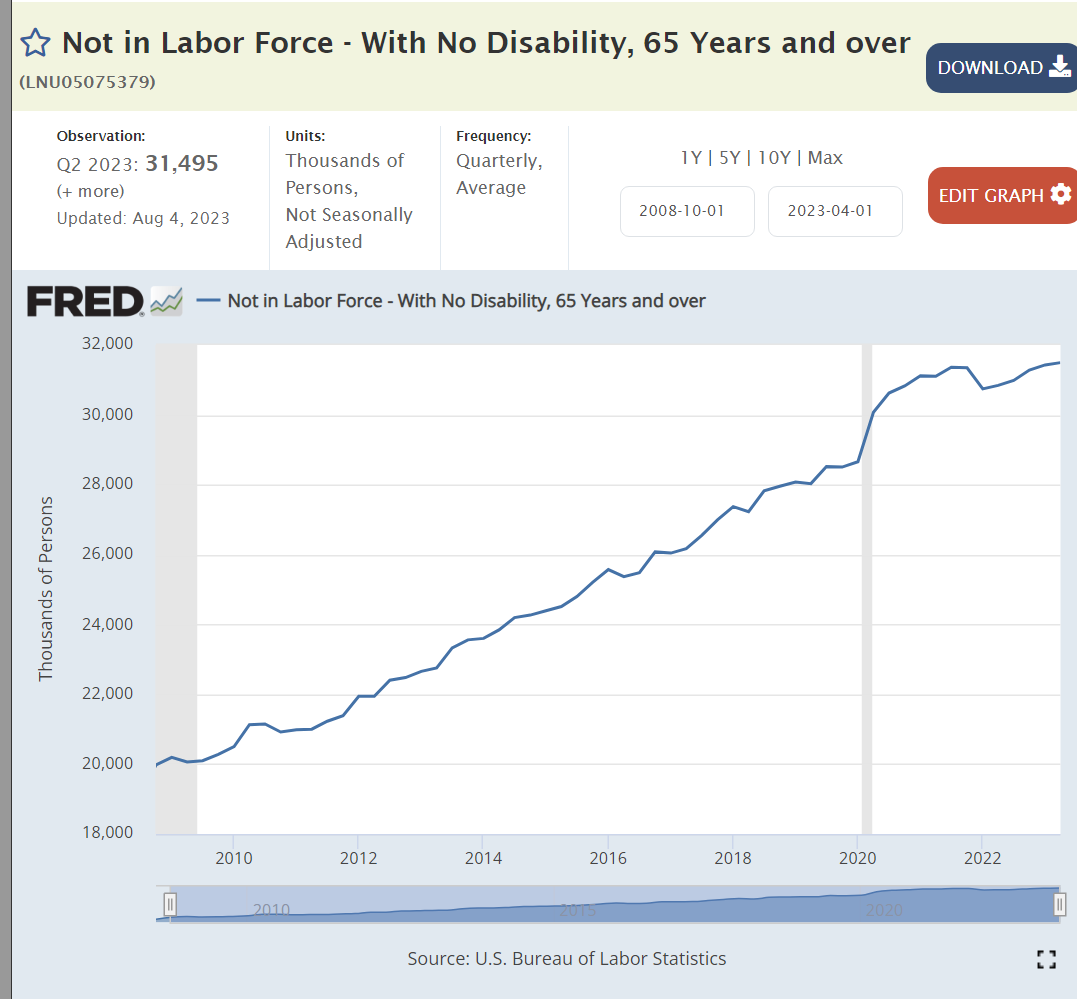
The number of retirees has increased by more than 50%.
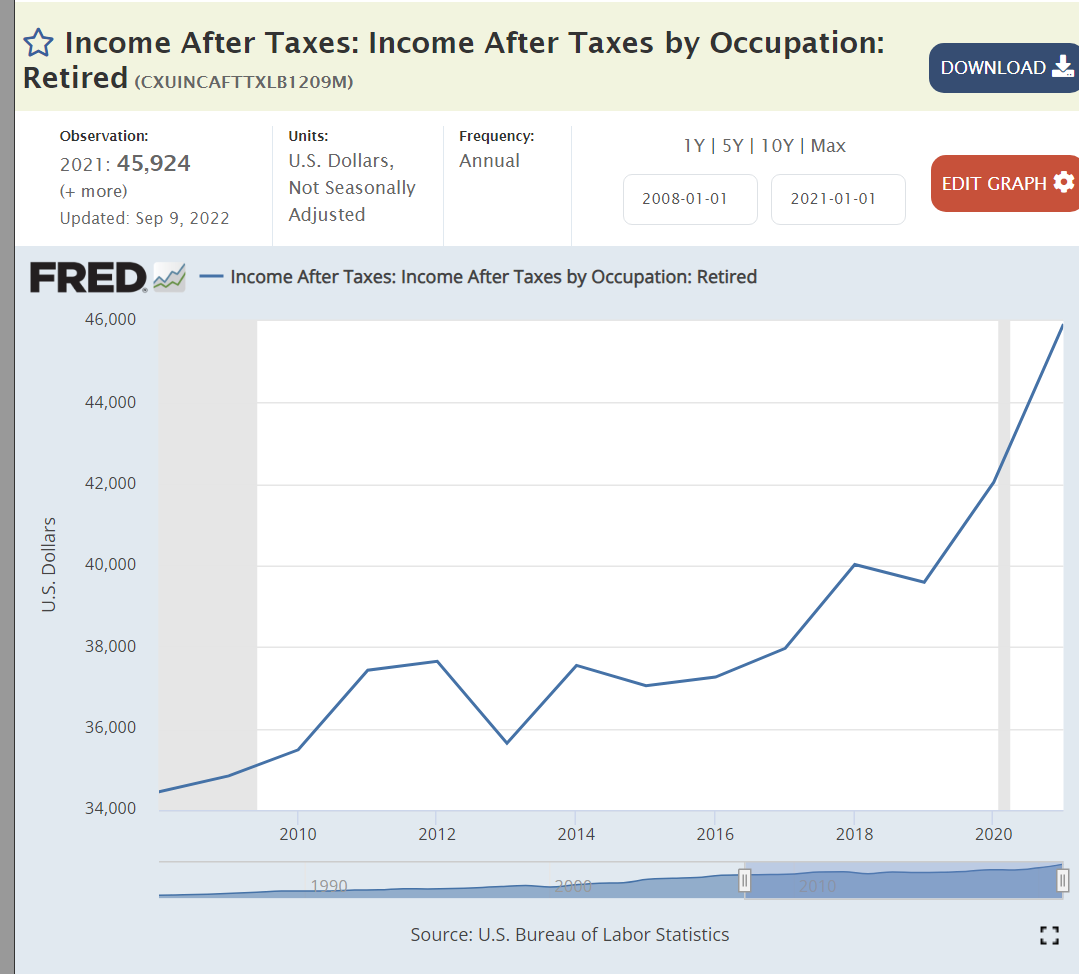
Retiree incomes are up by one-third, matching inflation.
Prospective retirees have doubled their cumulative savings.
The abortion rate has continued to fall in the last 30 years.
Church attendance has dropped from 40% to 30%.
Summary
The US economy recovered slowly after the Great Recession and then very quickly after the pandemic. Real, after inflation, output and per capita output increased. The labor market became very tight. Asset prices (investments and housing) rose for intrinsic and monetary reasons. The US remained a competitive international producer. The federal budget deficit was better at the end of the Obama period but worse for Trump and Biden. The pandemic reduced life expectancy and households had fewer children. Successful retirements grew and will grow. Social trends continue, uninterrupted by political positioning and policies.
Perceptions of the country and the economy are increasingly shaped by partisan political party views. Nonetheless, the US economy continues to grow and thrive.
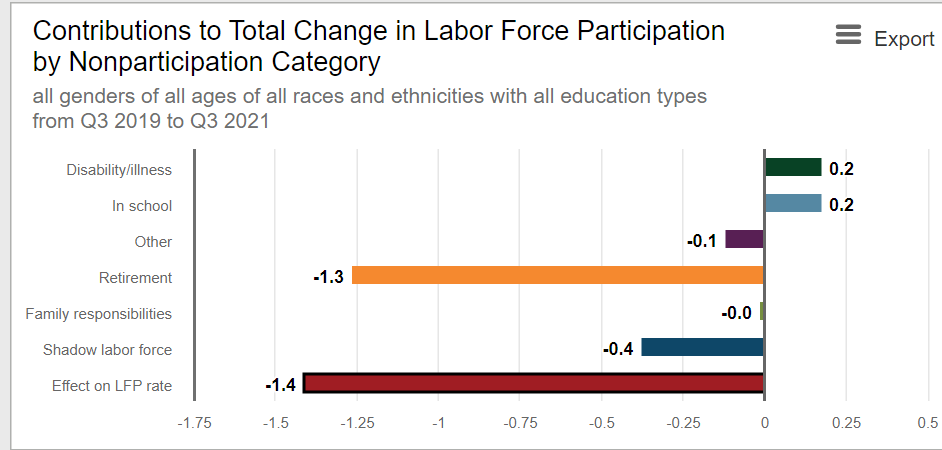
Overall labor force participation rate dropped by 1.5% in the pandemic and has recovered by 1%, still 0.5% below the recent history. However, the prime age category and several market segments no meet or exceed their pre-pandemic levels. Many details to consider.
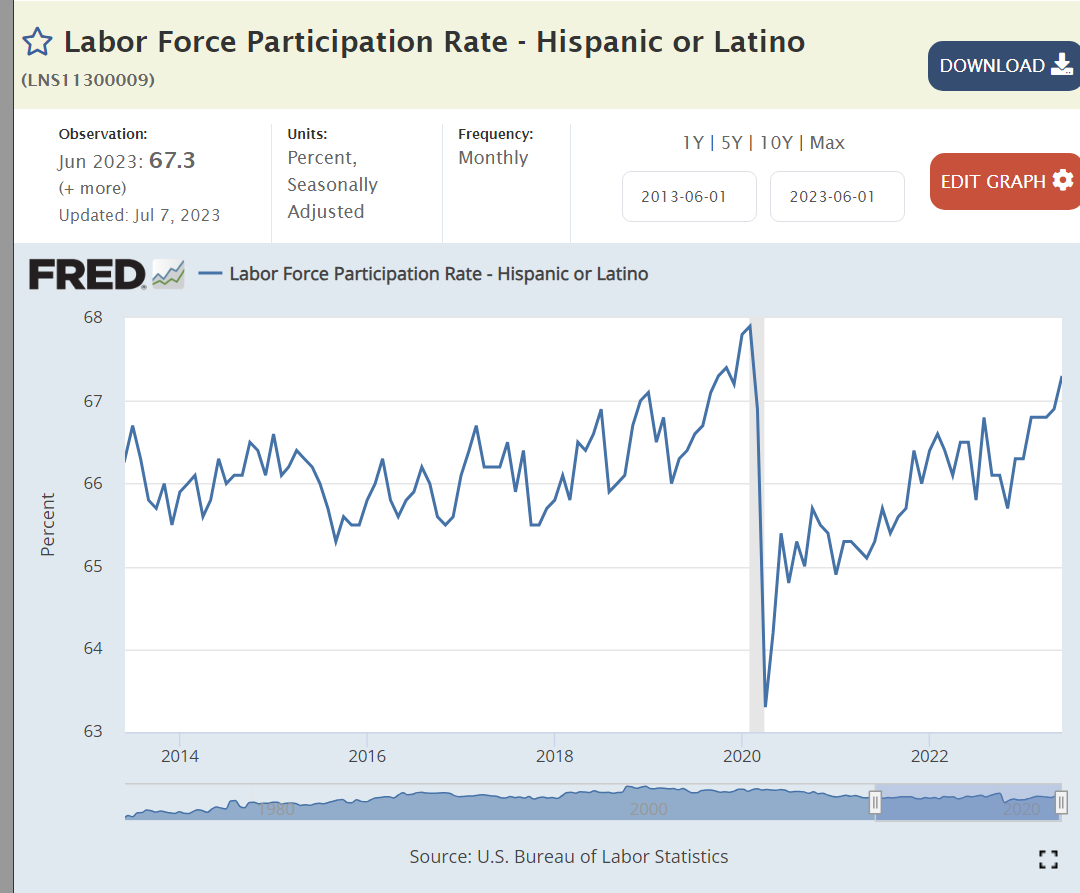
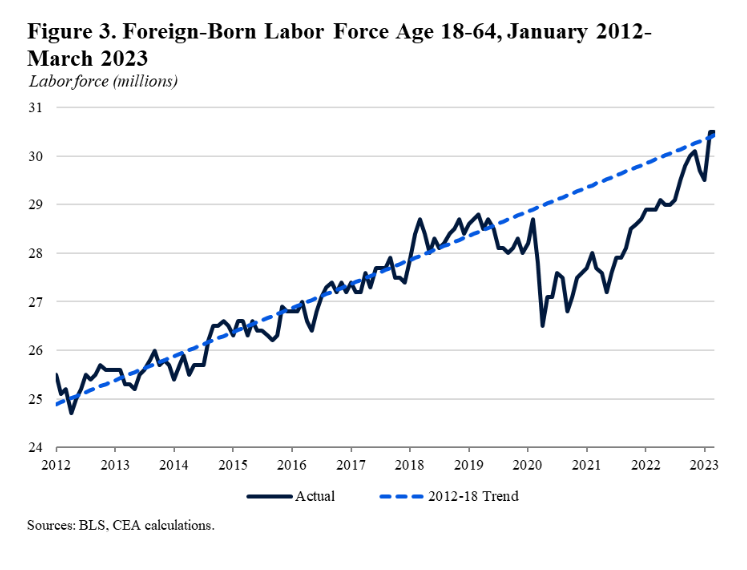
Hispanic participation is now 1% higher than the 2018-19 average before the pandemic.
The Asian participation rate is up 1%.
The Black participation rate is up 0.5%.
The White participation rate dropped by 1.5% and has recovered by half: 0.75% better but 0.75% below history.
The Women’s participation rate has essentially recovered to the 2018-19 average but is a half point lower than the peak levels seen just before the pandemic.
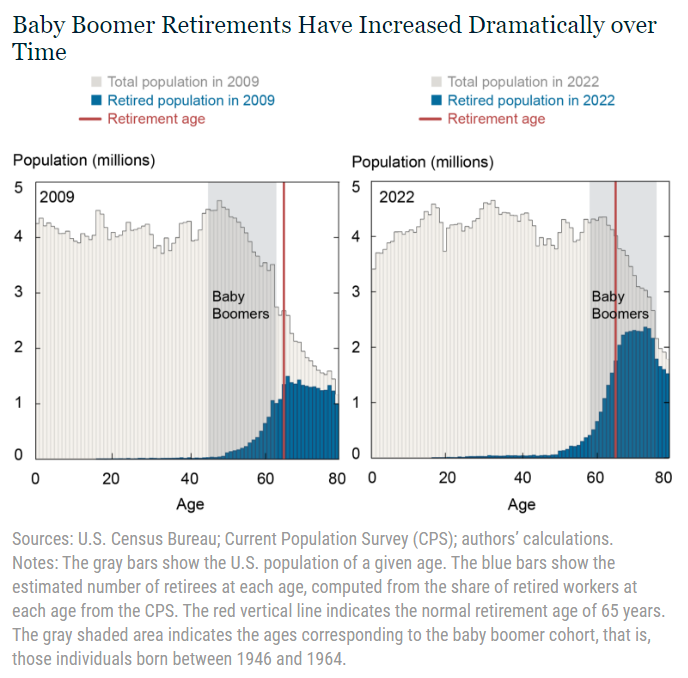
The male participation rate dropped by 1.5% but has only recovered by 0.5%, a major 1% below pre-pandemic times. Part of this is due to the long-term downward trend. Part of this is a “mix variance” driven by the very high number of “baby boomers” moving into normal retirement age or retiring early.
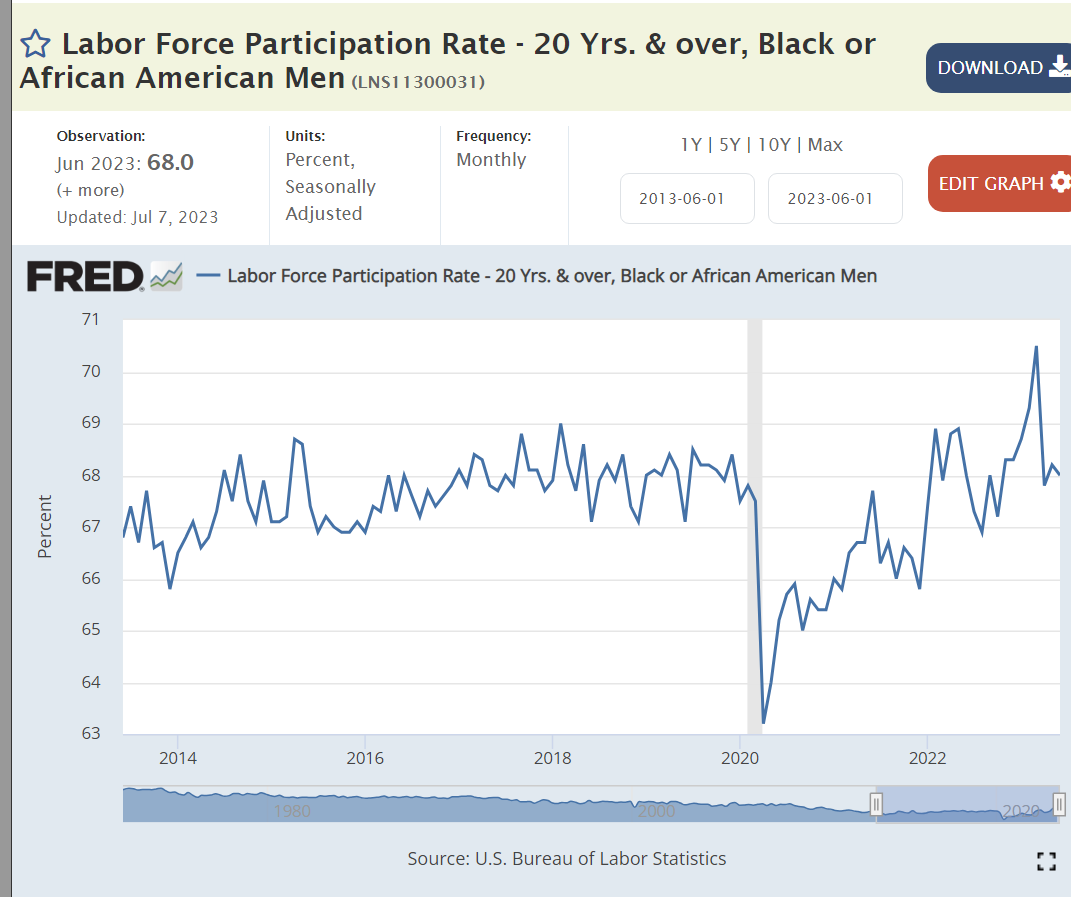
Black men are back to their pre-pandemic participation rate.
Black women are more active labor force participants.
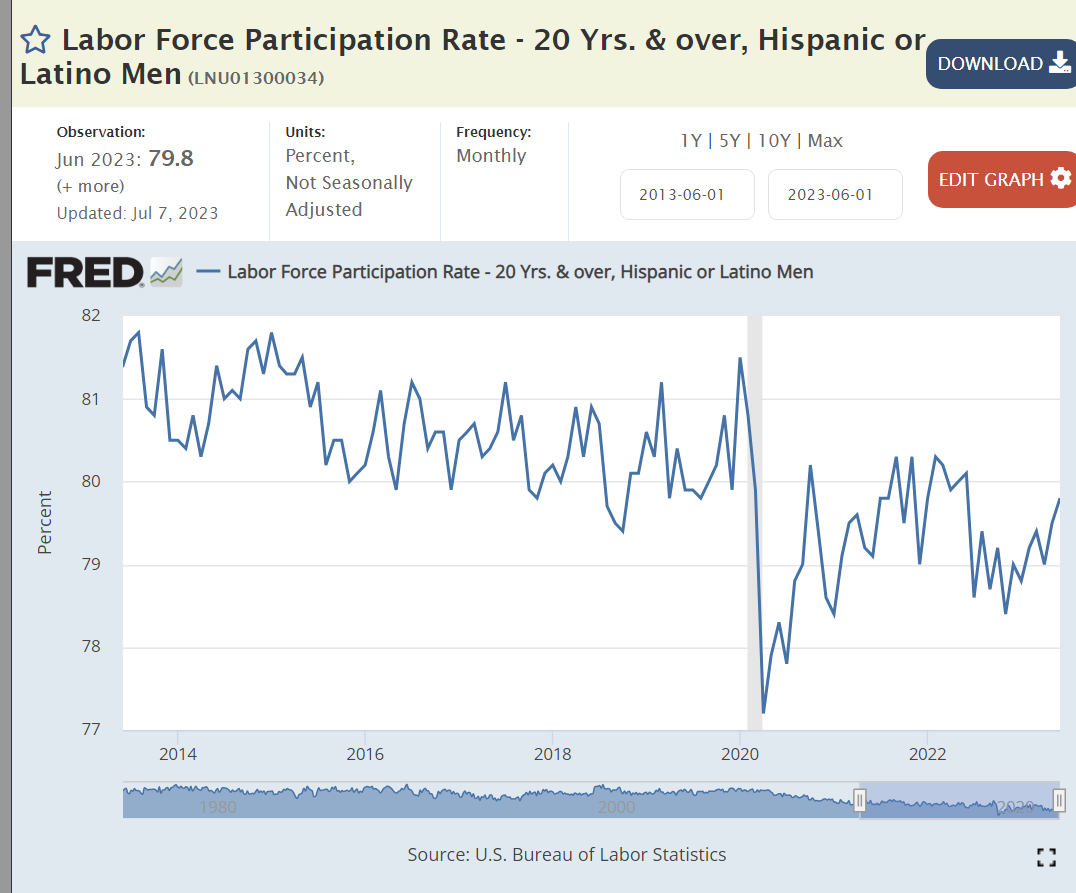
Hispanic men remain 1% below their pre-pandemic labor force participation rate.
Latino women have recovered to their historically high 61% participation ratio.
The White male participation rate dropped by 2% and has not recovered. Again, part is due to the long-run downward trend. Part is the aging of baby boomers into retirement. The remainder appears to be a response to the pandemic experience. “I’m not working unless you make it worth my while.”
White women remain a little below their 2018-19 average and three-quarters of a point behind their pre-pandemic peak level.
Teenage work participation has increased by 1.5% as entry level wages have risen.
College grad age participation rate has mostly recovered but remains 1% below the pre-pandemic high.
The retirement age workforce reduced its participation rate by 1.5% and has stayed there after a brief pseudo-recovery.
The prime age work force is now above even the elevated pre-pandemic level and a full one percent above the 2018-19 average. This is very good news, reflecting a strong economy an labor market.
Prime aged men have returned to the workforce.
Prime aged women are the “rock stars”, increasing their participation by 2% from 2019.
Brookings has combined all of the race and age data. Major declines for white men in all 3 age groups and for white women aged 65+. Major improvements for prime age white, black and other women and for prime age black men.
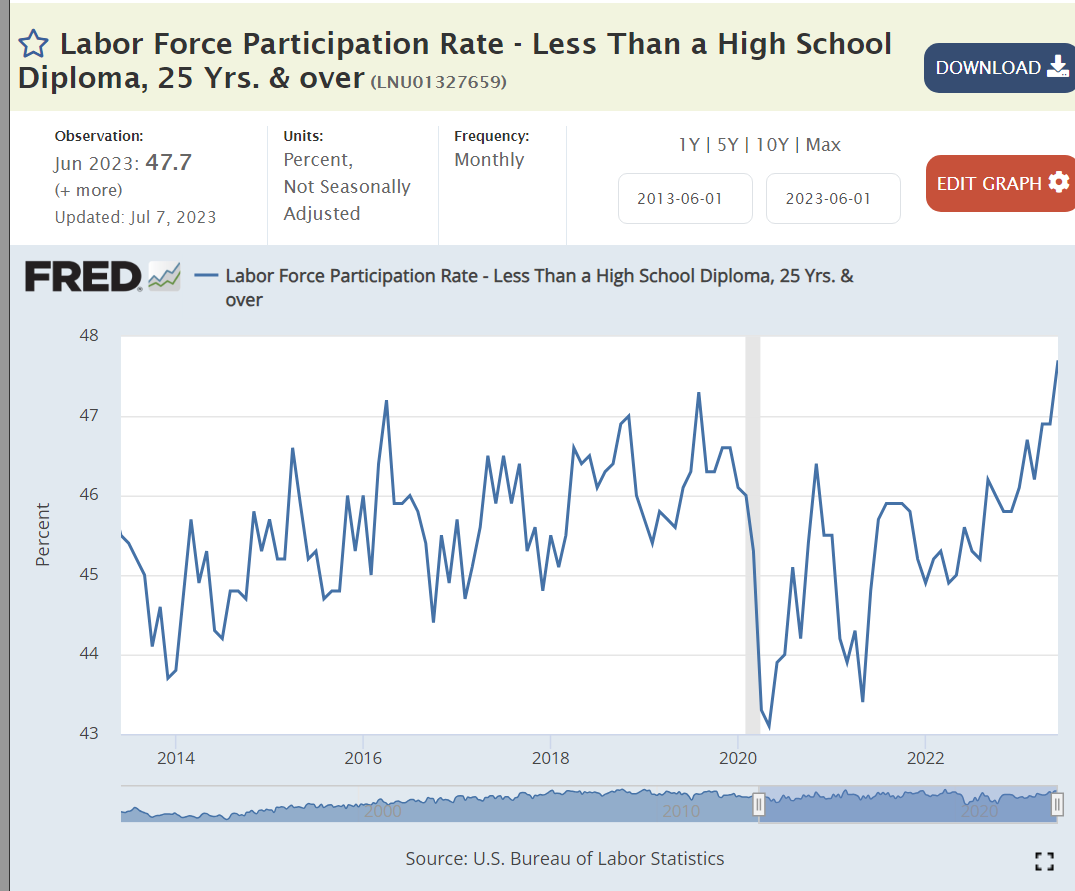
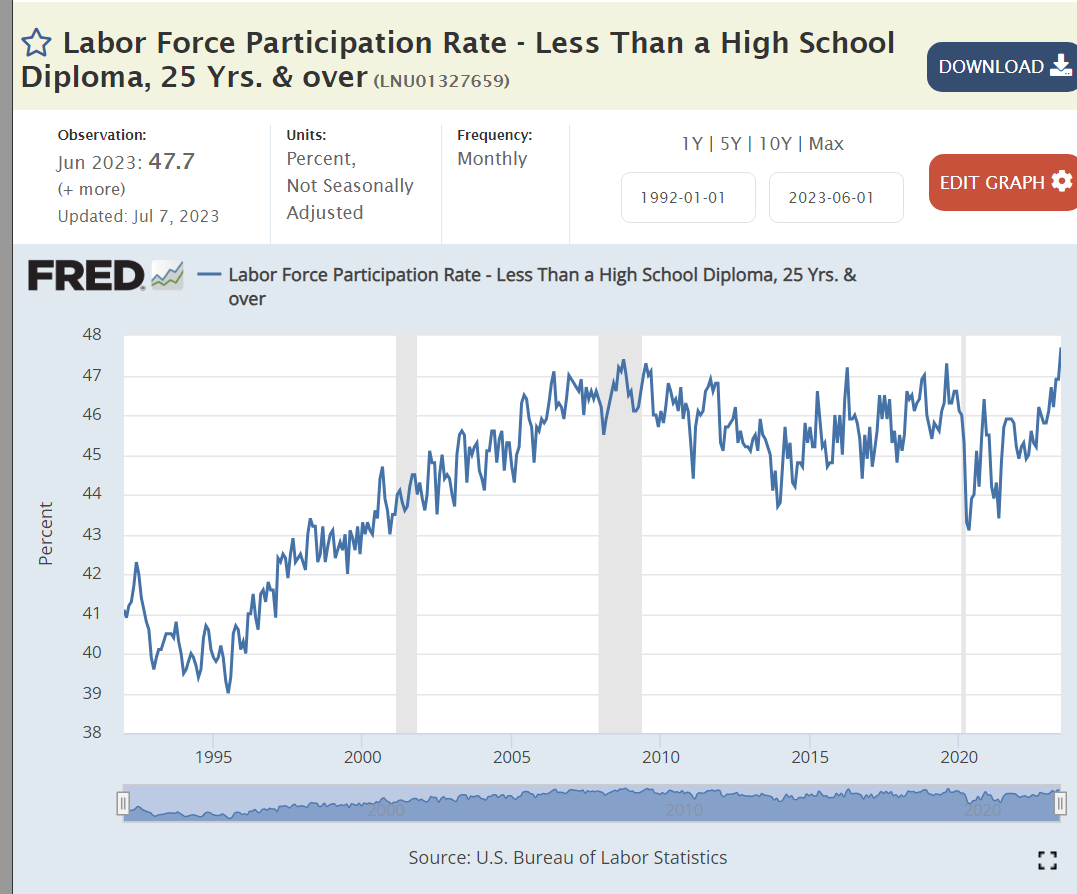
Non- high school graduates have added 1% to their labor force participation as real wages have increased.
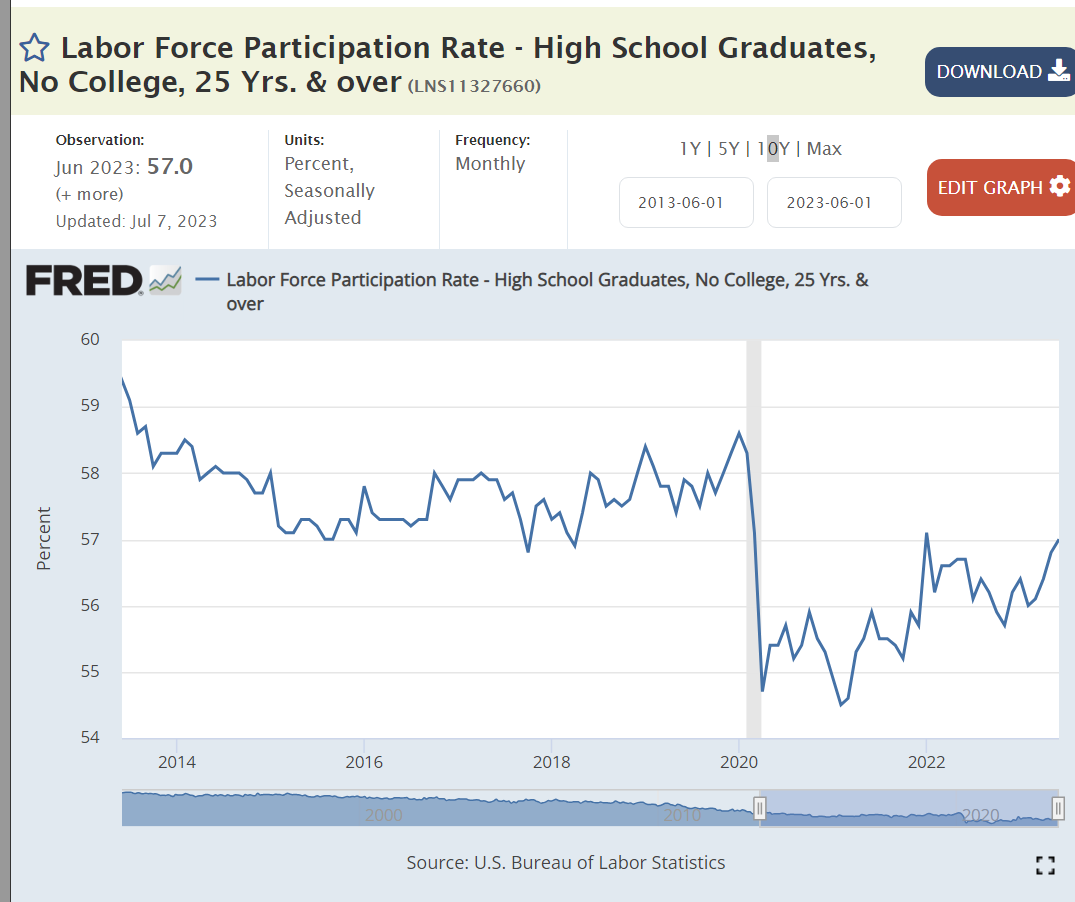
High school graduate participation dropped by three points before recovering by two points.
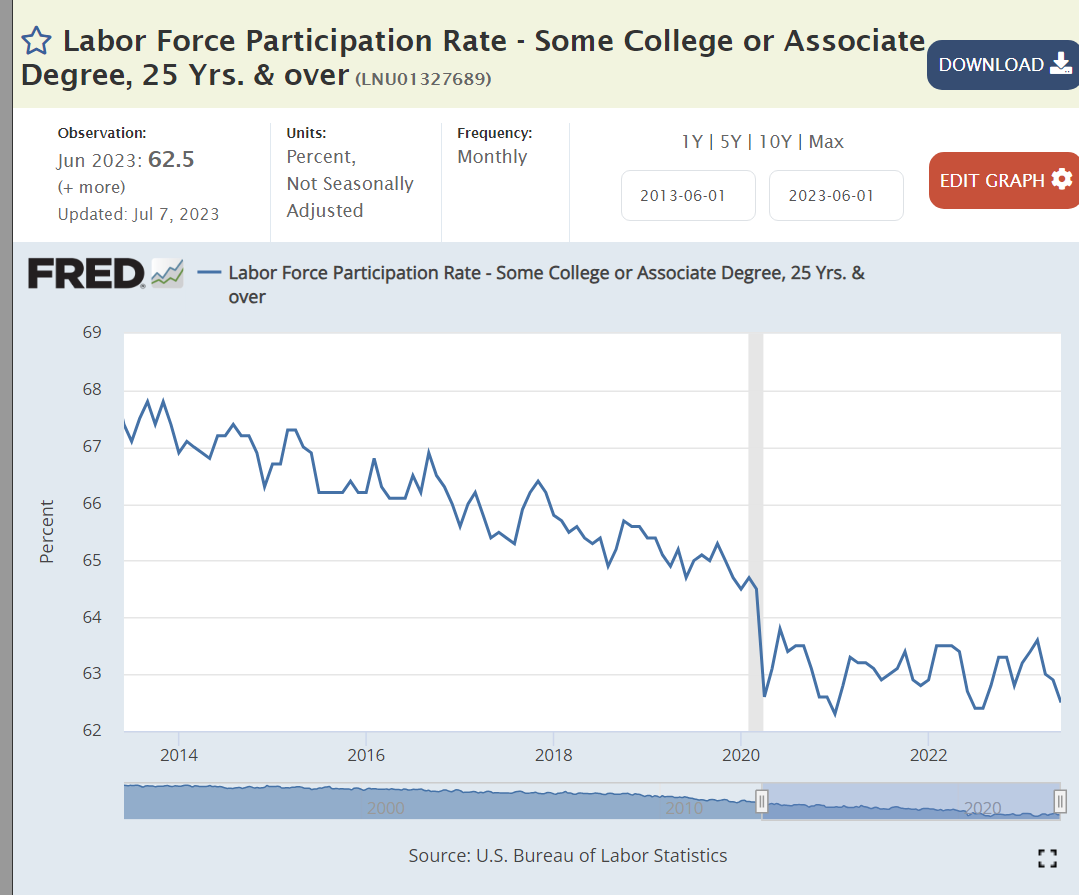
Individuals with some post-high school education, but not a bachelor’s degree, are in the middle range of US educational attainment. Their labor force participation rate had declined by almost 3 points in the 6 years before the pandemic, dropped by another 2 points during the pandemic and has not “recovered”.
Labor force participation by bachelor’s degree holders was stable before the pandemic, then dropped by 2 points and has since recovered by a little more than 1 point, remaining about one-half point below the prior average.
Individuals with a high school degree or higher have displayed drops of 10 points in labor force participation across the last 30 years. Most of this change is due to the “mix variance” of lower participation by an increasingly older and retired population, but some reflects other causes.
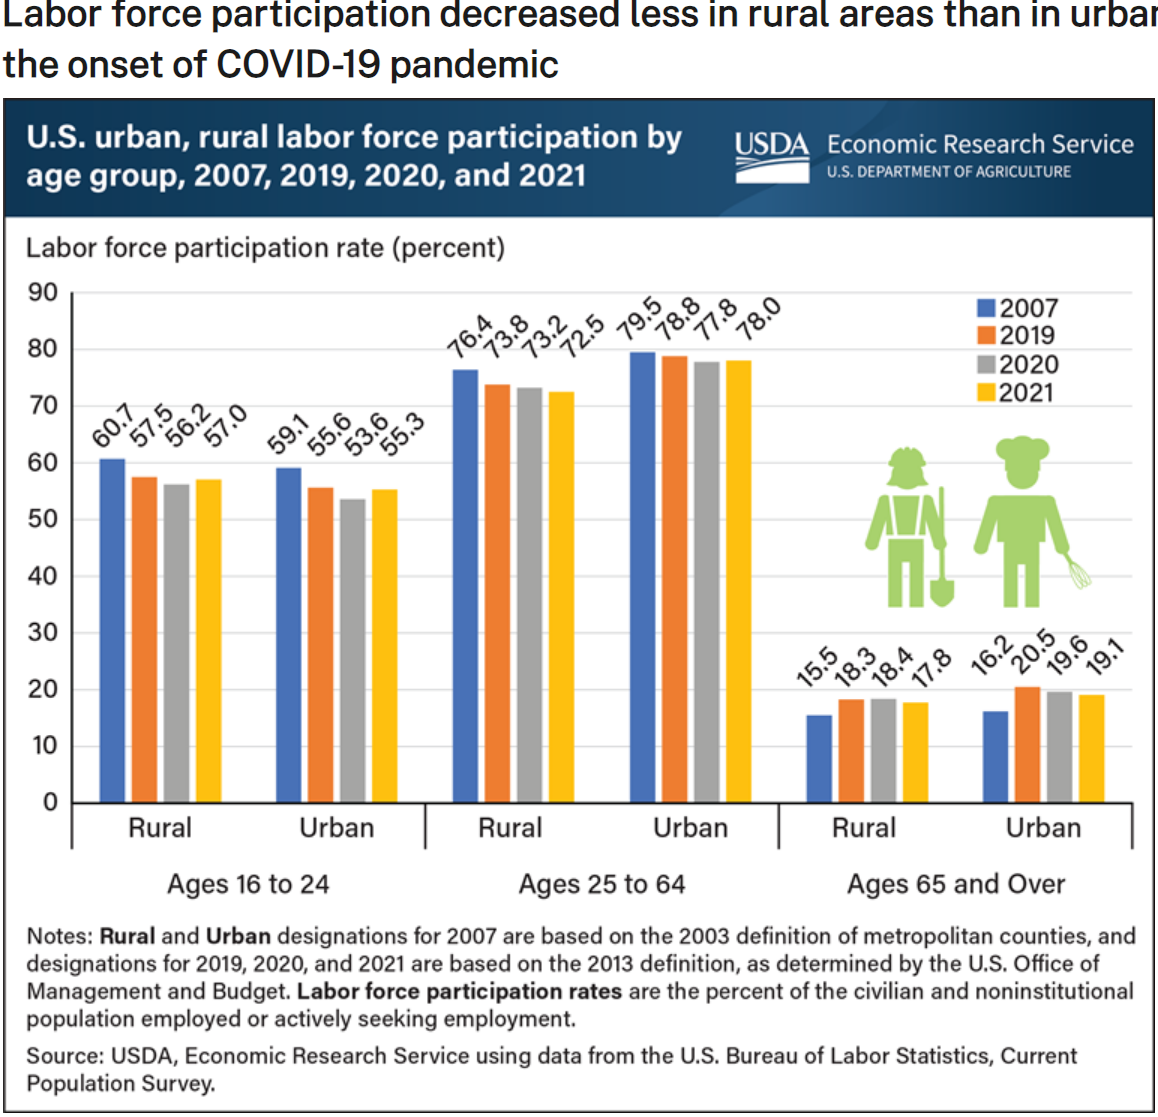
In general, rural labor markets have grown more slowly in the last 15 years and shown greater reductions in labor force participation. Some of the increased labor force participation in the last 2 years may reflect a recovery from these declines.
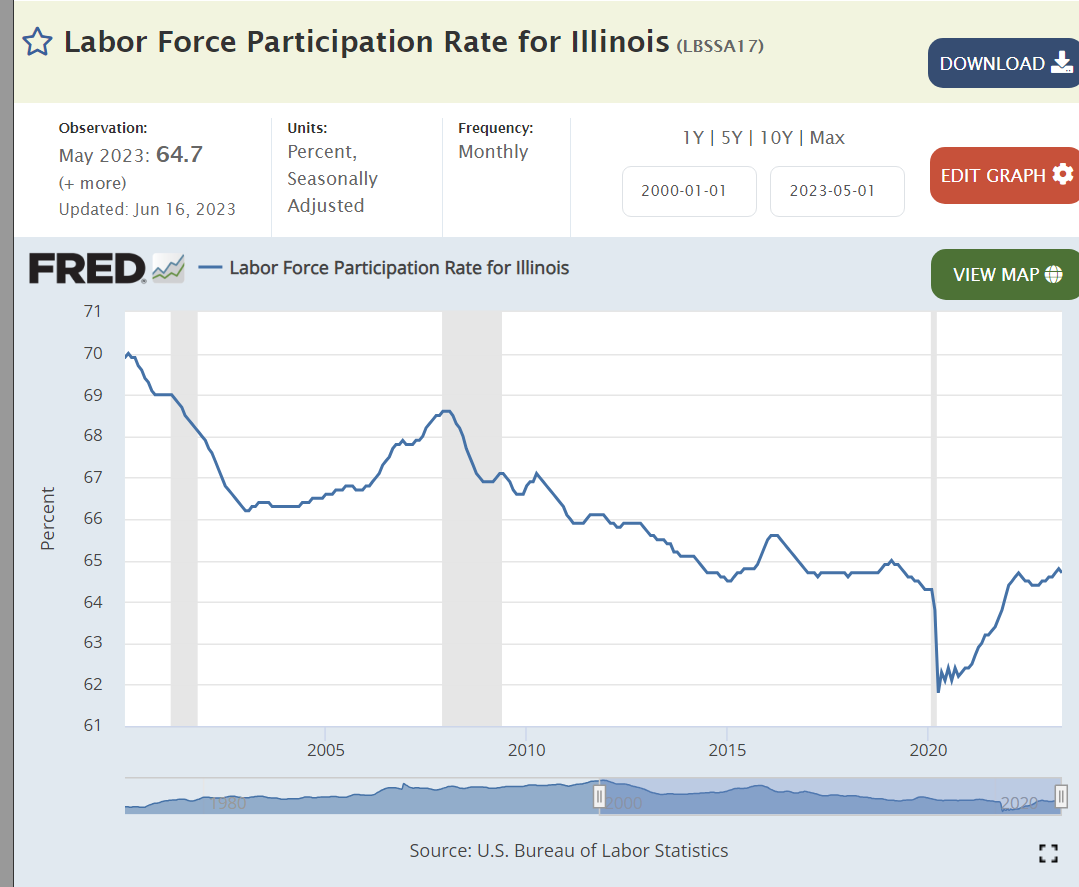
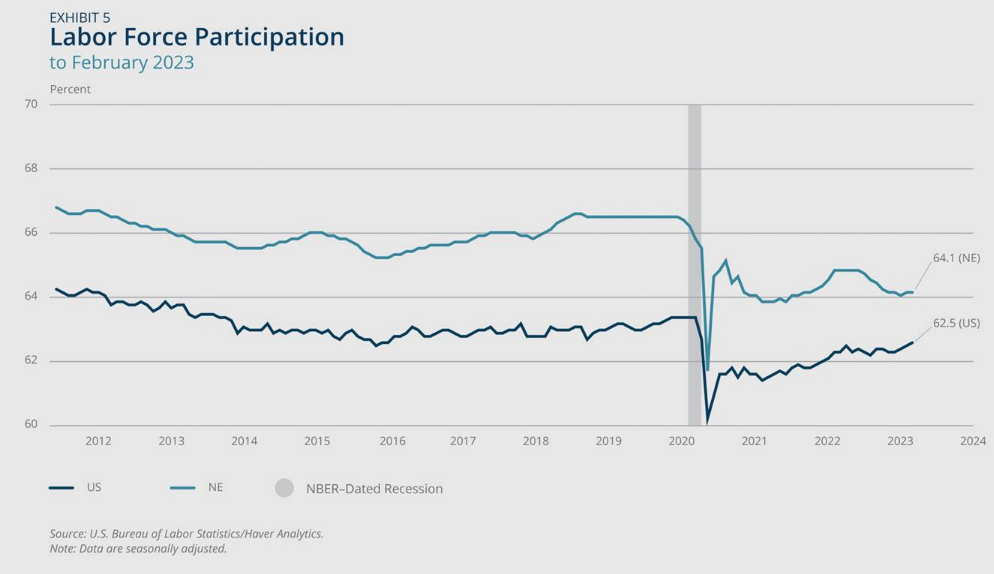
Most states show a similar pattern of labor force participation in the years before the pandemic, declining by 2-4% and afterwards recovering to their pre-pandemic level. California’s recovery has been slower. The New England states had an unusual increase in labor force participation before the pandemic and have not seen a major recovery after the pandemic.
Summary
Several sources decry the decline in the number of workers and the labor force participation rate, noting that it holds back the economic recovery and taints the 3.5% unemployment rate.
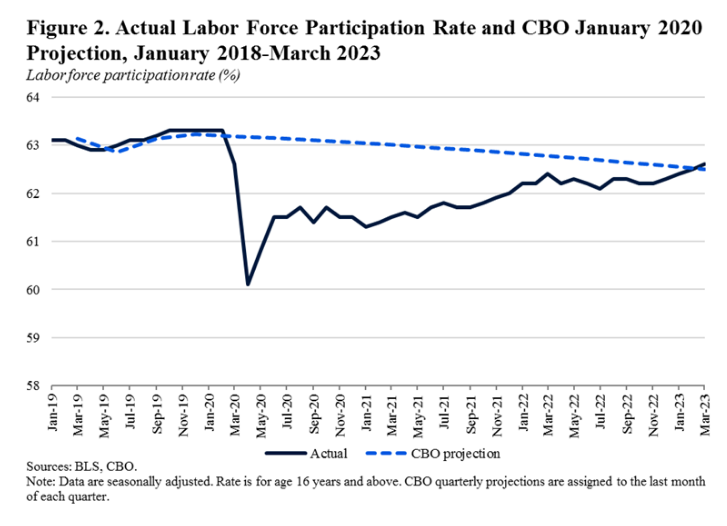
Other sources point to the long-term downward trends in participation as the biggest factor, mostly driven by an aging workforce and recent higher than normal retirement rates. Pre-pandemic forecasts showed a one-half point decline in participation, matching the actual 2023 data. Detailed analysis shows that the age adjusted participation rate is a little higher. The core group, aged 25-54 population, also shows labor force participation recovery to relatively high pre-pandemic levels. So … there are demographic, racial, education, birth country, rural/urban, location and state differences in participation. There are opportunities for higher participation in a strong economy and labor market. However, the recovery from the pandemic is complete, reflecting this strong economy and labor market.
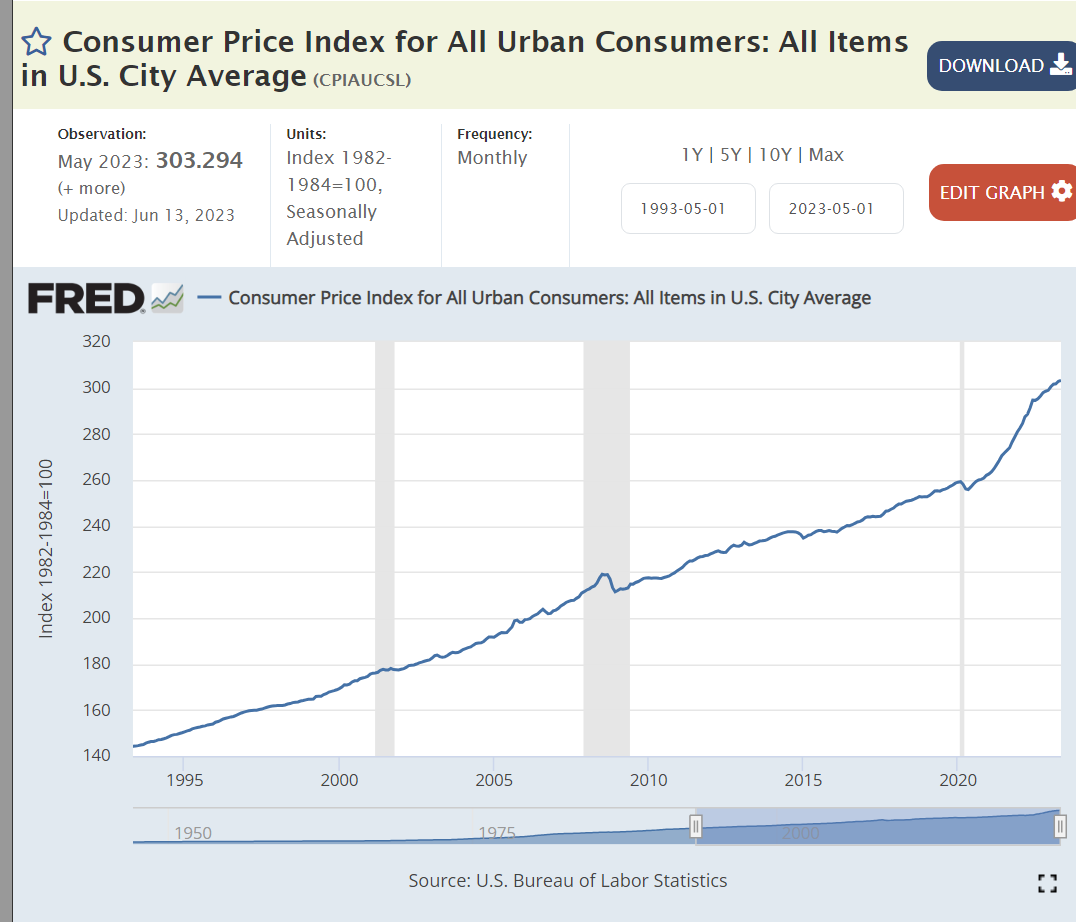
The overall CPI index increased smoothly during the last 30 years until the pandemic. The Great Recession created a small blip up and down. Prices have recently increased by a very large 15% in less than 3 years versus the usual 5% in that time.
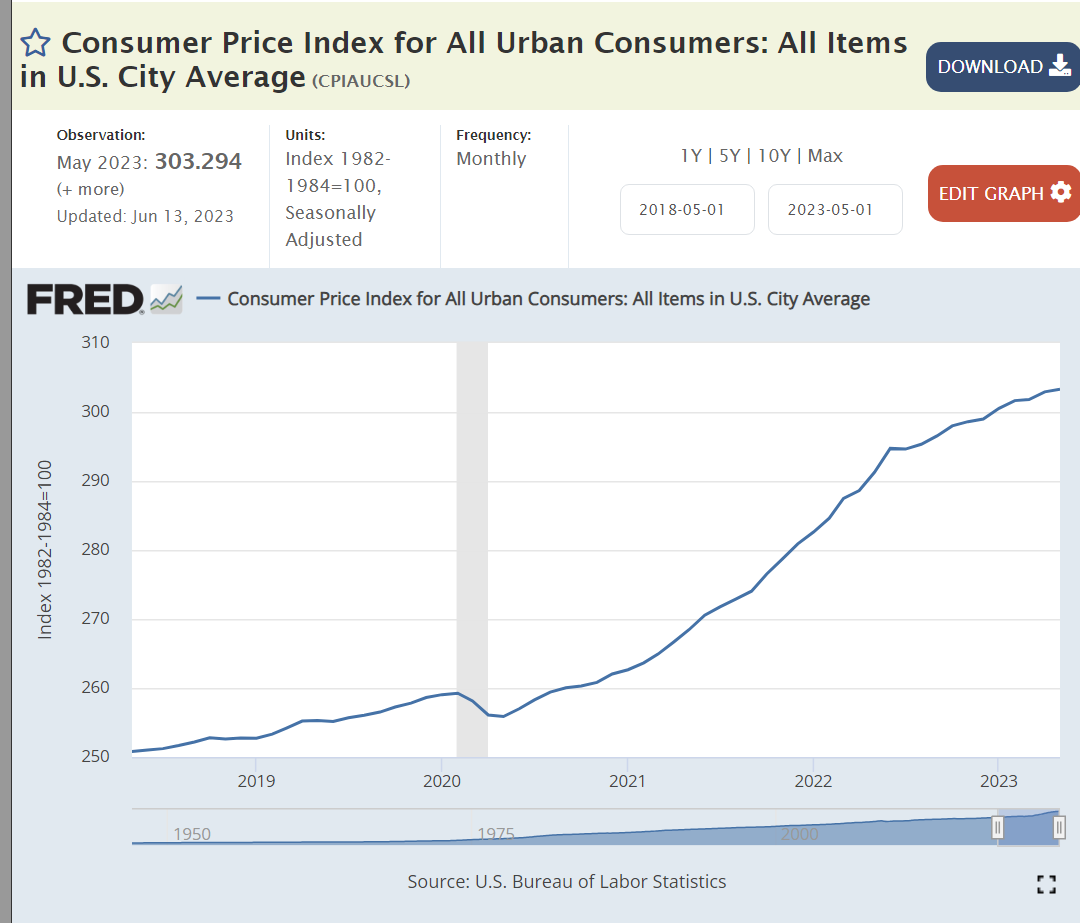
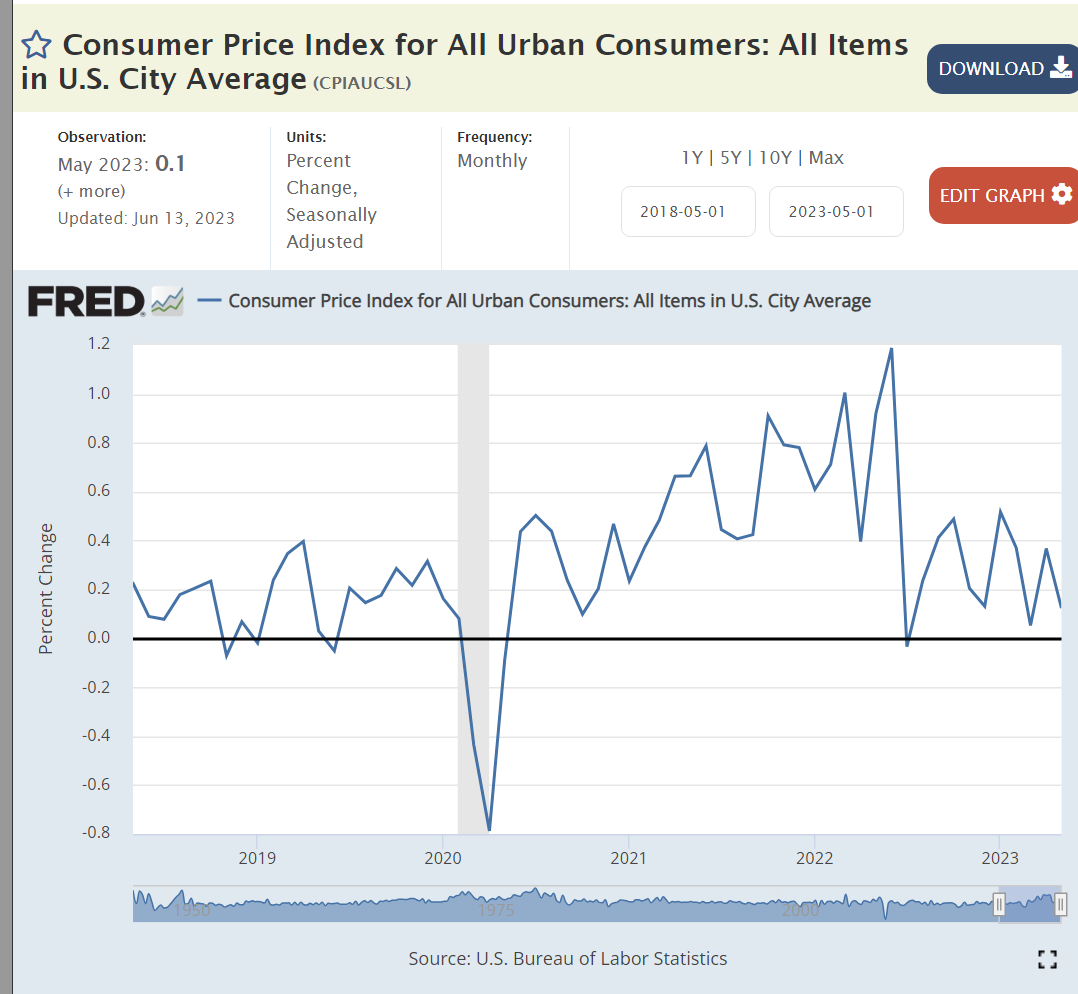
From June, 2020 through September, 2021 annual inflation jumped up to 5%. In the 9 months from October, 2021 through June, 2022, annual inflation spiked up to 10%.! This was mainly driven by durable goods prices as the unexpected rapid recovery from the pandemic encouraged consumers to buy “stuff” since they could not buy services. Since July, 2022 annual inflation is CLEARLY much lower, just 3% to 4% depending on the exact months chosen. Inflation appears to be decelerating as the May, November and May indices are 291, 299 and 303. The last 6 months’ inflation is just two-thirds of the prior 6 months.
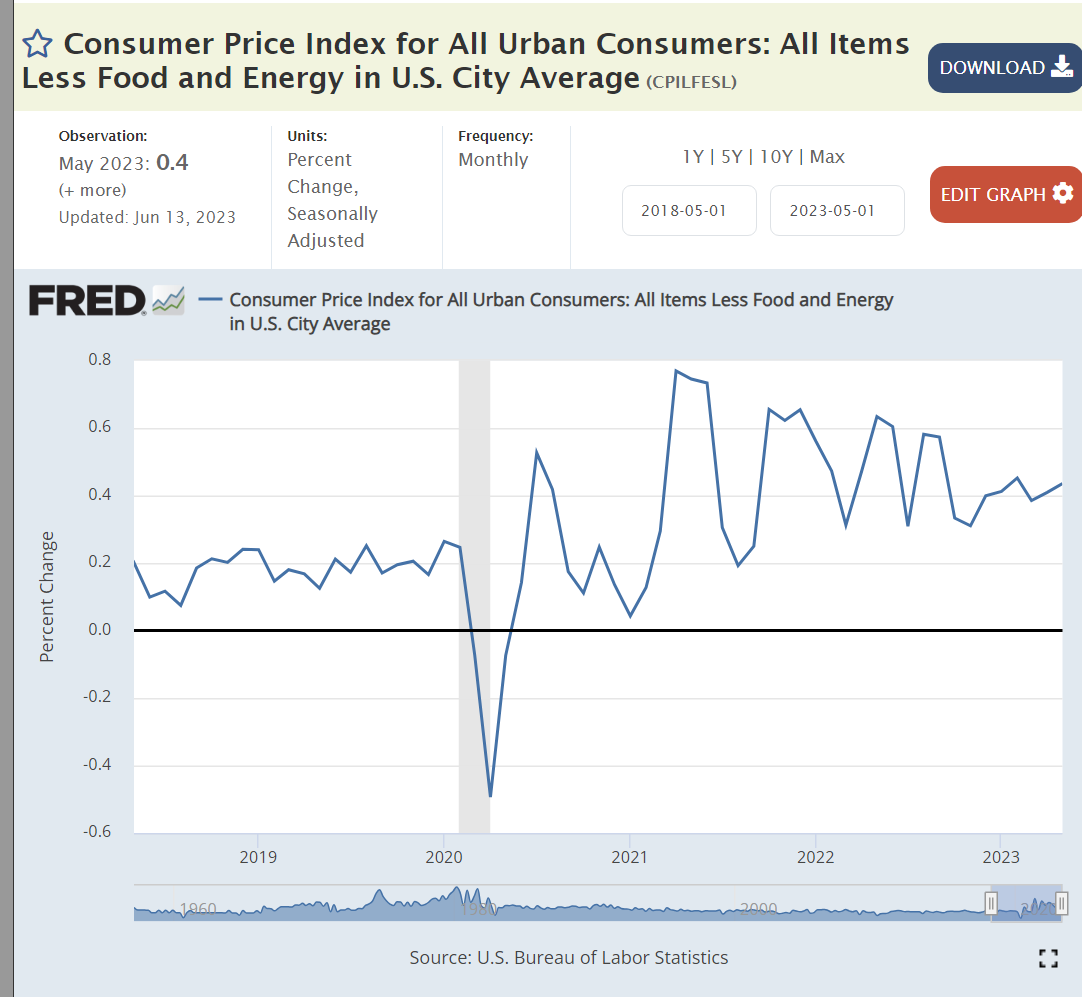
Unfortunately, the core inflation measure, excluding food and energy, remains near 5%.
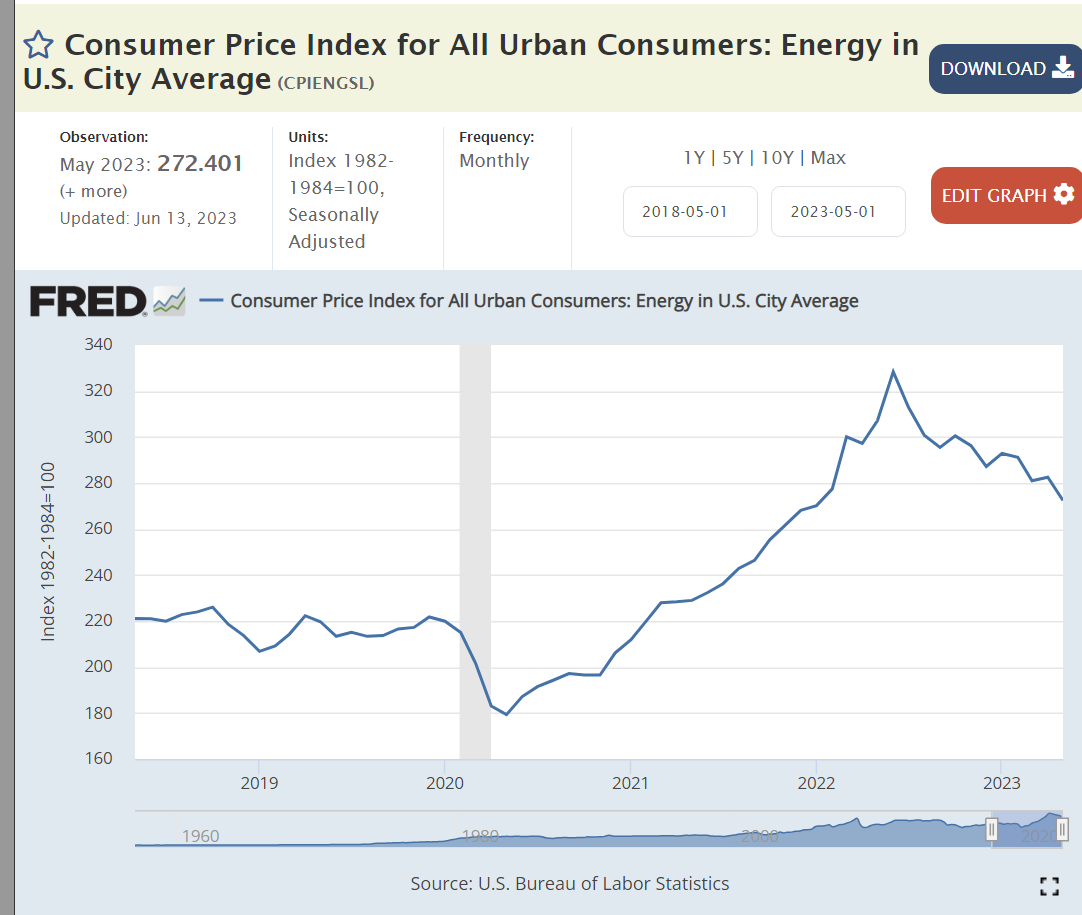
Energy prices have fallen quickly from their peak in June, 2022.
Auto gas prices are volatile, determined by the global oil market. The spike from $2/gallon to $4.50/gallon impacted American consumers. The return to $3.50/gallon is welcome, but prices are still 50% higher than the 2015-20 period.
In 25 years, durable goods prices had dropped by 25% due to globalization. In 2 years, they spiked up by 25% as global manufacturers were unprepared for the rapid recovery in demand. Manufacturers, wholesalers and retailers have NOT given back any of that 25% increase in prices, but durable goods inflation has returned to zero.
Nondurable goods followed a similar pattern with a 19% increase followed by flat prices.
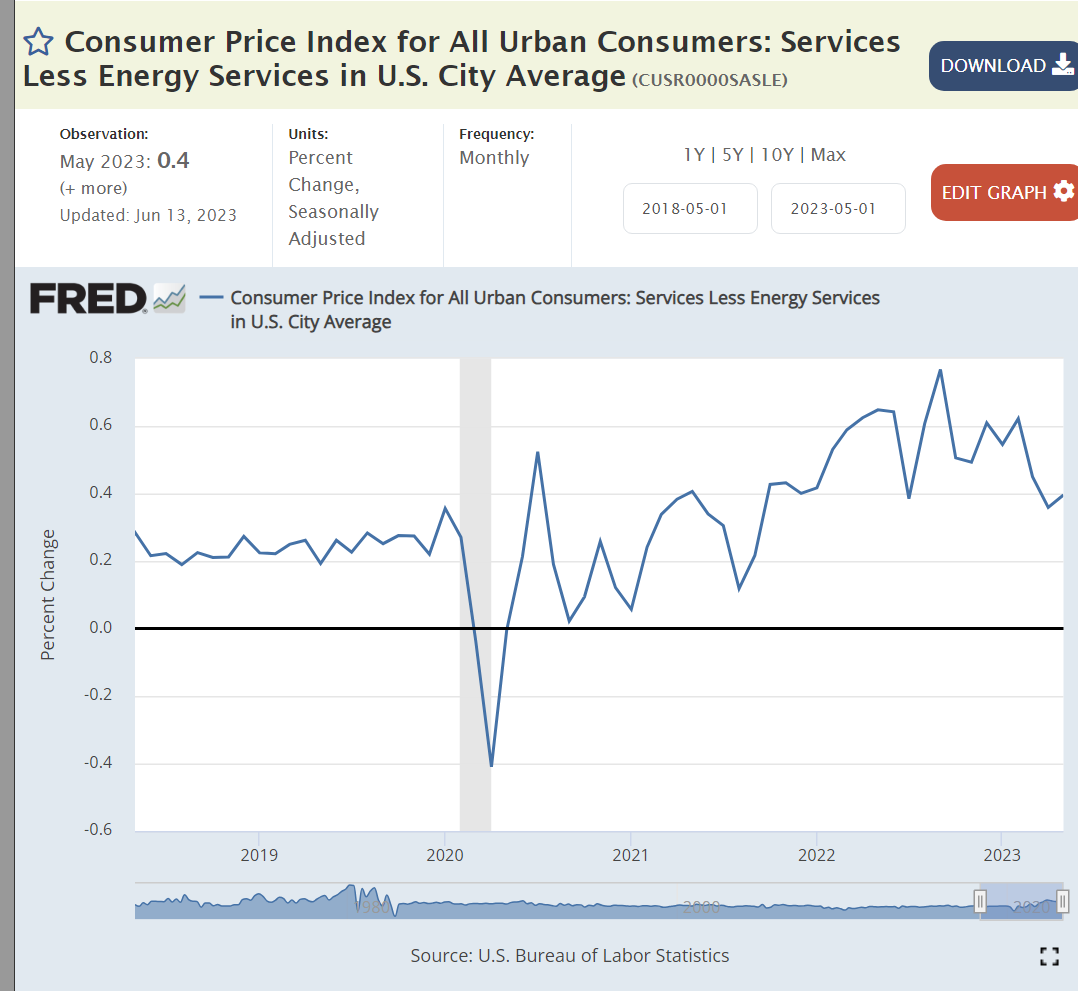
The services sector experienced mild inflation during the first 18 months of the pandemic, but has increased to a 6% annual rate as businesses re-established their business models and labor supplies. This sector has slowed to 5%, but remains the greatest concern for reducing the overall inflation rate.
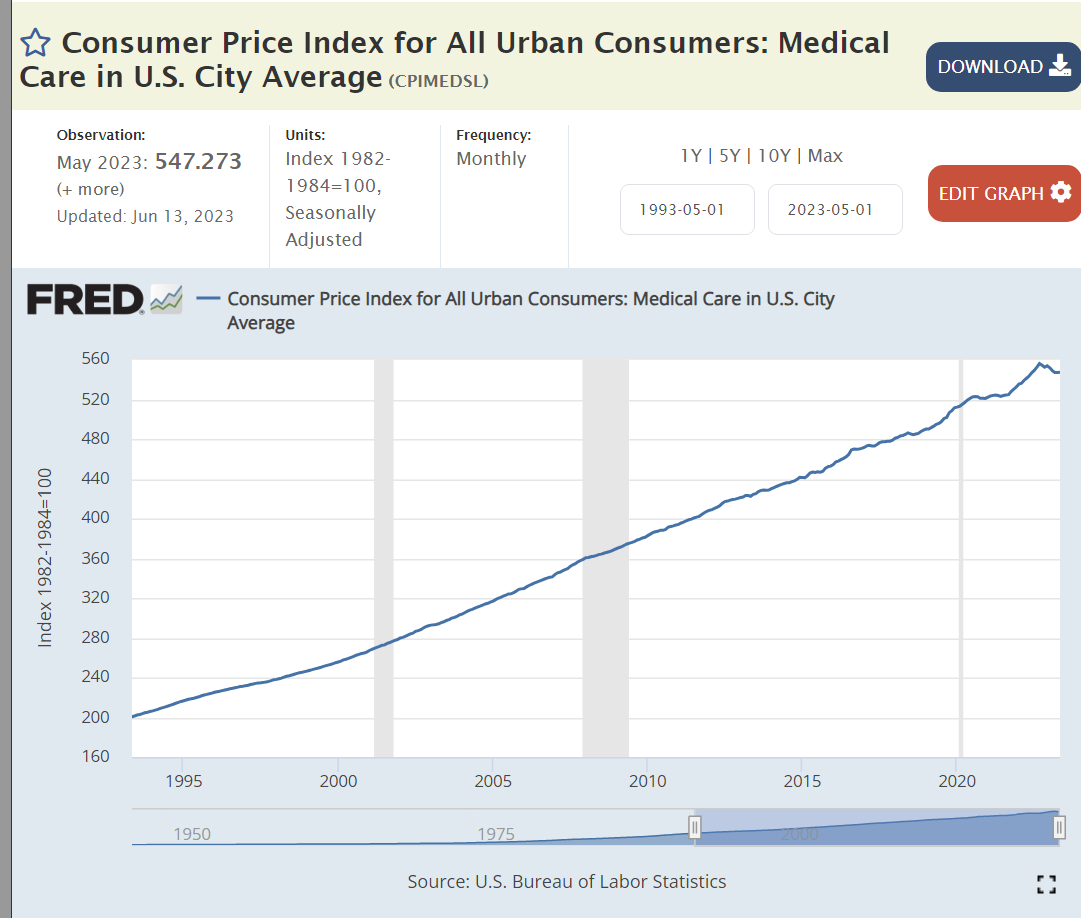
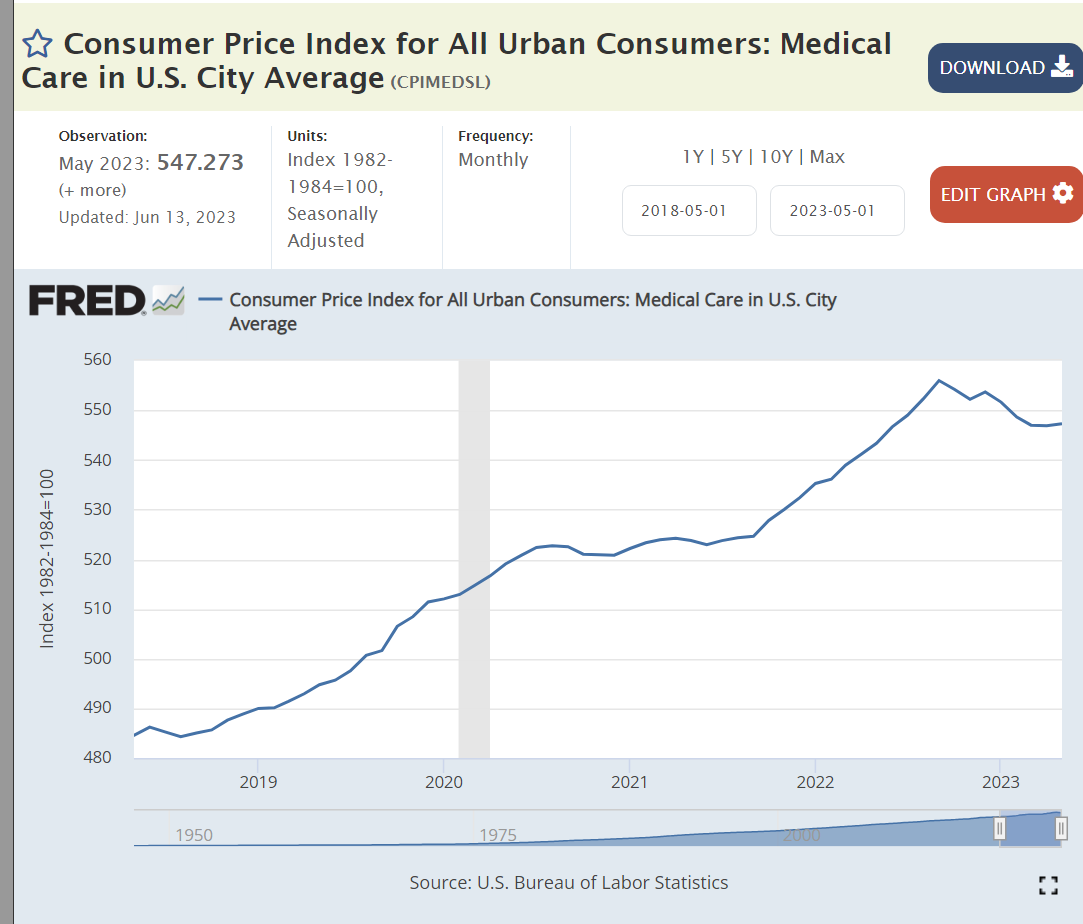
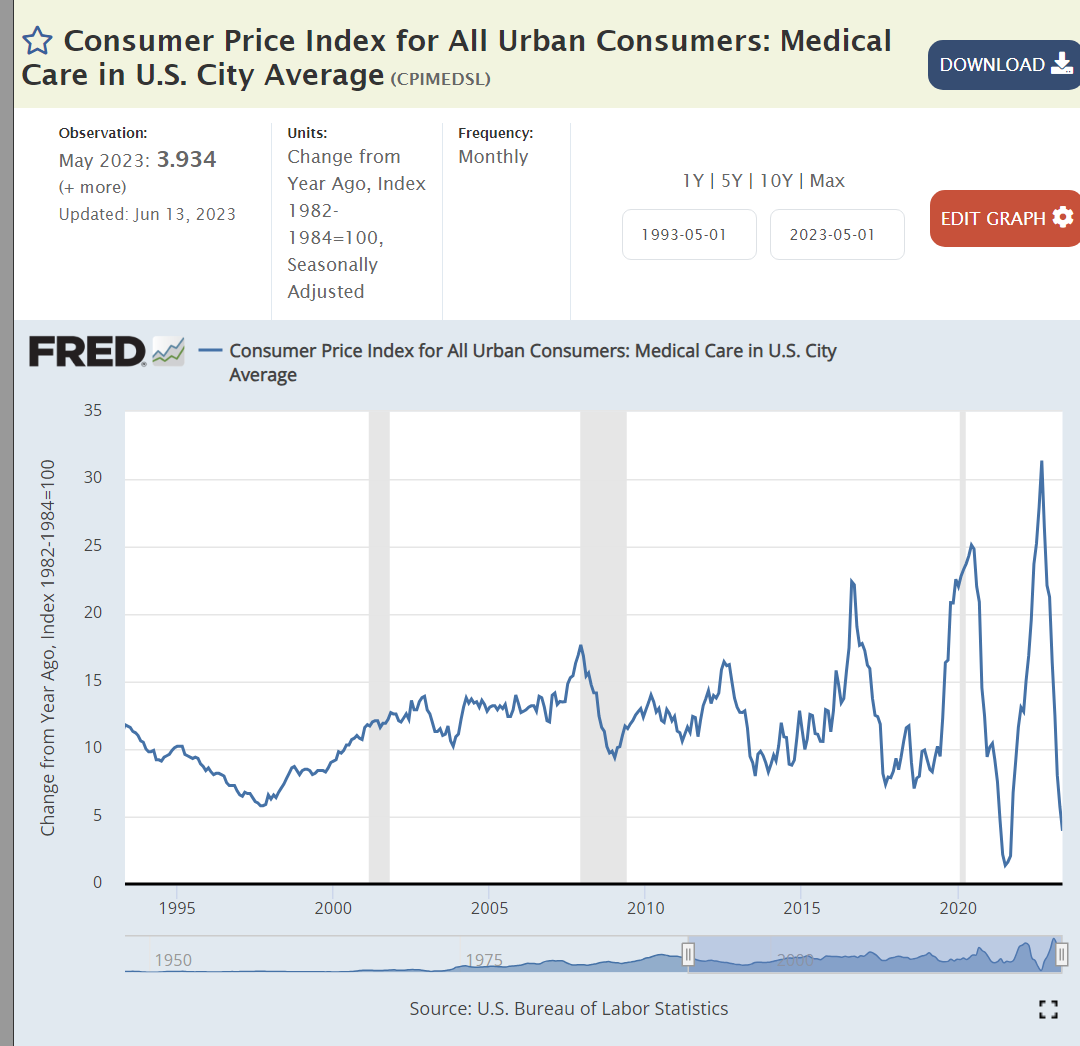
Medical care inflation remains at its 20-year level of 10% or more per year. As medical care has grown significantly as a share of the economy, it’s inflationary disease further infects the economy. Labor shortages play a minor role in this industry. The lack of competition or other incentives for real productivity improvements (Baumol’s disease) drive massive inflation even as US health results such as lifespans decline.
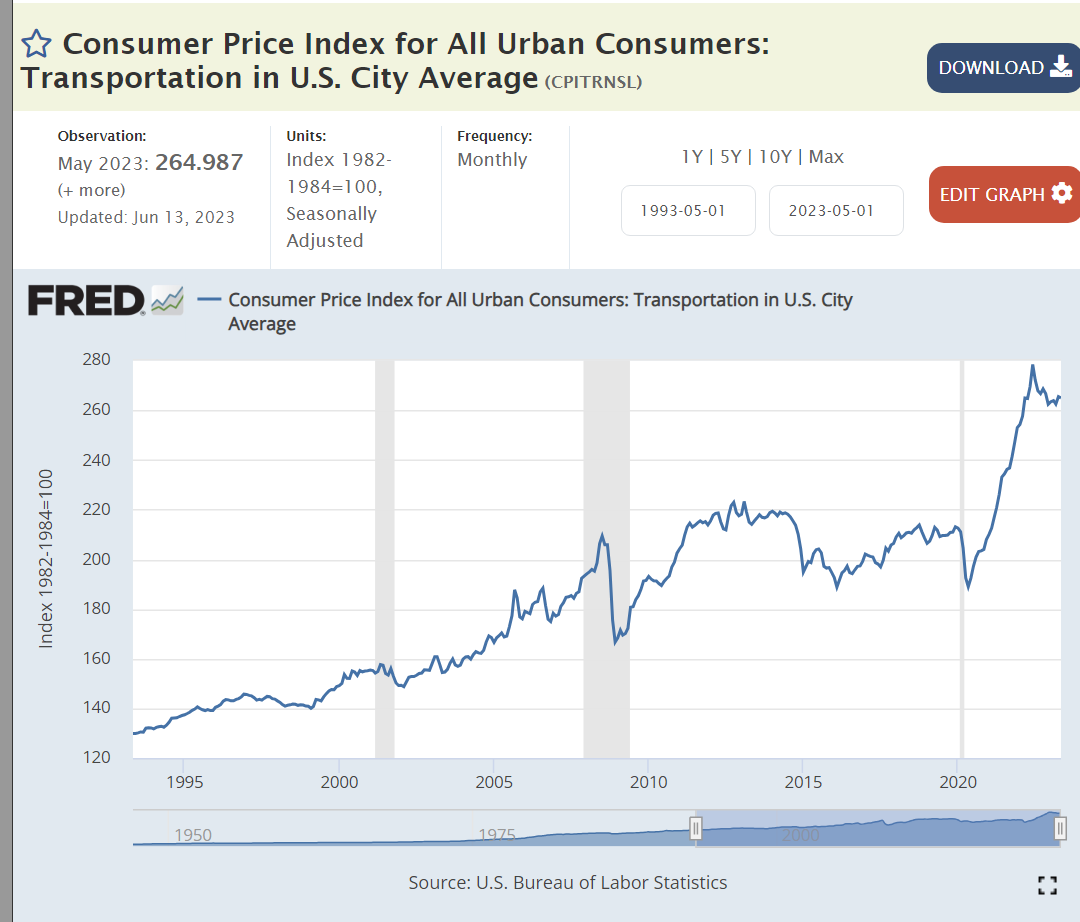
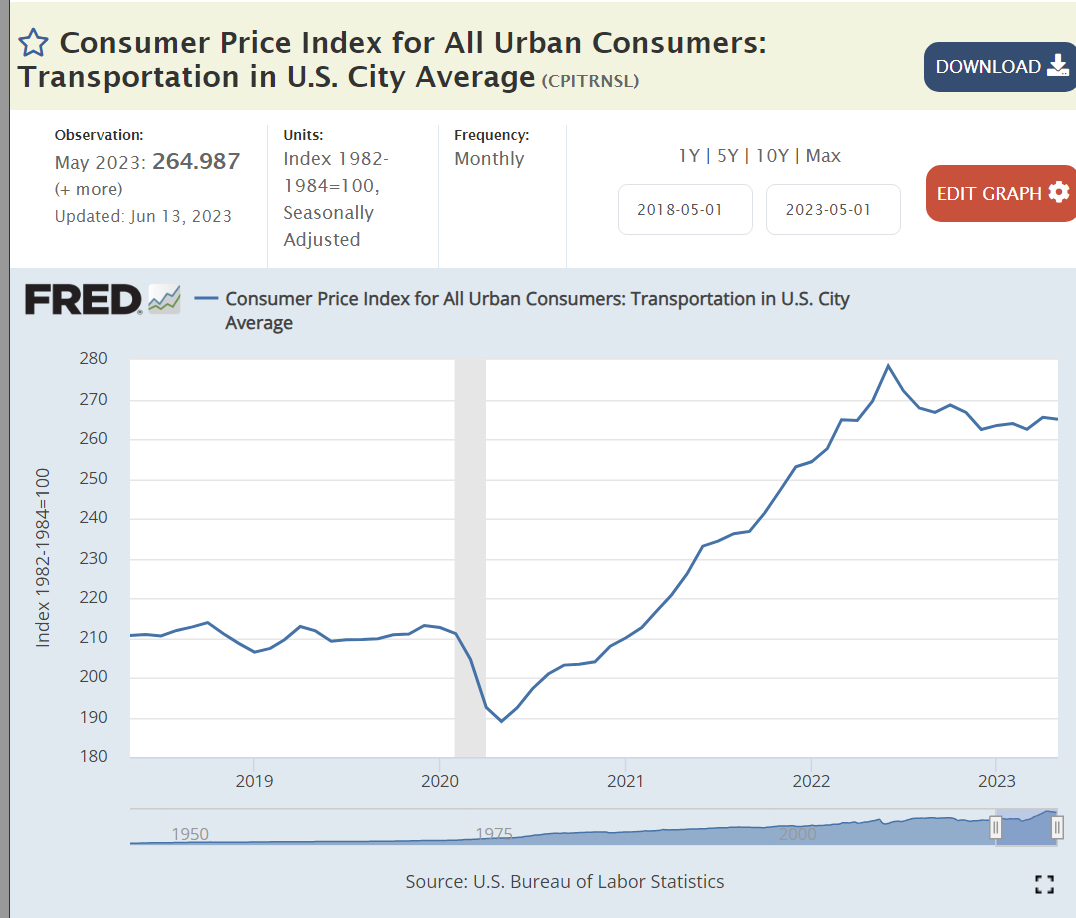
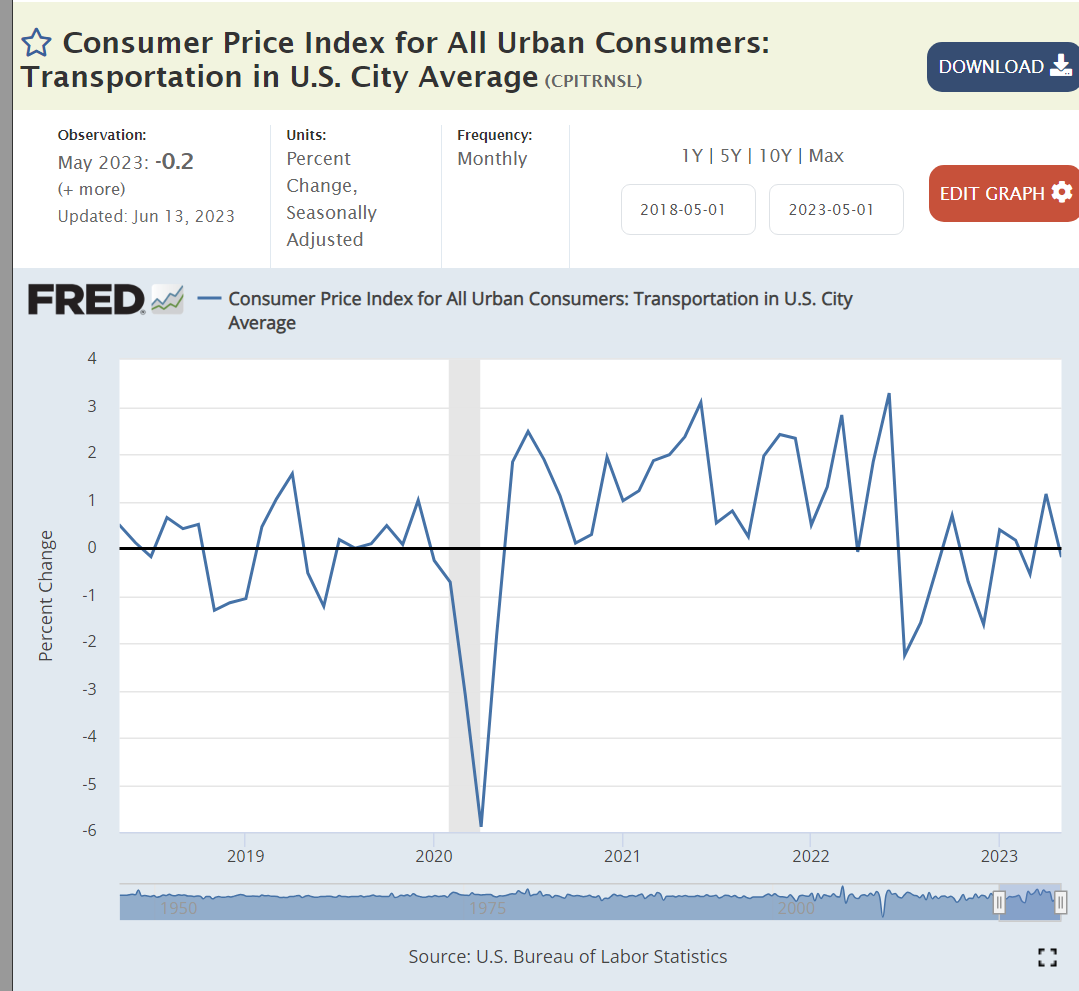
Transportation includes both durable goods and energy prices. A 25% price increase before it flattened off.
The used car and truck market experienced 50% price increases when the new car and truck pipeline was disrupted. Once again, prices have flattened, but not declined significantly to return to the pre-pandemic level.
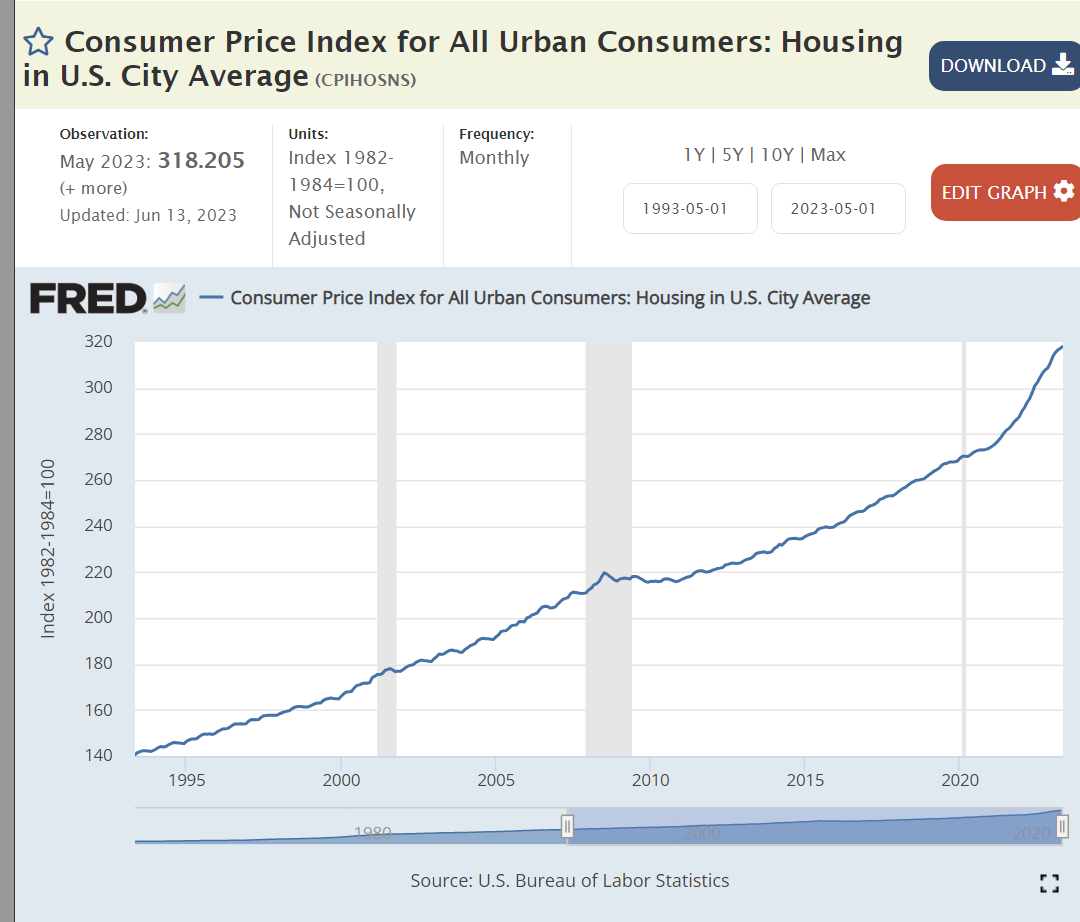
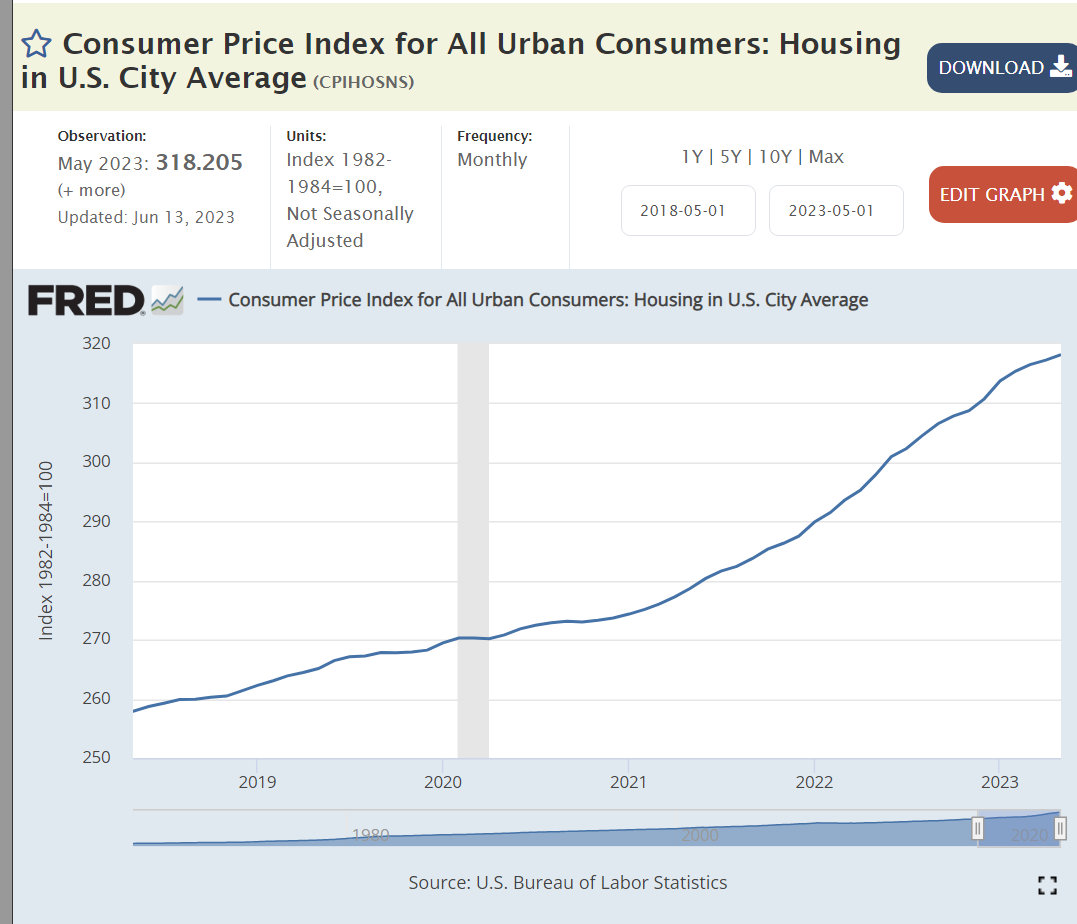
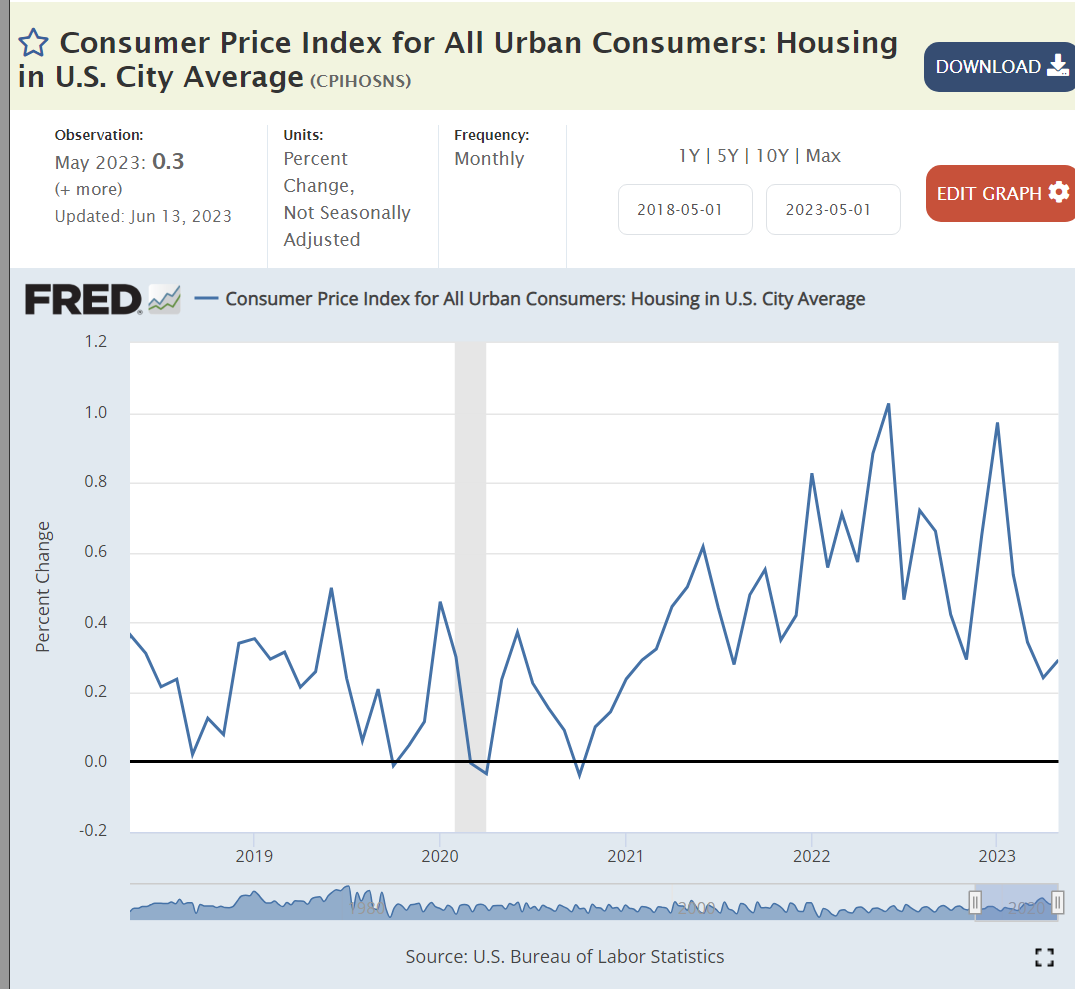
Housing inflation jumped up from 2% to 7% as the pandemic and subsequent Federal Reserve Bank mortgage interest rate increase disrupted the housing construction market. While housing inflation has declined from its peak, the long-term imbalance between supply and demand predicts some future inflation.
The 40% spike in home values was even higher than that shown for durable and nondurable goods. Flat prices make sense for the next year or two.
The jump in imports was driven by the increased demand for durable goods.
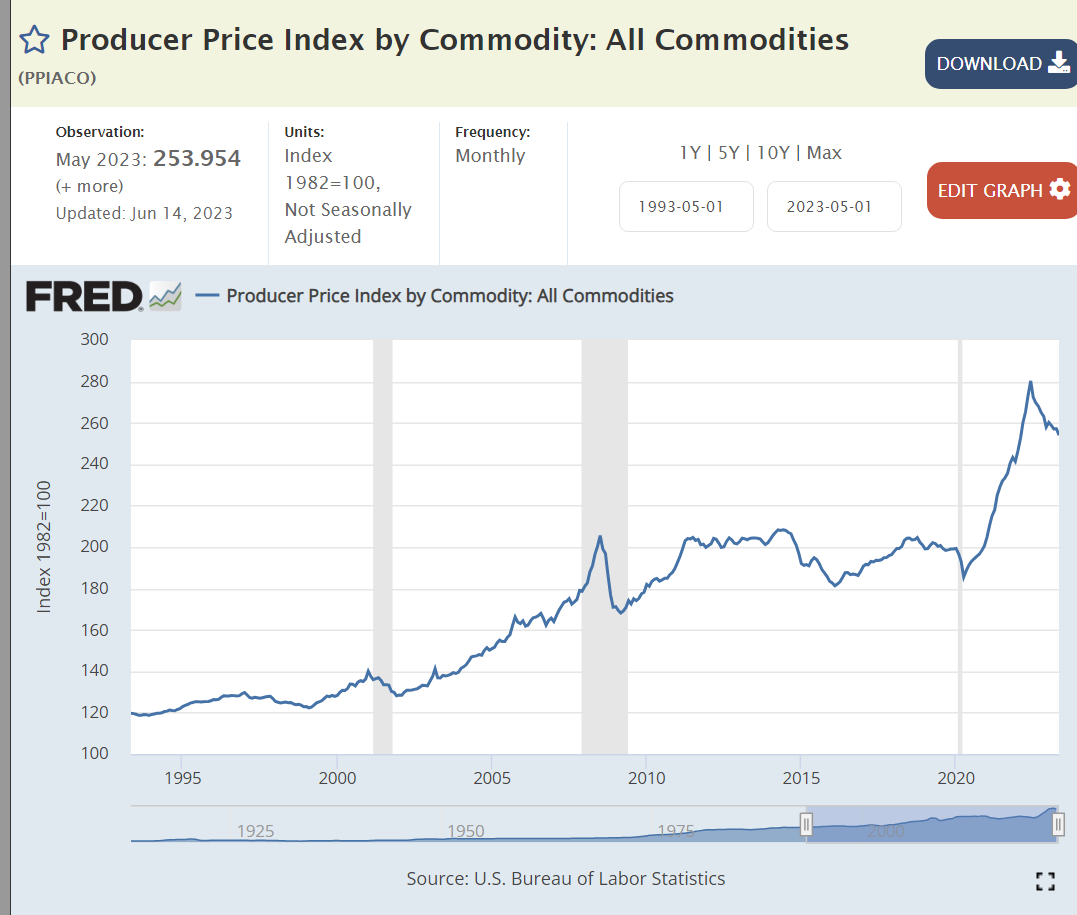
Producer prices were flat for 10 years, then up by 30%. No inflation remains, but some deflation is possible.
From 2015-20 historically high demand for labor drove a 7% increase in real wages as unemployment reached a 30 year low of 3.5%. For the last 3 years wages have trailed inflation. No wage-price spiral.
Until February, the federal government budget deficit had returned to the pre-pandemic 2019 pattern. In the last 3 months spending has accelerated, adding to aggregate demand and causing the economy to expand faster, perhaps beyond its limits, supporting greater price inflation.
The government response to the pandemic threat generated much greater savings and subsequent spending/aggregate demand than any recent recession situation. The benefits have now mostly run out. Consumer demand has remained high but will likely decline.
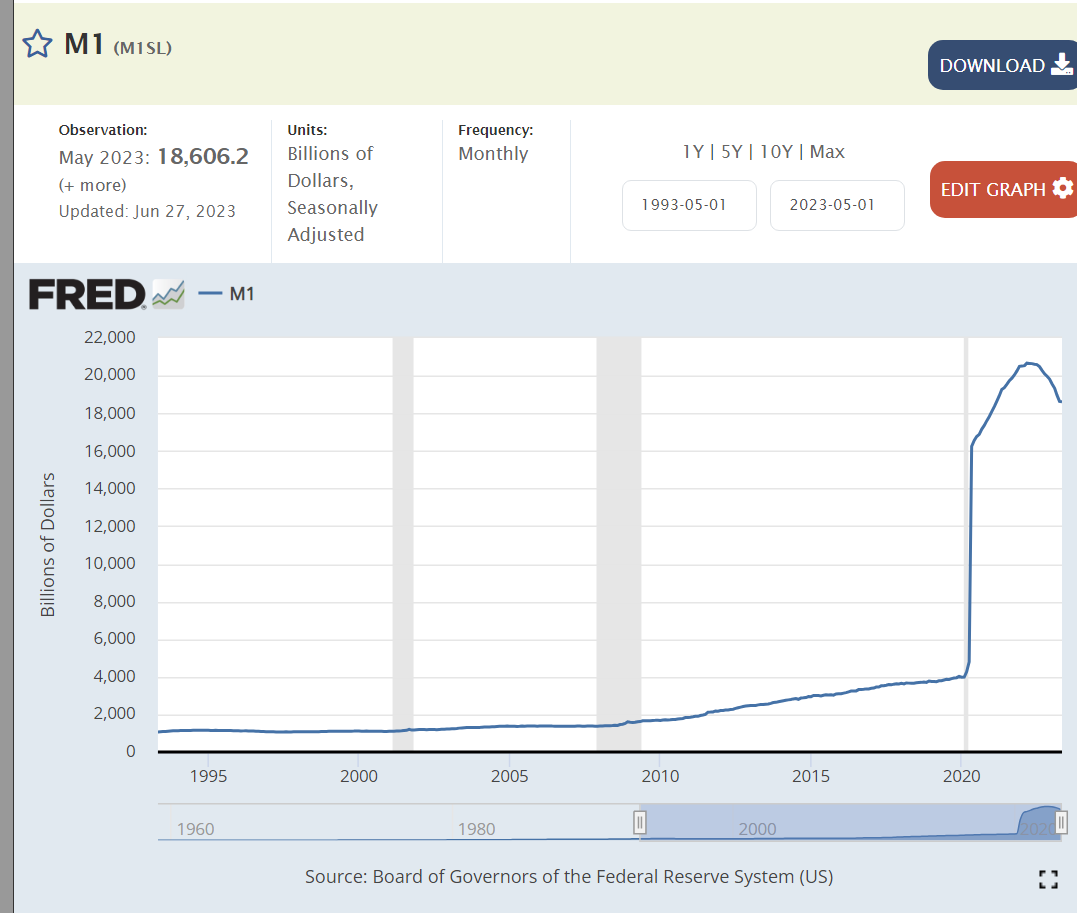
The unprecedented expansion of the money supply by the Federal Reserve Bank in 2020 is difficult to explain or analyze. The Fed responded to the clear risk of a banking system collapse by providing “loose money” access to all entities. This monetary expansion did not result in immediate consumer inflation, but it did help to inflate asset prices: investments and housing. The Fed has begun to reduce its holdings of assets as it tries to increase interest rates.
The Fed has more than doubled interest rates. This has slowed down the housing, stock and acquisition markets.
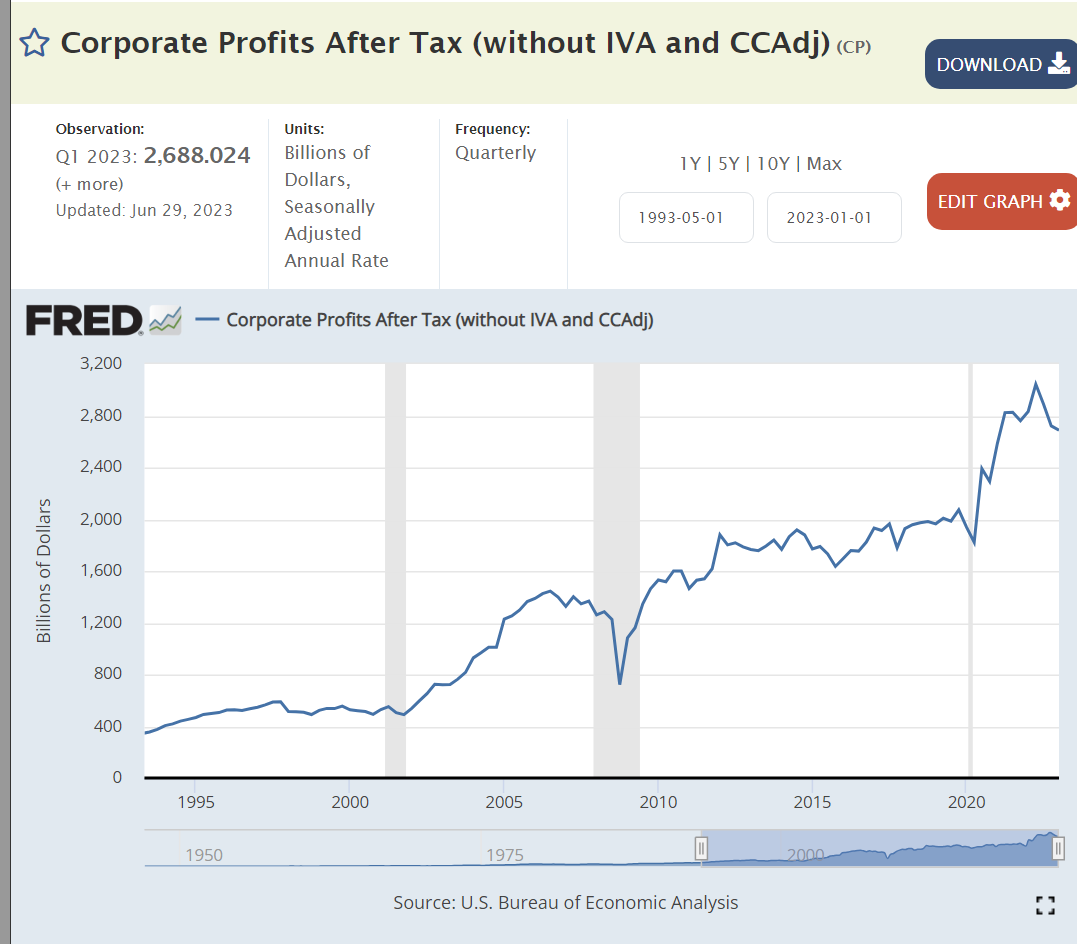
Corporate profits tripled from $500 billion in 2000 to $1.5 trillion in 2007. Profits slowly grew up to $2.0 trillion by 2019. Profits spiked by another 40% in response to the pandemic opportunities.
The drivers and components of inflation mostly point towards lower inflation in 2023 and 2024. The Fed is going to increase interest rates again this year which will reduce housing starts and corporate capital and inventory investments. The economy has so far resisted the higher interest rates, but the cumulative impact of tighter credit and lower savings will eventually offset the optimism of a historically positive labor market.
Summary
The pandemic caused producers to initially reduce their productive capacities. The unexpected rapid recovery of demand prompted by loose monetary and fiscal policies caused demand to greatly exceed supply. Inflation peaked at 7% and then began to drift back down. Corporations took advantage of the disruption to sharply increase prices, which have now flattened but not declined. Excessive fiscal policy (budget deficits) and high consumer spending driven by extremely tight labor markets driven by historically high corporate profits have maintained aggregate demand and prices.
There is a “tipping point” situation in this economy. The Fed is increasing interest rates. This is slowing consumer borrowing and housing demand in the face of demographic factors that normally promote new household formation and the economic benefits that typically accompany this investment. Consumers are using their pandemic driven savings to consume but are now running out of savings. The stock market very quickly recovered from the pandemic, but then declined and has since partially recovered based on a narrow set of AI based tech companies. The banking and credit sector is at risk, with several high-profile bankruptcies, but no clear evidence of a panic. Corporations are earning record profits, benefitting from prior low-cost debt, but struggling to hire employees. Overall, I think that prices will fall back to the 2% level by the middle of 2024.
In my adult lifetime, the minimum possible sustainable unemployment rate was said to be 5%. It could be a little bit lower without driving inflation much higher, but not much lower. Well … in 2018-2019-2020 we reached a solid sub-4% rate and stayed there, without triggering accelerating inflation. In a short 2 years after the pandemic shock, we returned to sub-4% unemployment.
At the state level, we have 19 states with less than 3% unemployment, a previously unimaginably low level. We have 40/50 states below 4%.
At the metro area level, the results are even more amazing. A majority of the 389 areas have unemployment rates of 2.9% or lower. 3 New Hampshire areas have unemployment rates of 1.1%. Seven Alabama metro areas show 1.6% unemployment!
The relationships between firm size, age, growth, survival, death, locations and job creation and retention are many, complex and politicized. However, the core relationships expressed in my 2 recent posts are well supported by data and theory. I’d like to share more background information.
The 10-year job survival rate for startups is roughly 80% and has improved in the last 10 years. However, the FIRM survival rate is much lower. The surviving firms, through economic natural selection, grow rapidly from a low (4 average employees) initial base.
This study of 2011-14 highlights the initial start-up job surge, followed by 10 years of net job attrition and then modest net job growth by mature firms when low firm death rates (5%) are exceeded by decent levels of net jobs added.
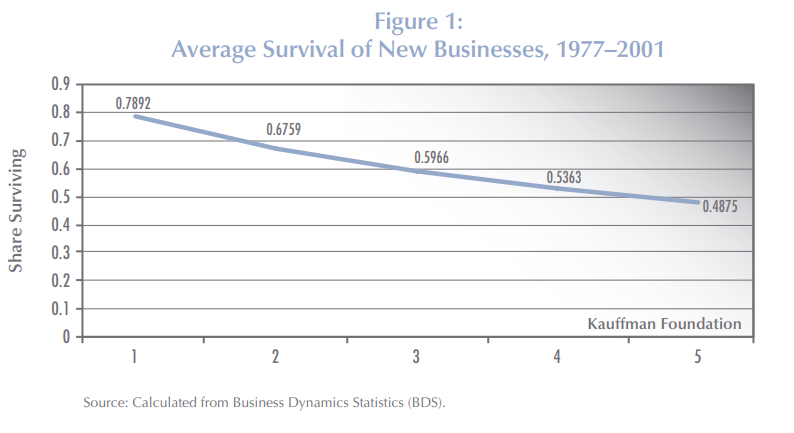
The Small Business Administration (SBA) reports the average firm survival rates for 1994-2019 as roughly two-thirds for 2 years, one-half for 5 years, one-third for 10 years and one-fourth for 15 years.
My review of the 10-year data confirmed the 33% rate for most of the period, with an increase to 36% for firms that began after the Great Recession in 2010-12.
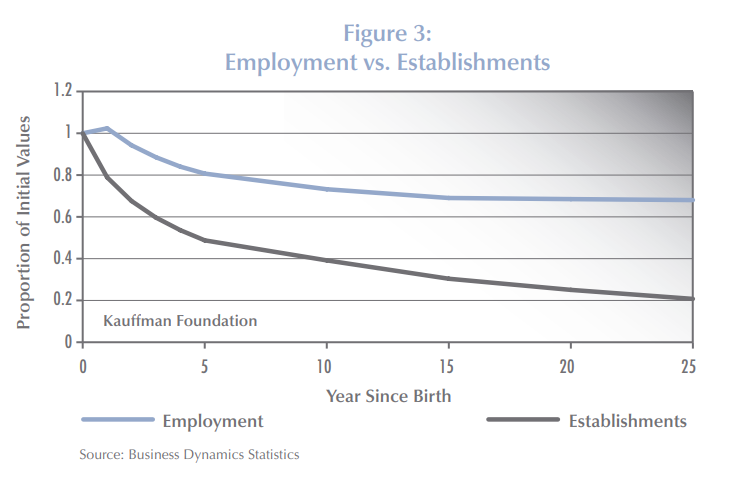
In 2010, Kauffman Foundation researchers summarized the detailed Business Dynamics Statistics (BDS) data, showing the relatively slow decline in net added employment from 100% initially to 80% at 5 years to 70% at 15 years and the rapid decline in the surviving firms rate to one-half at 5 years, 40% at 10 years and just 20% at 25 years.
Another Kauffman report from 2010 shared similar results. The universe of firms is dominated by young firms because the cumulative attrition makes “mature” firms quite rare.
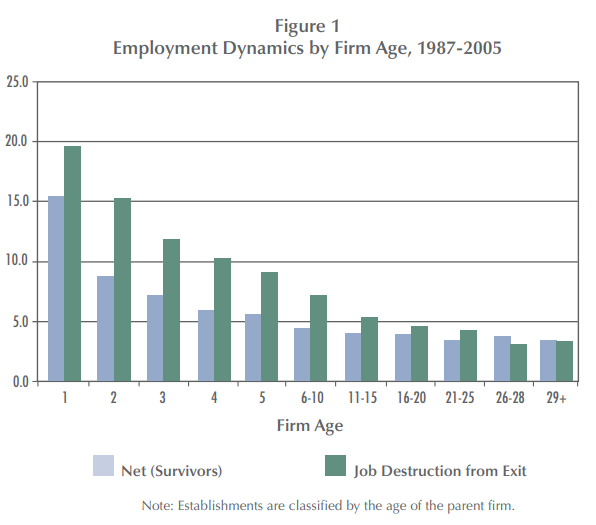
Another Kauffman report in 2009 summarizes this competition between dying firms killing jobs and surviving firms adding jobs. In the first 5 years, the firm failure rate is so high that it overwhelms the high job growth rate of those successful startups. In years 6-10, the death rate is still winning, but the total net job destruction is much smaller. For this 18-year data set, firm deaths exceed added jobs at every age, although 29+ year-old firms basically break-even. This is a critical insight when thinking about the claim that all or nearly jobs are added by startups. It is “true” due to the firm survival and jobs added rates at different ages. It is possible to have quite different results, with existing firms accounting for relatively more jobs, but that would require either the firm/establishment death rates to fall or the job creation rates of surviving firms to increase significantly. It looks like there has been some of that change after the Great Recession. This chart also helps to show that the “net, net” addition of jobs from start-ups, when considered as the sum of their first 5 years is in the 75-80% range, because the net jobs lost in those early years is only 5% per year, despite the more rapid loss of firms.
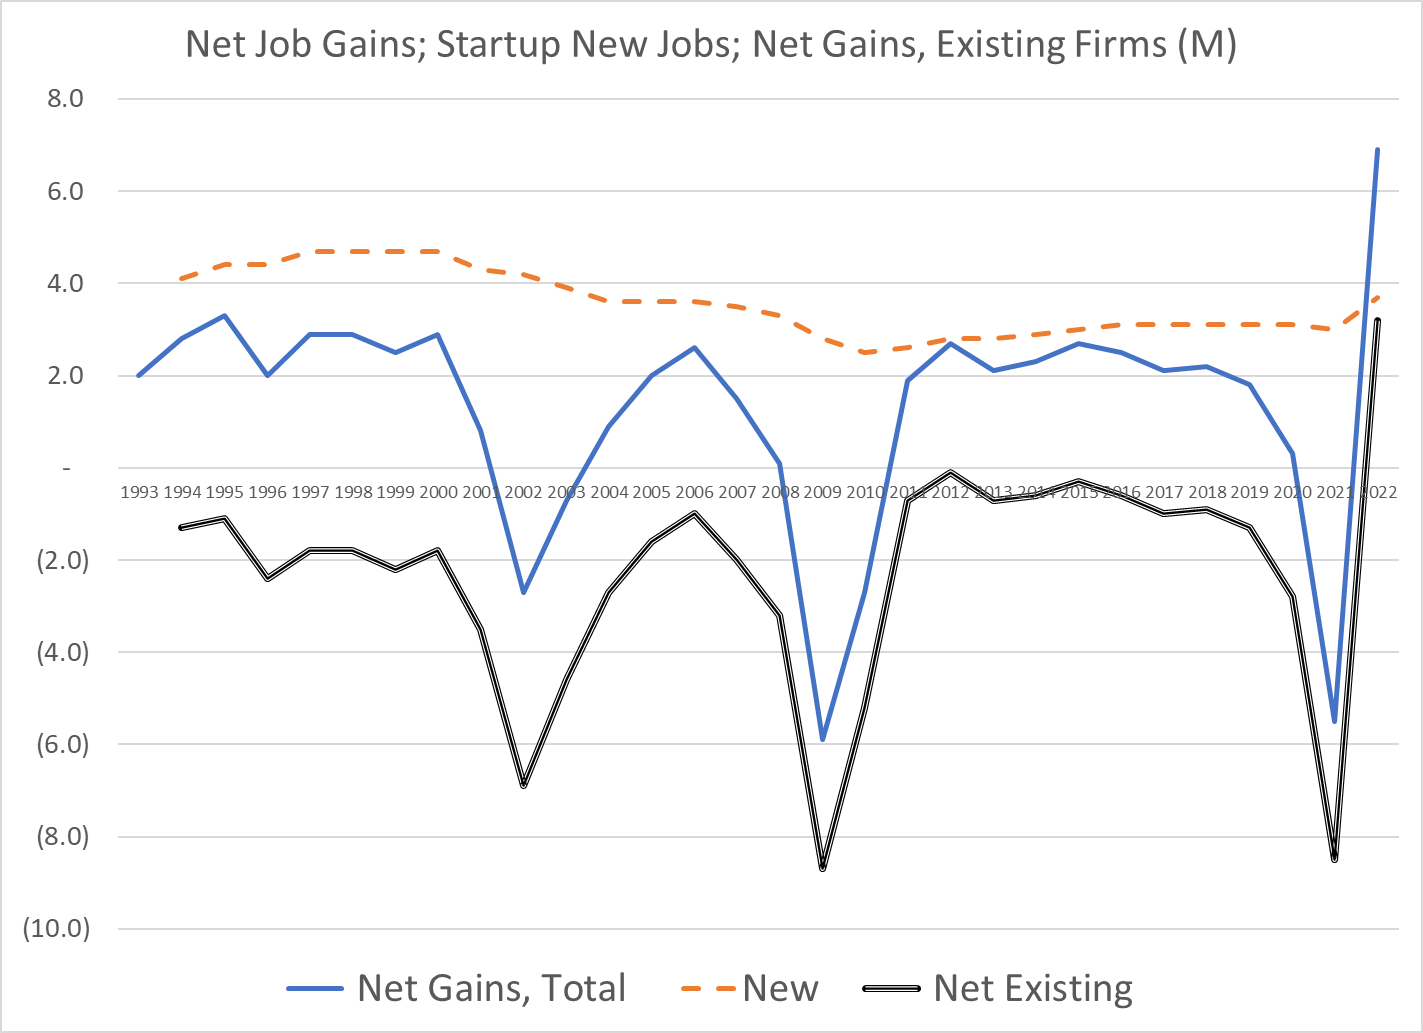
My summary of the last 30 years of data shows that startup firms do account for “all” new job growth. As others note, in a way this is almost “by definition”, because this is the only age group that only has “adds”, but no “losses”. It always must be positive. As we’ve seen in the details on job departures/hires, jobs created/lost, firms created/lost and establishments created/lost the positive and negative flows tend to be “roughly equal”. Hence, even a single year which is not burdened with an offset will stand out as the “big winner”. So, on the one hand we can discount the critical, essential, vital role of startup job creation, but we can’t ignore it. It is a necessary part of the life cycle of firms that delivers a growing economy.
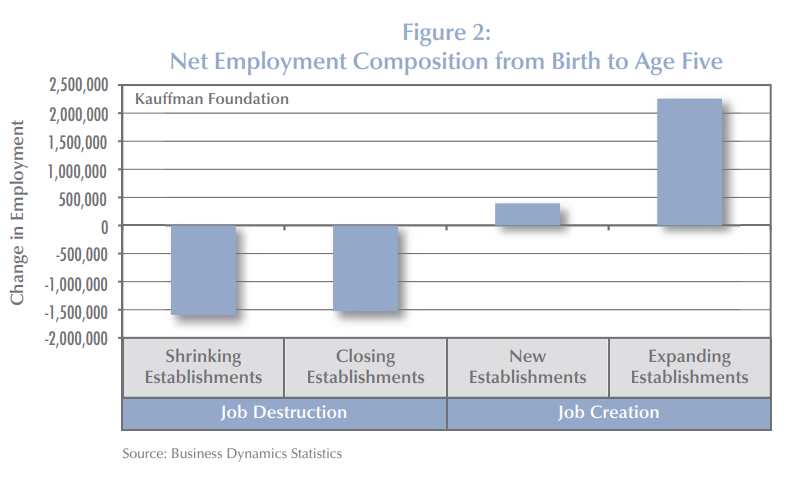
The 2010 Kauffman study combined the initial jobs created with the jobs lost in the next years to emphasize the vital role of startups, using 2007 data. Mature firms also made a small contribution to jobs added.
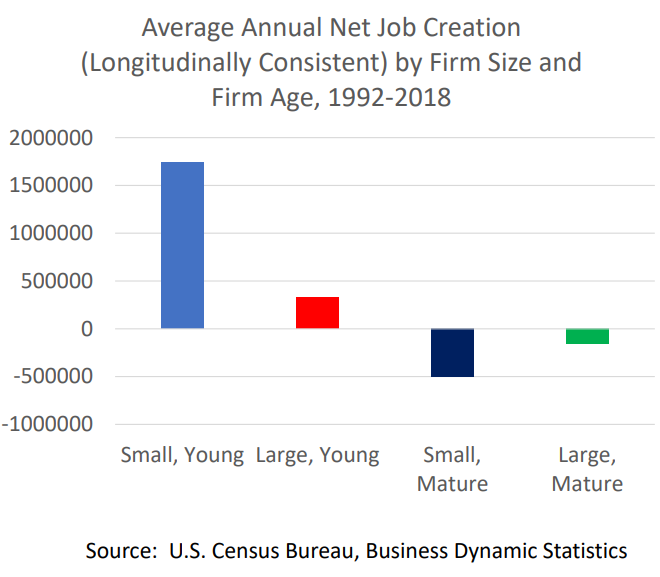
A follow-up report in 2011 by Dr. Haltiwanger summarized the data slightly differently but tells the same story. New firms, nearly all “small”, account for almost all job growth. Other small firms destroy jobs in their first 10 years at a high rate and as mature firms at a modestly high rate. Middle-aged firms lose jobs while successful firms grow to more than 500 employees and become large firms! Young large firms add a few net jobs. Old large firms lose a small percentage of jobs for this time period (1992-2005).
The central takeaway remains valid with more recent data across industries. The initial growth of jobs is not offset by the net losses in the next 5 years. Firms more than 6 years old do not add jobs overall.
I don’t know how to reconcile these competing claims but expect that the time periods chosen, and firm sizes chosen, are keys to understanding the significantly different claims.
In the early papers the Kauffman Foundation explains that it is new firms that drive new jobs. There is an overlap between new firms and small size that makes an analysis based on size alone appear to say that “small firms create most new jobs”; but the “newness” logically comes first. Existing small employment firms tend to shed jobs through firm death or internal job reduction.
A simple model focuses on just the first 5 years of a firm’s life after the initial startup year and defines four buckets of job growth and loss due to adding new establishments or experiencing deaths versus internal job growth (up or down) at the survivors. All four buckets matter. New establishments are infrequent for startup firms. Deaths are a major job killer. Job creating firms outweigh job losing firms. But the net gains from internal job growth is less than the drag from firm deaths.
Kauffman also created a complete theoretical model of job changes through time based on the key parameters and demonstrated that the model was a good match with the observed relative consistency of the parameters and the net output of jobs created. In a prior life, we called this the “layer cake” graph, using it to explain the composition of revenues or profits in a business based upon the year of customer contracts signed or new products introduced. At any point in time, there is a history of additions of various ages. Employment tends to decline over time based upon the combination of firm deaths, establishment gains/losses and internal job growth. Each year a new group of firms is added, all with job gains in the first year. This group too follows the pattern of job erosion in the first 5 years, smaller erosion in the next 5 years, close to break-even by age 20 and small net job creation for the mature surviving firms. Again, the parameters could be different, and the results would be different. But this framework provides economists and statisticians with the tools to analyze the components.
Another author created a dynamic model which illustrates how this process works through time.
The Small Business Administration promotes the view that small businesses (less than 500 employees) are essential to the US economy and create a majority of all jobs. As noted above, startups are the key. Size is a byproduct.
In my earlier post I discounted the importance of the decline in the share of new to total firmsbecause the corresponding decline in failure rates and improved job creation by mature firms was still delivering solid annual job creation. However, this warning signal is worth monitoring together with the other measures. The Brookings Institution provides some other “warning signals” about the health of the new firm/job creating capacity of the economy in light of reduced measurable competition in many industries (a topic for another day).
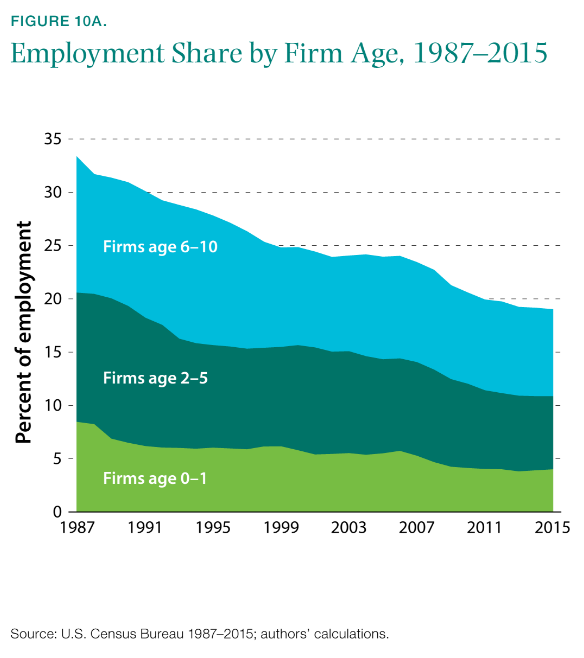
New firms account for a smaller share of total employment.
Business formation takes longer. Recent Kauffman reports shows that this trend has continued.
The entrepreneurship rate of college educated Americans has fallen most significantly.
One professor analyzed this and concluded that it was the result of American firms taking advantage of the low cost of capital and paying the higher salaries and incentives needed to attract and retain high potential employees. He says that job creation is happening more in existing firms and less in startups with no negative overall effect. He says that “marginal” (low return) entrepreneurs have been removed with little negative impact on the economy as a whole.
The slowdown in the new firm/job creation rate after the Great Recession attracted much attention from the media and politicians. Two representative articles are listed below, mostly bemoaning the decline of startups/small firms and the relative growth of large firms.
With the renewed emphasis on small firms and public policy to support them, others have responded by emphasizing the benefits of large firm growth and questioning the need to support/subsidize small firm growth.
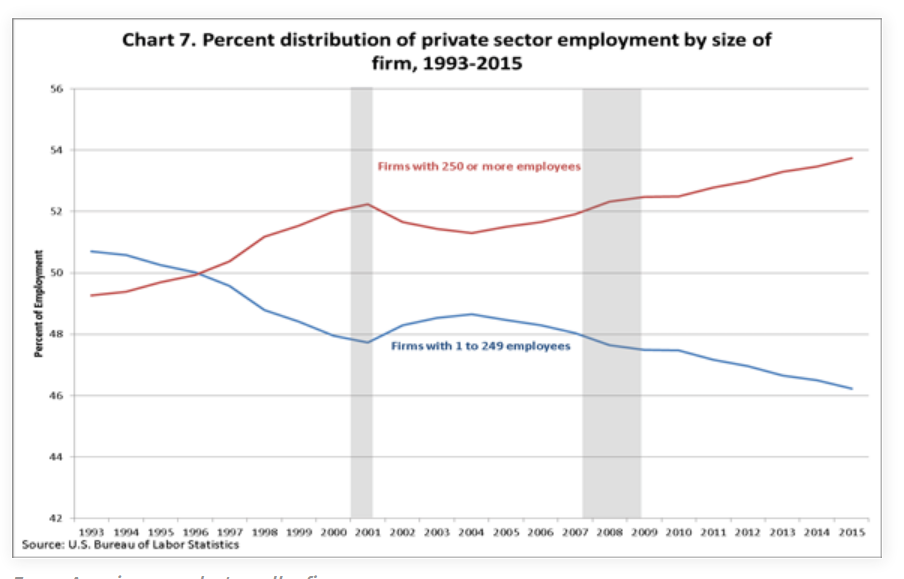
Using less than 250 employees to define “small business”, this article shows a 4% decline in small business share and 4% increase in large business share.
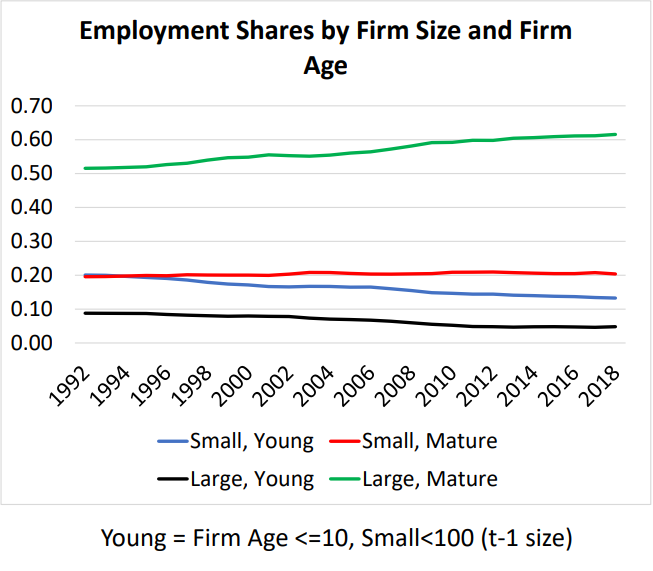
Professor Haltiwanger reports that large, mature firms have increased their share of total employees from 50% to 60% between 1992 and 2018. Both large and small young firms have lost offsetting market share.
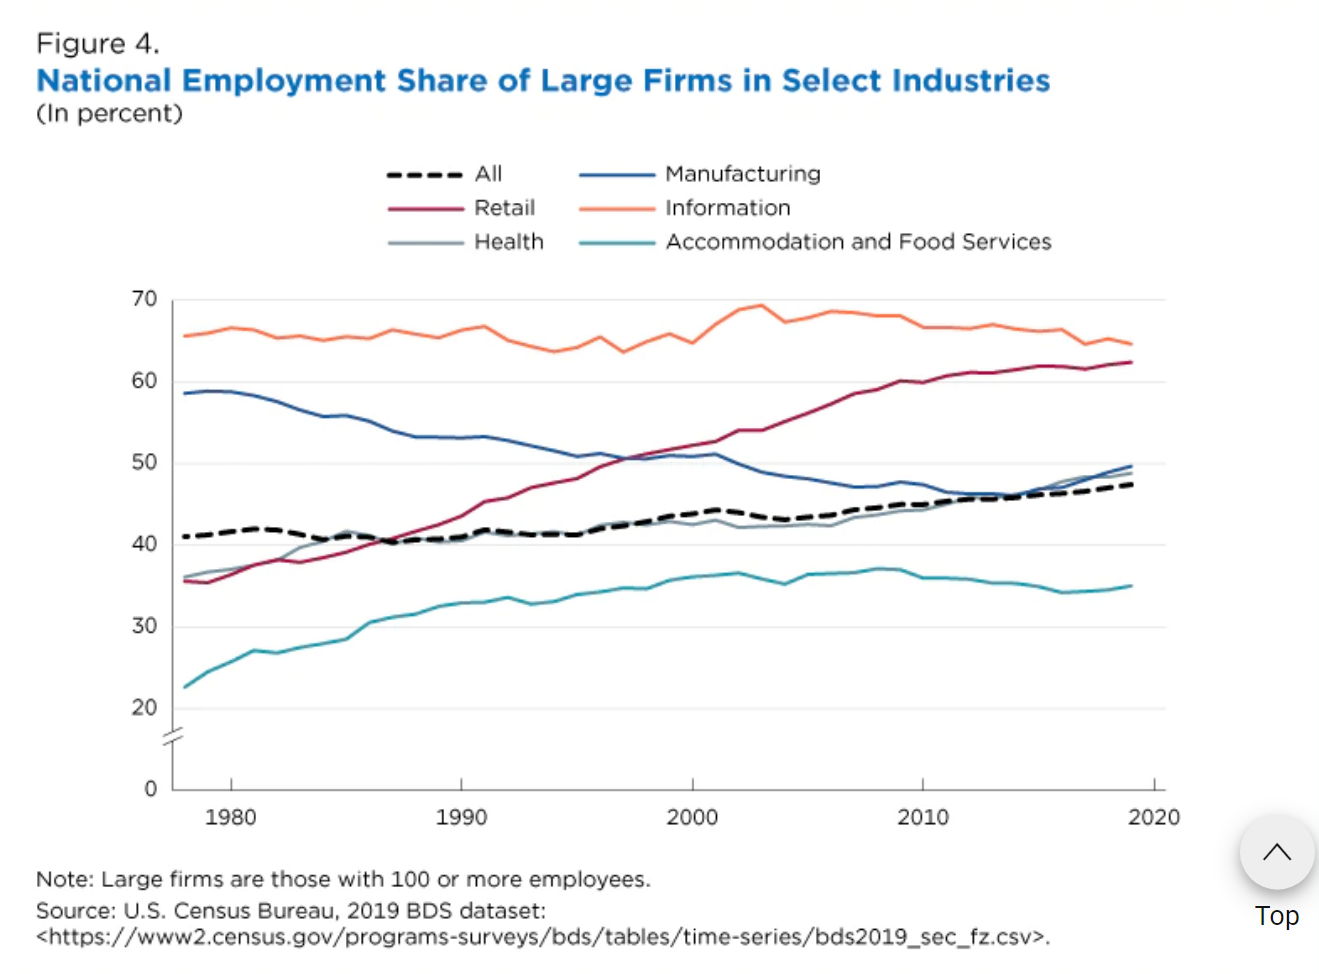
A recent Census Bureau article documents the increased employment share of older firms (6 years+) in many key industries.
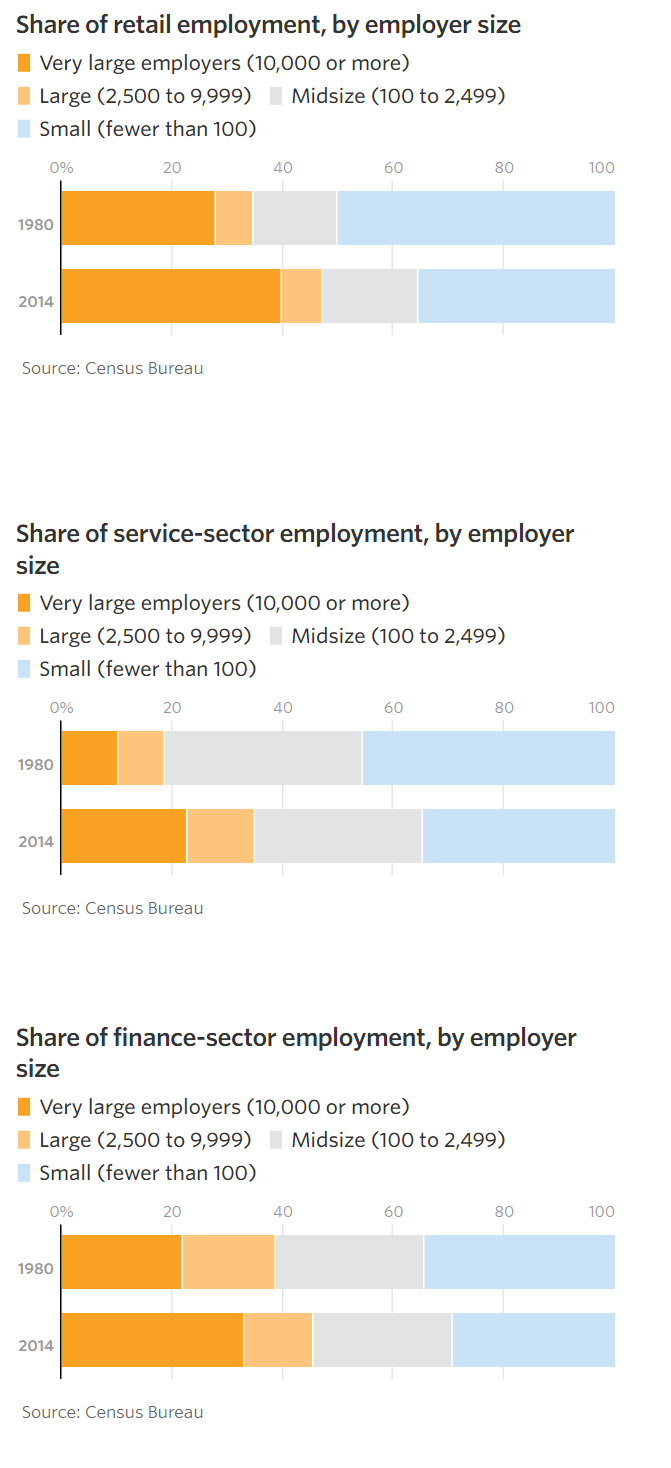
It also highlights the increased concentration of workers in large firms in the retail, health care, accommodation and food services sectors.
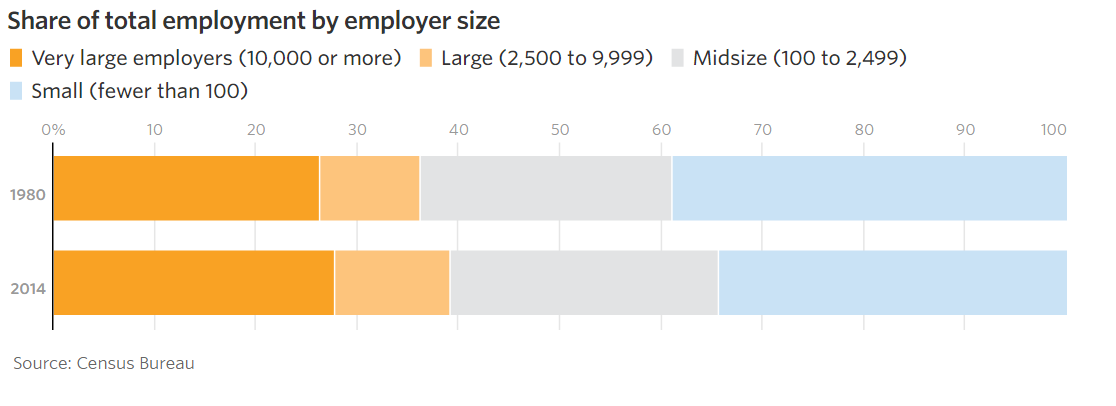
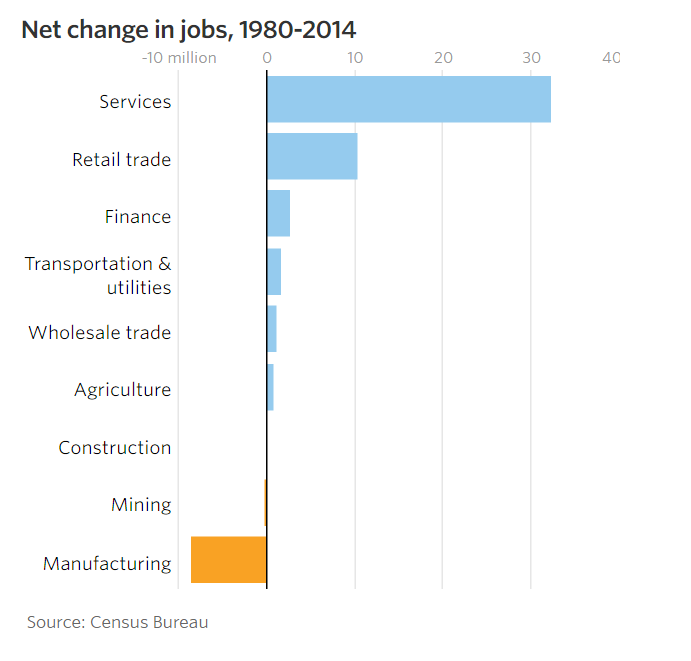
The WSJ articles itemizes the increased concentration of employment in large firms in the retail, services and finance sectors and documents that these are the growing segments of the economy.
Summary (It’s Complicated)
The Business Dynamics Statistics database provides researchers with the consistently defined and reported data since 1977 to document the key role of startup firms in adding net new jobs to the US economy. Startup firms are one part of an ecosystem of firm, establishment and job creation and destruction that plays out through time in relatively predictable ways. The death rates of young, middle age and mature firms play a similarly important role. The growth and decline of new establishments in existing firms matters. The internal job growth rates of young, middle age and mature firms matter. The relatively small size of startups compared to mature firms has an impact on job growth. Historical parameters are generally similar and change slowly, causing the layers of employment by firm age to be similar in this 50-year period. The model and framework for measuring firms, establishments and jobs is solid. Startup firms are essential, but they are not the only driver of success.
“Jobs created by firm size” is similarly shaped by all of these factors which describe the typical firm life cycle. Small firms are not superior job creators. New firms are job creators, and they happen to have small individual employment levels (4 on average), so small firms have higher measured rates of job creation.
In the last 10-20 years there has been a significant decline in the rate of new firm creation as a share of total firms. New firms created have not lost as many jobs due to firm deaths in their first 5-10 years. Mature firms continued to shed a disproportionate number of jobs during recessions, but after the Great Recession began to add more net jobs due to internal growth than they had in the prior 40 years. The overall number of jobs created has remained in the 2-4 million per year range across the 50 years.
The conservative SBA, Kauffman Foundation, WSJ and Republicans promote policies to ensure a thriving entrepreneurial environment for new and small businesses. The more liberal Brookings Institute, college professors and Democrats have an instinctive distrust of big business and concentrated economic power, so also lend support to some pro-small business policies. If job creation falters during periods of economic prosperity, this may be a rare place where bipartisan agreements could be reached to promote new firm and job creation.