Our current challenging social and political situation is driven by the root causes of individualism, skepticism secularism, inadequate myths, human nature and insecurity. In a word: negativity. Civility embraces constructiveness, intentionality and public-spiritedness as clearly “positive” values. It is also based upon the “positive” values of human dignity, respect and acceptance. Is it reasonable to be so positive in a time of negativity driven by politicians, the media and our fellow citizens? The answer is “yes”. We have chosen to emphasize our challenges rather than our accomplishments. Those who pursue Civility need to be aware of the reality of modern progress, conditions in all areas of life and realistic opportunities for change.
Overall Good News
Improvements in all areas of life since the 1976 bicentennial are amazing!
AI will take over the universe. At a minimum it will eliminate 10% of jobs, really important skilled jobs, leading to a downward spiral of joblessness and economic decline. The experts say so. AI has clearly shown exponential growth in performance. Do the math. It is unavoidable.
We have experienced so many “revolutions” that we can’t keep track of them. Electricity, railroads, telegraph, radio, tv, Marxism, existentialism, globalism, free trade, colonialism, skepticism, environmentalism, feminism, Freudianism, behavioralism, racial equality, women’s rights, gay rights, sexual experience, cold war, energy crises, terrorism, modern finance, lean six sigma, meritocracy, media, computer, communications, cell phone, biotechnology … Few have had material long-term impacts upon national or global economies.
Economies today are comprised of components. They are not just farming. They are not just basic manufacturing. Financial and real. Raw materials, component suppliers, manufacturers, logistics, wholesalers, retailers, installers, returns. Various industries. Various functions. Goods and services. Domestic and international. Importers and exporters. This complexity means that no one technological, process, regulation or other change is likely to have a HUGE impact.
Labor is only one input component. It combines with land/natural resources, capital/facilities, technologies/processes and financial resources to produce outputs. Total compensation is 54% of the US economy. Even the elimination of 10% of all jobs would only result in a 5.4% reduction in the total costs of production. In the short run, this would disrupt labor markets. In the medium-run, profits and rents would increase from the cost savings. The loss of incomes would reduce demand for goods and services, reducing profits, rents and compensation. Disruption, yes. Disaster, no.
The US economy today is less subject to the high fixed cost operating leverage that drives business cycle booms and busts. This reduces the frequency and depth of depressions. It improves the US economy’s ability to recover from exogenous shocks like an oil crisis, mortgage meltdown, pandemic or possible decrease in labor demand.
AI requires a human to initiate, fine-tune, launch and implement it. Only a small slice of the workforce can use AI tools. These individuals will be cautious when applying tools that threaten their personal employment.
Historically, “analysts” have employed newly available productivity improvement tools. There are only so many analysts with available time to evaluate and apply AI tools directly.
We have a history of analysts/STEM/creative class professionals adopting personal productivity tools. None of these situations resulted in significant/quick reduction in the demand for labor. They made these individuals more productive leading to the continued growth in these job categories for 40 years. Consider spreadsheets, query tools, report writers, database management software, ERP systems, statistics packages, CAD/CAM, engineering graphics workstations, desktop publishing, simulation software, project management software, warehouse management systems, EDI, internet search tools, forecasting software, shop floor modeling, activity-based costing, balanced scorecard, credit analysis tools, insurance underwriting tools, marketing research/survey tools, product development tools, logistics optimization tools, event planning and management tools, reverse logistics software, repair depot software, agriculture crop planning, the list is endless.
IT and process improvement projects are well structured today. These project teams will evaluate all dimensions of AI technology, considering direct and indirect costs, benefits, risks and off-ramps. They will act as a brake on the speed of adoption.
The jobs where “thinking” is the critical/90%+ requirement are few. Most jobs have thinking, feeling and doing dimensions. They employ local workers. Most “thinking” jobs combine inductive and deductive reasoning, multiple intelligences, hard and soft skills. AI focuses on the pure logical thinking dimension.
Many jobs require analog, travel and emotional physical interaction. AI cannot help.
Most corporate advances reply upon “matrix management” and project team skills. AI does not fit easily except as a tool for solving technical problems.
There are some research, logistics, analysis and customer service jobs that will be mostly replaced by AI. A human evaluator and quality control will remain.
Some scientific jobs will be quasi-automated, reducing employment.
The adoption rate across industries varies greatly. Manufacturing, distribution, logistics, electronics, IT yes. Others, much more slowly.
The “lump of labor” fallacy must be overcome. Individuals have a variety of employable skills. “Next skill up” applies. Individuals who lose positions find “next best” positions in America’s dynamic labor market. That is, job holders at all levels have packages of general purpose, professional, technical, industry and firm specific skills and experiences. AI tools reduce the opportunities to use some of their skills in some industries and firms. They still retain other marketable skills and experiences. A tight labor market will result in unemployment, some long-term unemployment, some avoidable long-term unemployment and a ripple effect that drops generally higher skilled candidates into previously lower paid roles. There will be a lowering of compensation throughout the labor market.
The “automation” of jobs in the physical, clerical and professional world has proceeded for almost 50 years. Employees have adapted effectively, adding skills or moving industries or locations.
Some positions rely upon “tribal knowledge” or individual/personal relations. They are buffered from AI.
At the macroeconomic level, the substitution of capital (AI computers) for labor is well understood. Firms reduce their costs and improve their competitive positions. They earn greater profits for a while. Slow to adapt firms die. Owners receive the profits. Owners consume more of the goods and services with a high marginal income elasticity. Personal services, professional services, travel, hospitality, leisure, tax, investment, security, charities, and construction grow. Total demand for goods and services remains the same or increases. The adoption of productivity increasing technology increases the supply side (capacity) of the economy. “Say’s law” ensures that in the long run that capacity will be used because the factor returns (rent, labor, profit) create new demand. In the short run we can have recessions and depressions. If we don’t use known fiscal and monetary policies to increase demand to use capacity we can stay in a recession, but we have 75 years of experience in dozens of modern economies to guide us.
This is not intended to diminish the potential role for AI. It will eliminate some jobs and complement others, making them more productive. It will solve problems faster than humans and hence open the door for new goods and services. It may reach superintelligence and seek to take over the world, but I’m not addressing that possibility.
Summary
AI is a tool that can replace some of our existing labor force. It may impact a significant share of the labor force in the next decade. Our economy is large, complex and dynamic. History indicates that some positions will be eliminated but many more will be boosted by the new man/machine capabilities that make them even more productive. There still appears to be no limit to the demands of individuals for goods and services, so it is very likely that this will improve the economy’s productive capacity and that we will consume all of this increased capacity, adding new goods and services to our menu of consumption.
I’m not saying that the labor market, goods and services markets or macroeconomic transitions will be smooth or pain free. Professional workers will have to find new “next best” roles that leverage other new or existing skills. Personal services industries are likely to grow while goods and resources industries decline. Fiscal and monetary policy makers will have to supplement aggregate demand without causing inflation or spooking bond buyers.
The modern advanced economy is truly a miracle. Without central planning or control, it produces the goods and services that are demanded. It adapts to changes in demand, technologies, suppliers, labor markets, resources, finances, regulations, etc. It will effectively adapt to the impact of AI on the demand for labor.
I encourage you to listen to the economics profession on this topic. It is not a new topic. It fits within existing conceptual models and measurements.
IT/AI leaders are not economists. They are subject to the same kinds of irrational thinking that economists have corrected for more than a century. Economic systems seem to be “too good to be true”. There are times when claims are exaggerated for political reasons. Economic systems are not perfect, but their overall functioning is well understood. In theory and in practice, our economies are very well positioned to digest the productivity improvements of AI for the benefit of total capacity and individual consumption.
Rose Colored Glasses; Man Bites Dog; If it Bleeds it Leads.
Politicians, journalists and influencers of all stripes emphasize the bad, the emotional and the unusual. This burdens us and our society. Allegedly, “it’s bad now, and it was MUCH better in the past”. This eternal NOSTALGIA is a big problem for our society today, leading many people to turn to populists, idealists, authoritarians and charlatans for salvation.
I will outline how much better the United States of America is TODAY than it was in the mid-1970’s. I graduated from high school with the class of 1974. I watched the emotionally mixed American bicentennial celebrations in 1976. I remember Jimmy Carter’s 1979 “malaise” speech in which he said that we, the people, needed to face our challenges directly, especially at a moral level. He was briefly cheered but then criticized for being too negative and pessimistic; an uninspiring leader!
Modern life in the USA is immeasurably better than it was in the 1970’s. It is certainly not perfect. The country has not achieved all that it could have or should have in the last half century. It still faces large global and moral challenges and wonders where it can possibly find the leadership, consensus and engagement to resolve them.
The sheer magnitude of changes in daily life across 50 years is difficult to describe but I hope that my outline will collectively communicate the great scale of improvements we have experienced and the resulting hope and expectation that the next 50 years will deliver the same kinds of positive growth. When we consider the last 50, 100 or 150 years of American life, we should be very optimistic.
Global Threats and Opportunities
The Cold War ended in 1989, relieving the pressure of 4 decades of imminent nuclear destruction. This was a miracle. No war. No revolution. No territories seized. No leaders executed. A quiet end to the threat. The US managed the threat of nuclear terrorism. West Germany embraced East Germany. The European Union welcomed new members. The global economy thrived.
The US established relations with China in 1979, beginning the country’s path to economic prosperity, trade and global influence. The growing trade between China and the world has acted to reduce the threat of conflicts while reducing the cost of goods for all.
The US welcomed the growth of Japan plus the “four tigers” of Hong Kong, Singapore, South Korea, Taiwan, as Asian nations embraced the “Western consensus” of mixed market capitalism, global trade and liberal democracy.
European nations also left behind histories of authoritarian governments or too much socialism to embrace the “Western consensus” and thicken ties through the European Union. Francis Fukuyama prematurely declared “the end of history” but the attractiveness of these successful choices was clear.
The US joined international efforts to reduce tariffs and increase trade leading to a doubling of imports and exports as a share of GDP.
The US adopted a less internationalist position after 9/11/2001, declaring a war on terror, defining the axis of evil, revoking treaty commitments, justifying preemptive war and invading Iraq without UN support. Even with this change, the US largely avoided major military conflicts and losses.
Total immigration to the US grew during this period from 2.3% to 2.9% of the population per decade. Many immigrant groups successfully joined American society.
The US welcomed foreign students to its universities. International tourists increased from 15 to 75 million per year.
The US attempted to resolve the Middle East conflicts with some success, avoiding large scale wars.
The US participated in talks to define and address the threat and impact of global warming. It has taken steps to reduce US carbon emissions.
Politics
Presidents Ford and Carter helped to rebuild confidence in the government after Vietnam and Watergate.
Ronald Reagan established “Conservatism” as a broad political philosophy for the Republican party.
Bill Clinton repositioned Democrats more to the center on economics with his “third way” approach.
Both parties increasingly used wedge issues and either/or choices to polarize parties and choices; although the share of independent voters has grown from 30 to 45%, with the rest evenly split between the two dominant parties.
Perot, Buchannon, Palin and Trump provided social and economic populists with a choice.
The country increasingly accepted racial minorities, women, gays, religious minorities, and immigrants; but the conflict between traditional and modern views was politicized as some could not tolerate the changes and others sought to embed the changes as universal human and legal rights accompanied by social pressures to comply with the dominant “tolerant” view.
Federal government employment was reduced from 5 to 4 million in 50 years, while the population grew by 50%. After Reagan, “government” solutions were inherently suspect. Even Bill Clinton declared “the era of big government” is over.
Total federal, state and local government activities grew a little faster than the economy, with the ratio of tax receipts to GDP inching up from 29% to 32%. The ongoing pressure to “cut spending, taxes and regulations” could not defeat the pressures to address social, political and economic issues and interests.
The top marginal income tax rate was reduced from 70% in 1982 and has remained just under 40% since 1987. Neither party has proposed widespread tax increases.
The Affordable Care Act was enacted in 2010, helping to bring the share of Americans without health insurance down from 20% in 1975 to 8% today.
The US safety net/welfare system has remained intact during this period driving the supplemental poverty rate down from 20% to 15%, while the official poverty rate has declined by just 1%. The share of the elderly (65+) in poverty has fallen from 16% to 8%.
The Economy
Real dollar GDP is 4 times larger at $24 trillion.
US real per capita GDP has remained the highest of all major countries for a century. Continued leadership reflects a dynamically successful economy.
Real per capita GDP has increased by 250% to $70,000.
US fiscal and monetary policy has repeatedly been effective in taming the business cycle and recovering from shocks like the housing crisis and the pandemic.
Industrial production, including energy, is up by 250%.
The number of business establishments has doubled to 8.6M, providing ownership and employment opportunities in a more specialized, globally traded world.
The number of franchise businesses has grown from 375,000 to 800,000+, employing more than 10 million people.
The rate of new business formation and success increased throughout the period, with a new boost after the pandemic.
Businesses responded to the 1970’s “Japanese invasion” and became strategically more focused, measured more effectively, focused on cost reduction, invested in R&D, and applied information technology and process improvement tools. Foreign and domestic competition led businesses to be more cost effective, improve product quality and offer products better tailored to diverse customer wants and needs.
Firms experimented with factory robots by 1975. They now use 380,000 robots, adding 10% more annually.
Auto production in the US has increased from 8 to 10 million units per year.
Farms produce twice as much using 20% less land and 40% less labor.
Businesses adapted to the world of greater international trade by growing or shrinking facilities, markets, products and product lines. They adapted to the new power of consumers and retailers and reduced power of manufacturers. They divested units and rejected the conglomerate model. They rejected vertical integration, learning to outsource all functions where they did not have a competitive advantage.
Firms embraced more effective banking, equity and bond markets to fund their activities. They tapped global sources and private equity. They learned by use financial leverage to increase net earnings and acquire other less dynamic competitors.
Firms changed organizational structures to have fewer layers, less positional power, more staff experts and the ability to use cross-functional (matrix) approaches to core operations, projects and joint ventures.
Education
Preschool/Kindergarten enrollment up from 5 to 9 million. Nearly all part-time in 1975 and mostly full-time in 2025.
High school graduation rate is up from 75% to 85%.
Intelligence test scores have increased by more than 10 points.
Share of young adults who have earned college degrees has doubled from 20% to 40%.
Share of adults with college degrees has more than tripled from 12% to 38%.
Share of young women with a college degree is up from 17% to 45%; shares for men up from 27% to 37%.
Share of degrees in STEM disciplines has grown from 11% to 19%.
Number of college students studying abroad is up by 5 times.
Law school first-year enrollment remains at 40,000, while the population has grown by 50%.
US holds 18 of top 30 global university spots.
The number of annually earned doctorates has doubled.
US accounts for 50% of Nobel prize winners, up from 40% in 1975.
Transportation
22% of new cars are electric. Self-driving cars are widely deployed.
Fuel milage has doubled from 13 to 27 miles per gallon.
New car defects have dropped by two-thirds.
Air travel miles are up by 5 times.
FedEx 2-pound overnight service was introduced in 1975 for $75. Service is widespread today at $55.
Same day and next day delivery services are available today, making Amazon.com, grocery and restaurant deliveries common. Catalog mail order lead times were 6-8 weeks in 1975.
Energy
The US faced energy crises in 1973 and 1979 that disrupted businesses, emptied filling stations and led to recessions.
The US imported 35% of its petroleum products in the 1970’s. It is a net exporter today.
Energy intensity, the ratio of energy used to GDP, has fallen by 60% since the 1970’s.
LED bulbs last 10 times longer. Lithium-ion batteries last 4 times longer.
Wind power is 10% of electricity generation. Solar is 10% of electricity generation. Solar is the lowest cost source today, accounting for two-thirds of new generating capacity added.
Coal production is the same today as in 1975, down 50% from its 2007 peak. It is declining rapidly.
Environment
Toxic air pollution measures are lower by 65-90%.
The world resolved the threat to the ozone layer.
Percentage of US homes in communities with treated wastewater has increased from 50% to 80%.
State parks acreage has doubled. Federal parks acreage has tripled. Land trust additions are equal to the state parks area.
Total US forest land area has increased from 750 to 800 million acres, while the US population has grown by 50%.
Nesting pairs of American bald eagles have grown 100-fold, from 700 to 70,000.
US (1976) and global (2014) birth rates are half of historical levels, reducing environmental demands.
US is on track to reach 50% reduction in greenhouse gas emissions by 2030.
Health
Life expectancy has increased from 73 to 78 years.
Infant mortality rate has dropped by two-thirds.
Smallpox has been eradicated. Polio remains eliminated. Other diseases close to zero.
Smoking rate is two-thirds lower, down from 37% to 12% of adults.
Death rates down: Strokes 67%. Cancer 25%. Flu/pneumonia 67%. Heart disease 50%+. Liver disease 25%.
US governments, medical industry, businesses and people responded to the Covid-19 pandemic resulting in a death rate that was half of the 1917 Spanish flu. Novel vaccine development and flexible delivery resources limited the death toll.
Abortion rates have fallen by 50% since 1980.
Medical research continues to develop new science and solutions. Cloning and human genome mapping.
In vitro fertilization births have grown from 0 to 100,000 per year.
Modern anti-depression drugs (SSRI-Prozac) are much safer and more effective than their predecessors.
Kidney dialysis extends lives for 550,000 today versus 25,000 in 1975.
Americans have 40 million MRI scans done on 13,000 machines, up from zero.
Laser eyer surgery has grown from an experimental procedure to 800,000 annually.
50,000 organs are transplanted each year, up from just a few experiments.
Safety
Property crime rate is down by more than 50%. Violent crime rate is one-third lower.
Both the workplace fatality and injury rates are down by two-thirds.
Traffic fatalities per driven mile are three-fourths lower.
Fire incidents have been cut in half while the population grew by half.
Emergency medical services have grown from 2% to 90% of counties; employing 300,000 people, 50,000 ambulances and 1,300 helicopters.
Consumer
Firms have offered consumers much wider options for products in all industries. A typical Walmart Supercenter has 125,000 different SKU’s.
We enjoy year-round availability of most fruits and vegetables today rather than shopping by season.
Clothing and durable goods prices have been cut by half.
The average automobile is 13 years old versus 6, reflecting massive quality improvements.
Car buyers can choose from 15 major manufacturers instead of just 4.
Appliances in more homes: Washing machines (70-85%), dryers (45-82%), dish washers (28-54%), microwave ovens (4-95%). Refrigerators are 25% larger, half price and 75% more energy efficient.
Median new home square footage has increased by half, from 1,500 to 2,200 square feet.
Mortgage loan rates have declined from 8-14% to 4-7%. Real rates are just 2% today.
Total debt service payments (home, car, credit card, student loan) as a percentage of disposable income have declined from 11% to 10%.
Air-conditioned homes have grown from a hot 55% to a cool 95%.
Away from home food spending has more than doubled from 28% to 59% of total food spending.
Household consumption is up from 87% to 92% of disposable income. Savings is down from 13% to 8%.
Leisure
Many television program options. Top 4 network share down from 90% to 30%. Recording and streaming options exist today.
Cable or satellite TV access has grown from 14% to 100%.
The number of feature films released each year has bloomed from 100 to 700.
Music singles are effectively free today. They cost $7.50 each in current dollars in 1975. The transistor radio has been replaced with portable, wearable devices served by playlists, suggestions and feeds.
Real consumer electronics prices have declined by 80-95%. A 21-25 inch color console was $2-3,000 in 1975 in current dollars. A 50-inch tv is available for $500 today.
A 1982 IBM PC cost $10,000 in current dollars. For $2-3,000 today you get 1,000 times the processor speed, 10,000 times the memory and 100,000 times the storage space.
Video rentals boomed in the 1980’s and 1990’s growing into a digital $100 billion industry.
The $5 billion pinball machine sector evolved into the $50 billion handheld and online gaming industry.
Virtual reality equipment is increasingly popular.
Passports are held by half of US citizens, up from 5% in 1975.
Following deregulation, the real price of air travel per mile has glided down by 40-60%.
Hotel room capacity has doubled from 2.4 to 5.3 million.
Pet food consumption has tripled.
American wine production has increased from 250 to 700 million gallons, along with quality.
American brewery count has increased from 150 to 7,000, along with quality.
Wealth
Mutual funds, index funds and 401K’s offer investing to everyone. Percentage of stockholders has grown from 12% to 60%.
The number of retirement plan participants has grown by 250%.
Real dollar retirement plan assets have grown thirty-fold, from $1.6 to $48 trillion.
Homeownership rate increased from 64% to peak of 69% before falling back to 66%.
Family wealth more than doubled for those in the 1st-25th, 26th-50th, and 51st-90th percentiles between 1989 and 2022. Summary data for 1975 to 1989 is not readily available. Real home prices increased by 20% and the real dollar S&P 500 increased by 75% during this period, overall.
Labor
Compounded labor productivity has increased by 150%, more than 2% per year!
Manufacturing, administrative and farm jobs were reduced by 20% of the total during these 50 years. They were replaced by STEM/analysis, management and health care jobs.
Prime age labor force participation increased from 74% to 84%.
Typical unemployment rate declined from 6.5% to 5%.
Share of self-employed workers increased from 9% to 11%.
According to the Gallup Organization, the share of “engaged” workers has increased greatly in the last 20 years.
Real median family income increased by 40% from 1984 to 2024.
There are dozens of expert calculations of real incomes, adjusted for taxes, government benefits, charity, fringe benefits, hours, etc. Most show that 1975-1990 was flat and that 2000-20 showed modest increases.
Society
The US continues to lead the world in charitable giving as a percentage of income, double the nearest country, Canada.
US migration and population growth in the “Sunbelt” impacted local and national economies, politics and society. Texas (13-31M), California (21-39M) and Florida (8-23M) showed the greatest growth and national influence.
Share of adults cohabiting has increased from 1% to 13%.
Teen pregnancy rate has been cut in half.
The share of married couples has declined from 83% to 67% of households.
Parents now invest 20 hours per week caring for children, up from 12 hours in 1975.
Same sex marriage was legalized by the US Supreme Court in 2015.
Female labor force participation rate has increased from 46% to 57%.
The female to male wage discount has been reduced from 35% to 10%.
The number of congresswomen increased from 19 to 155 (7X).
Women today have access to credit and credit cards in their own names.
Black unemployment declined from 15% to 7%, with the excess above whites falling from 7% to 2%.
Black poverty rate has declined from 30% to 18%.
The Black to White income ratio has improved from 60% to 67%.
The share of interracial marriages has increased from less than 1% to 10%.
Percentage of Americans moving per year has declined from 20% to 12%. Interstate moves have declined from 3% to 2%.
Robert Putnam’s “Bowling Alone” shows a 40% decrease in social participation during this time.
Awareness, tolerance and support for “differences” is higher by an order of magnitude: races, nationality, immigration status, physical or mental disability, gender identity, mental health, autism, obesity, and personality.
Hispanic Americans have increased from 6% to 20% of the population.
The percentage of non-Christians, including religiously unaffiliated, has increased from 12% to 35% of the population.
The share of 40-year-olds never married has increased from 6% to 25%.
Computers
Personal computer software and phone apps provide tools for email, calendars, word processing and spreadsheets to everyone today.
Personal computers are in 95% of homes versus 0% in 1975.
More than 90% of jobs today require computer skills.
Home internet access is 92%.
Digital cameras, music, videos, sound and storage make everything portable.
Voice controlled devices and instant language translation.
Today’s 10-day weather forecasts are as reliable as next day forecasts in 1975.
Google search and artificial intelligence provide access to all of man’s writings and promise thought, itself.
Communications
Internet structure and web browser provide access to everything and everyone.
Smartphones integrate computing and communications. 90% ownership rate. Provides photo, filming and navigating capabilities.
Mobile/cellular phone networks and wifi routers offer universal access to the internet and phones.
Social media networks combine the input of many to build and use networks.
Internet allows for open-source software and information creation.
Video conferencing and internet enabled phone/video calls are common.
Voice mail, answering machines, caller ID and 911 were invented.
Digital books have grown to 25% market share.
Annual first class mail per person increased from 240 to a peak of 360 in 2000 before falling to 130 today.
Daily newspaper subscriptions have plunged from 60 to 20 million.
Share of homes with landlines has fallen from 90% to 30%.
A 3-minute long distance call in 1975 cost $8.70 in current dollars. An international Skye call today is 77 cents.
Summary
The world is a better, richer and safer place. Politics has evolved. The economy is 4 times larger. Businesses and education are more effective. Energy is cheaper. Transportation is better. The environment is much better. Health is much better. Safety is much better. The consumer is king. Leisure options and quality can’t even be compared with 1975. Wealth is up. Incomes are up. Society is digesting many large changes. The computer and communications revolutions have delivered miracles and promise more.
We face social, political and environmental challenges. We have more resources than ever before. Based on American history we should be very confident about solving our challenges.
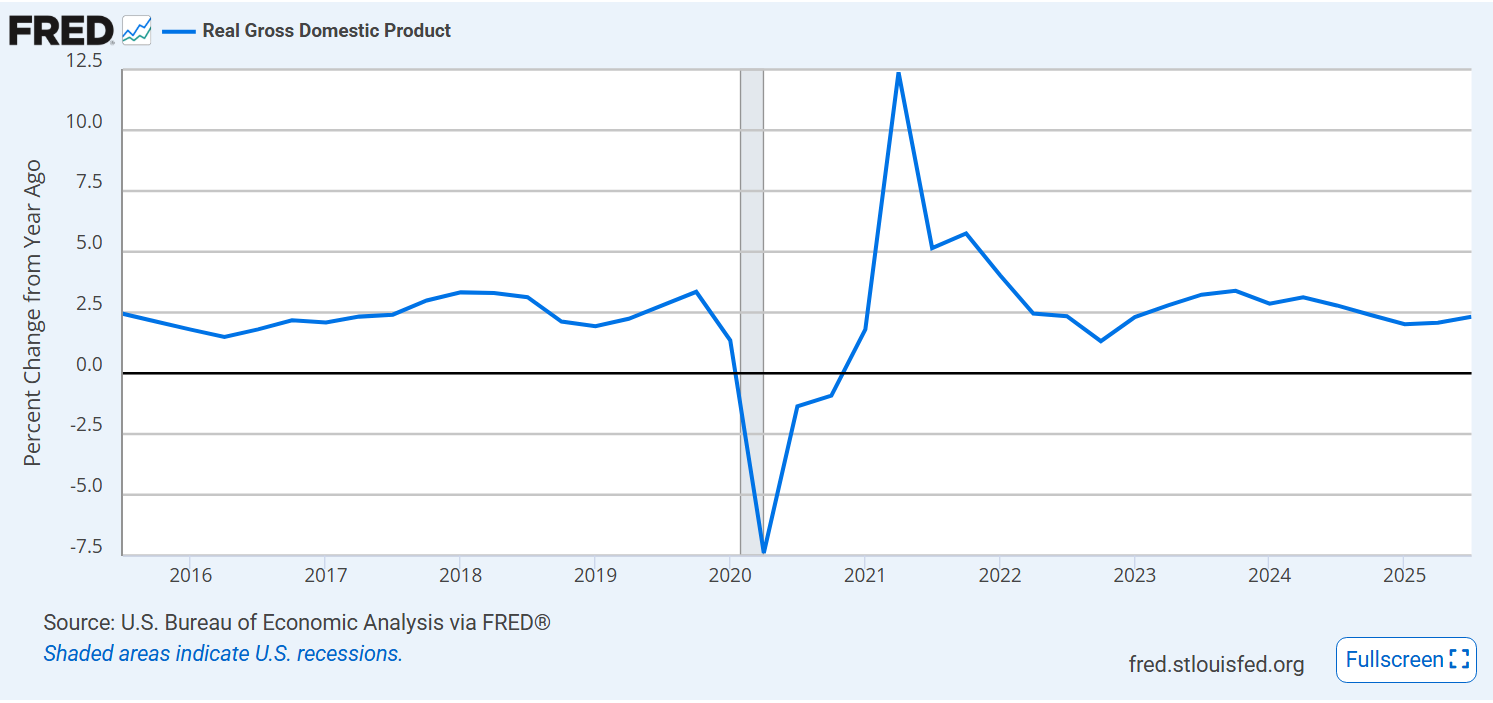
Overall, at the same core 2.5% growth rate seen for the last decade.
Labor productivity growth down a bit from the pandemic recovery bump.
Median wage growth remains at 2%, down a bit from pre-pandemic 2.5%.
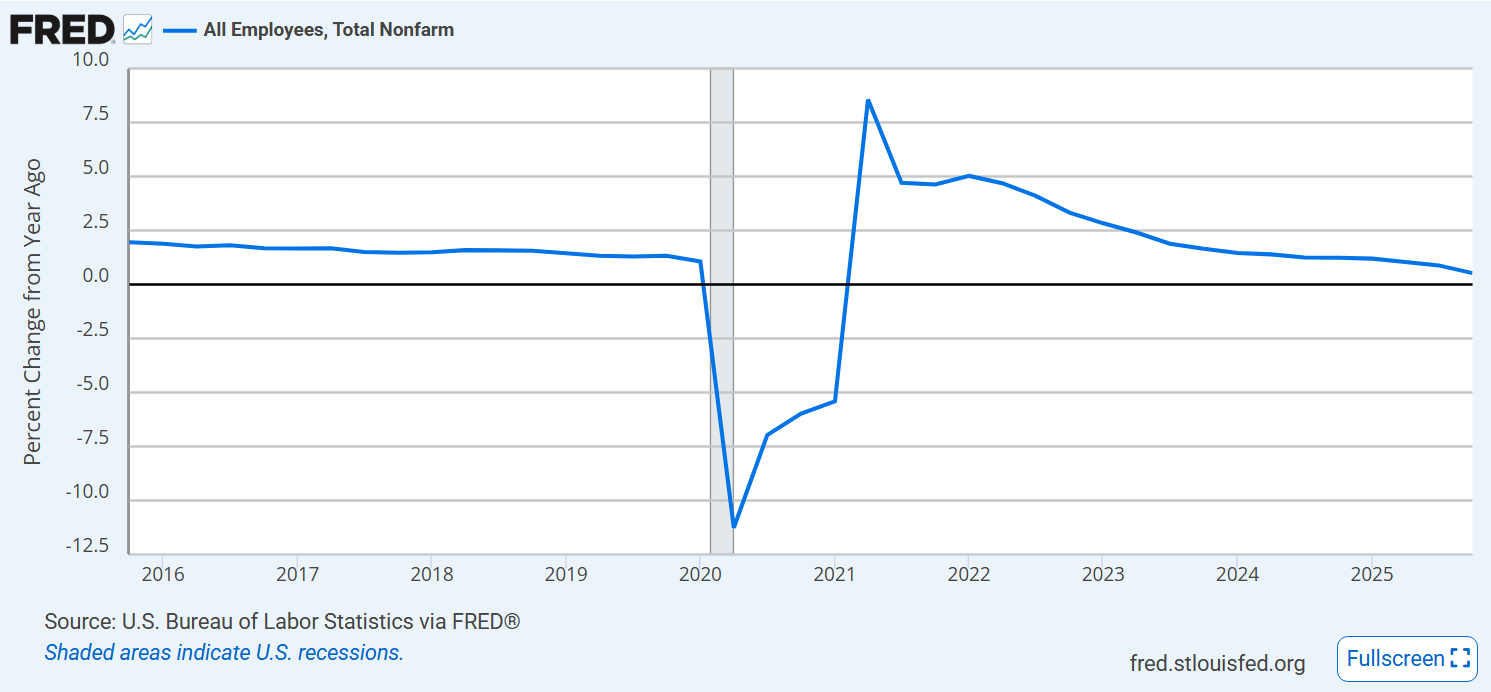
Job growth is very weak. Typically, this indicates a coming recession, but the reduction of the immigration labor supply makes historical comparisons difficult.
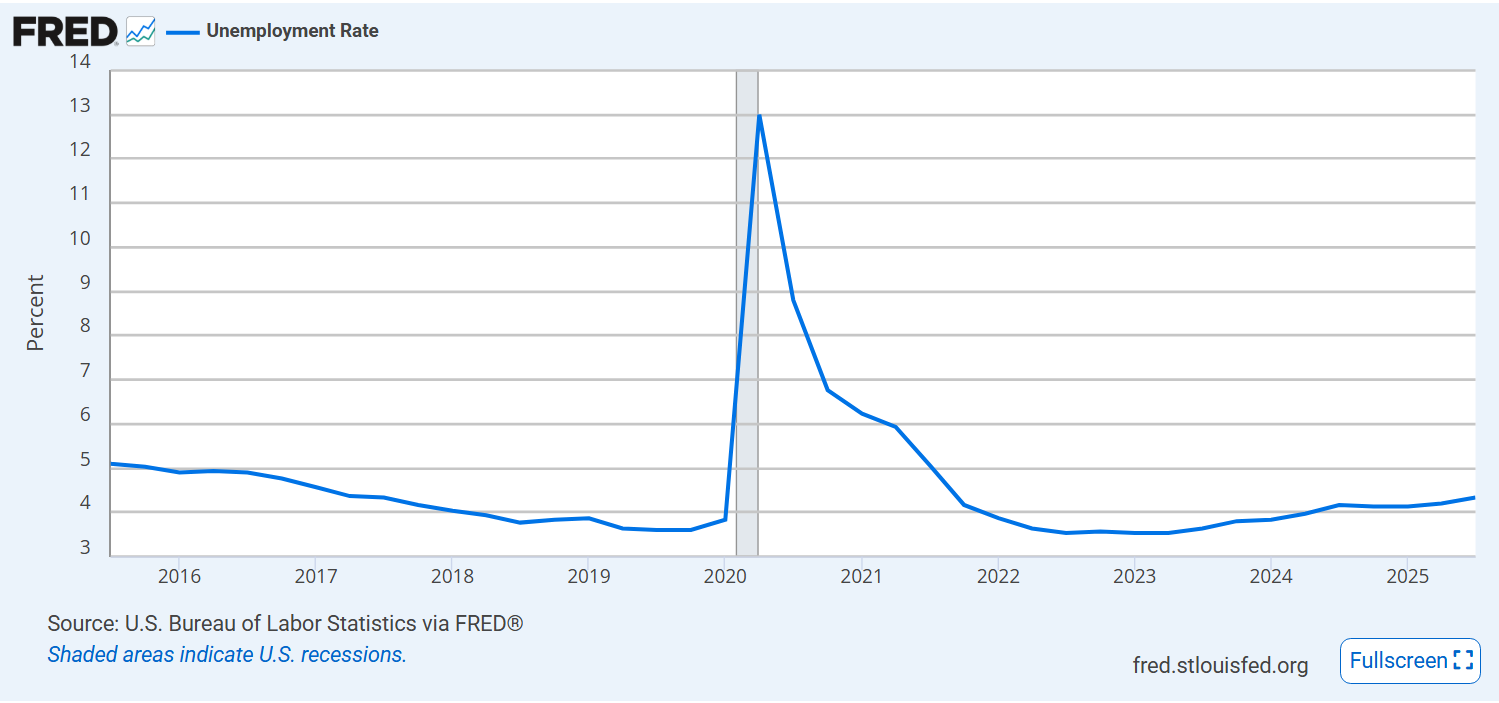
Unemployment rate remains at historically low 4.5% but it has been increasing for more than 2 years.
The “underemployed” rate shows the same relative level and trend.
Labor force participation hit record levels after the pandemic and has remained there.
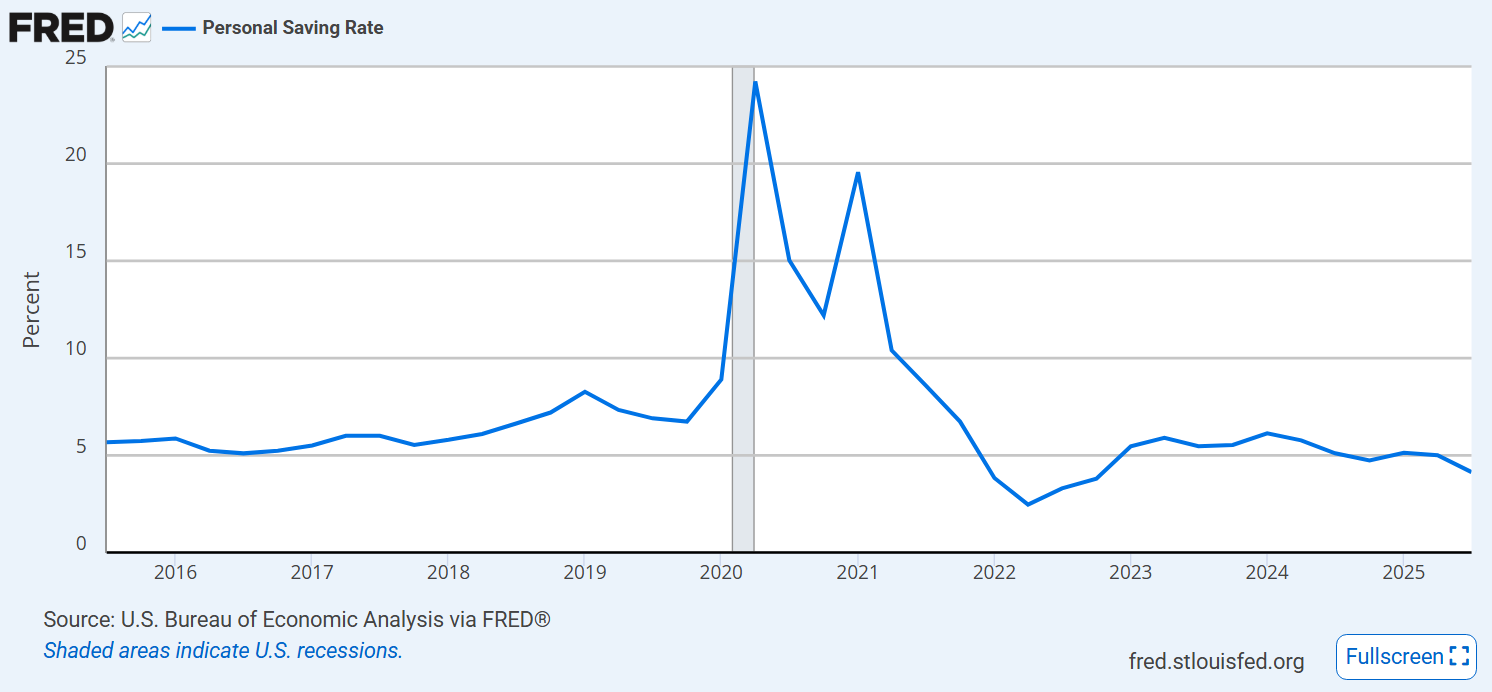
The personal savings rate is low, a bit below the pandemic and trending slightly downward.
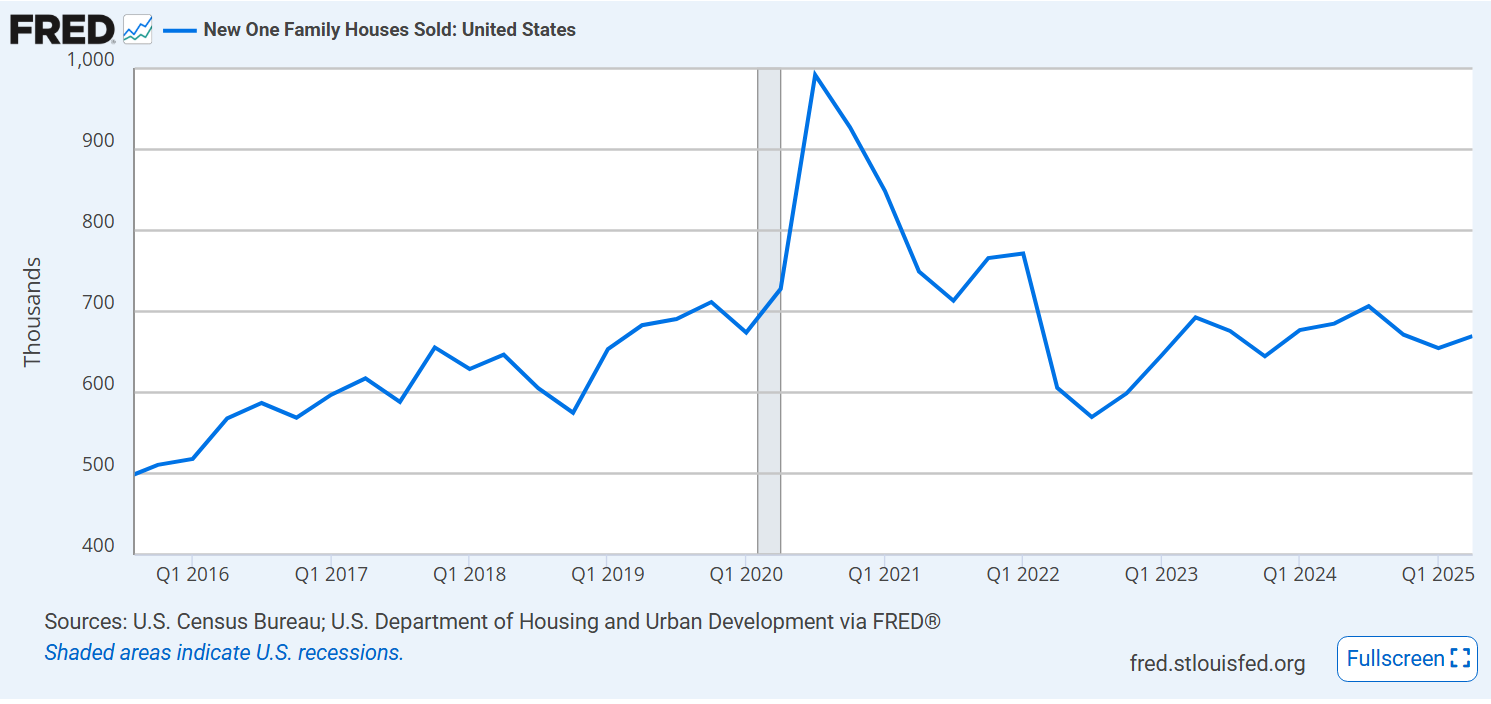
Mortgage rates remain elevated, around 6.5%.
New home sales are pretty stable, at pre-pandemic level.
Housing prices jumped from $320,000 to $440,000 after the pandemic. They have fallen back by 5% in 4 years.
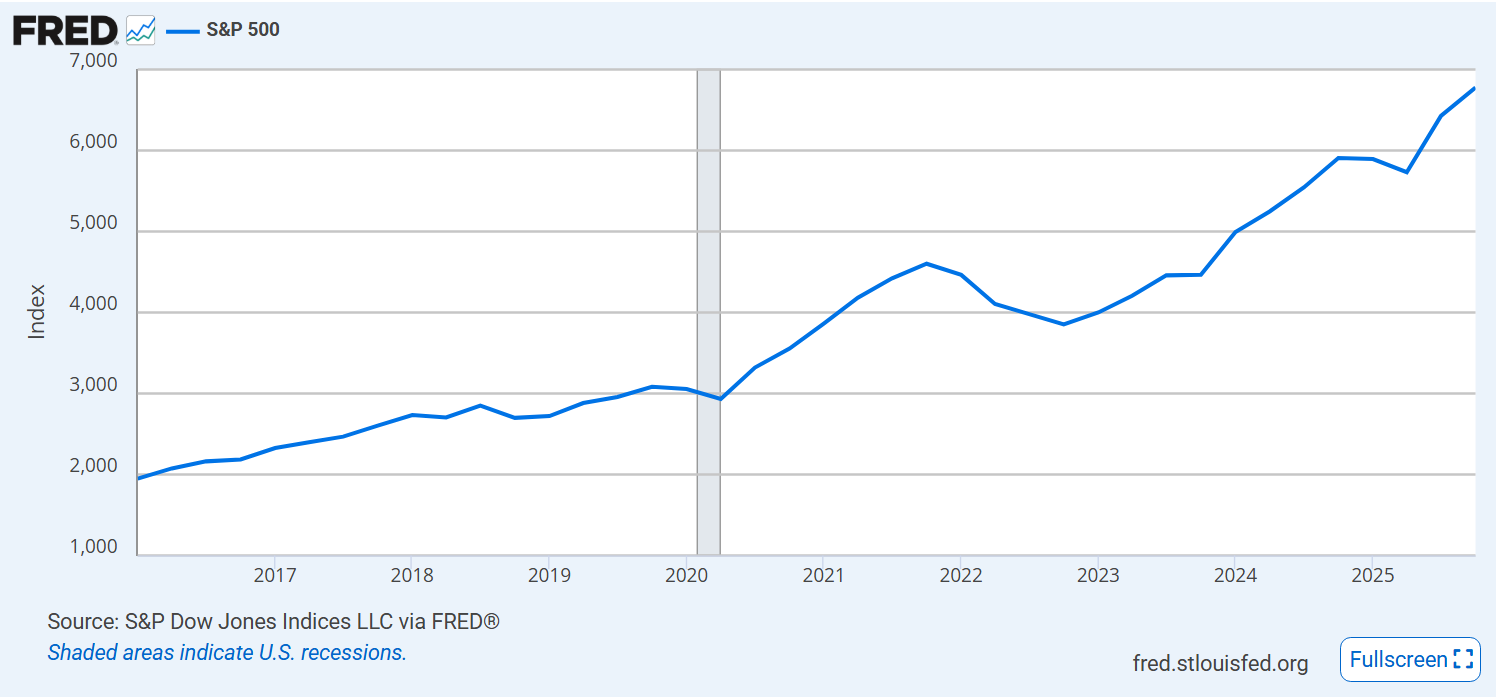
The US stock market continues to climb.
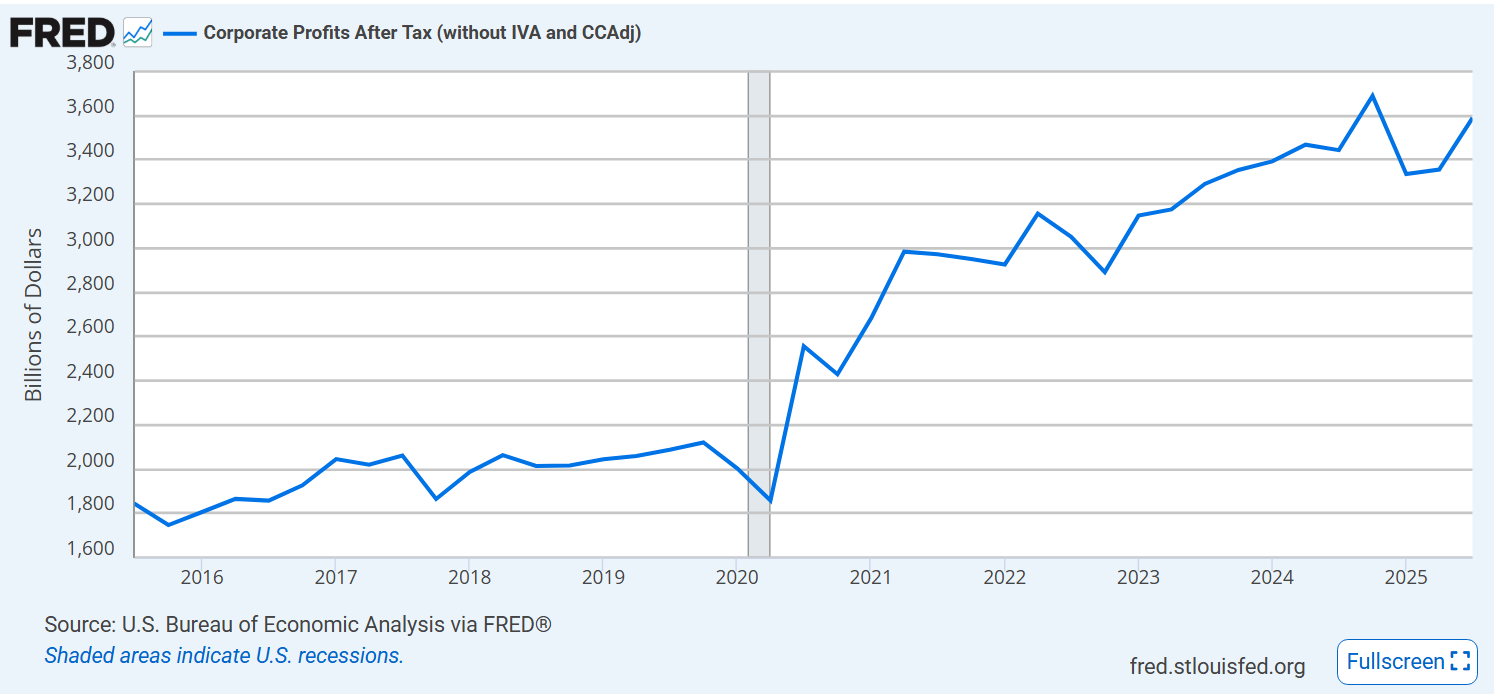
Corporate profits have roughly doubled since before the pandemic.
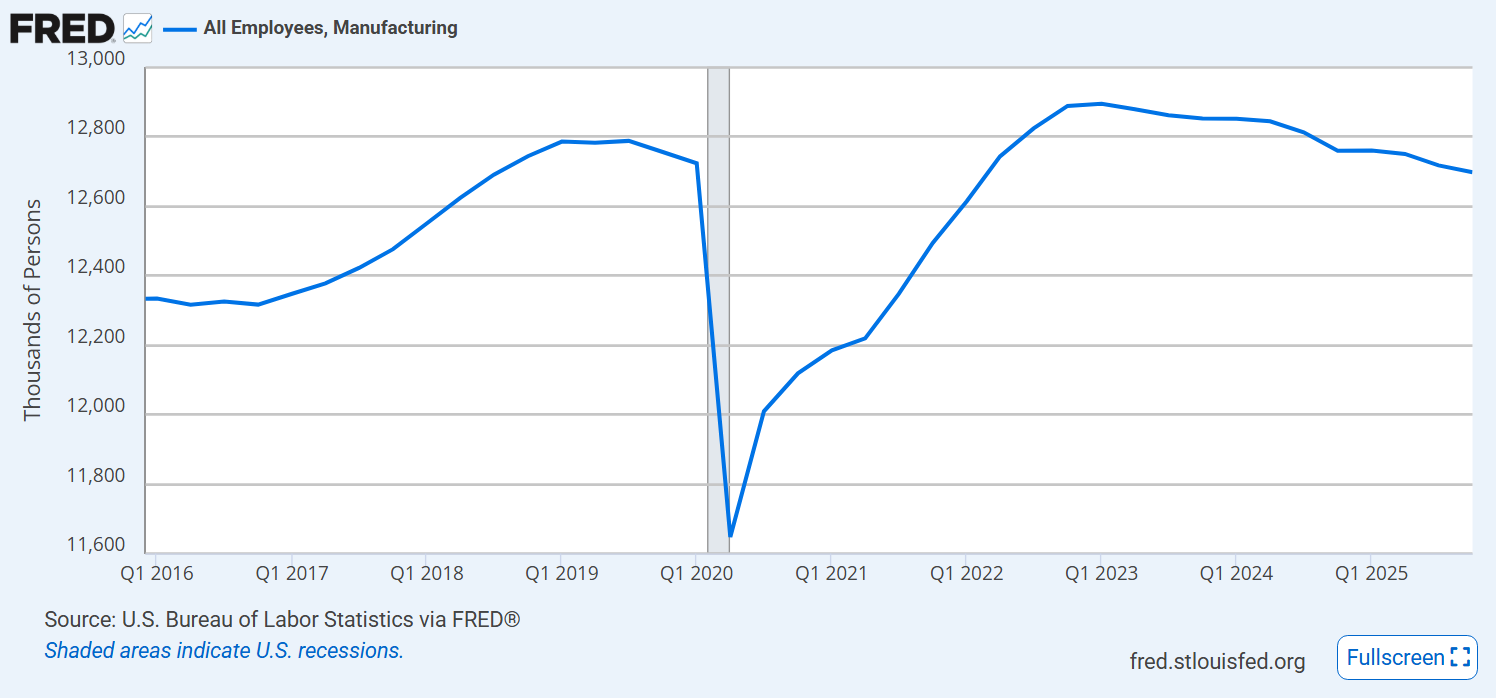
Manufacturing employment continues to decline.
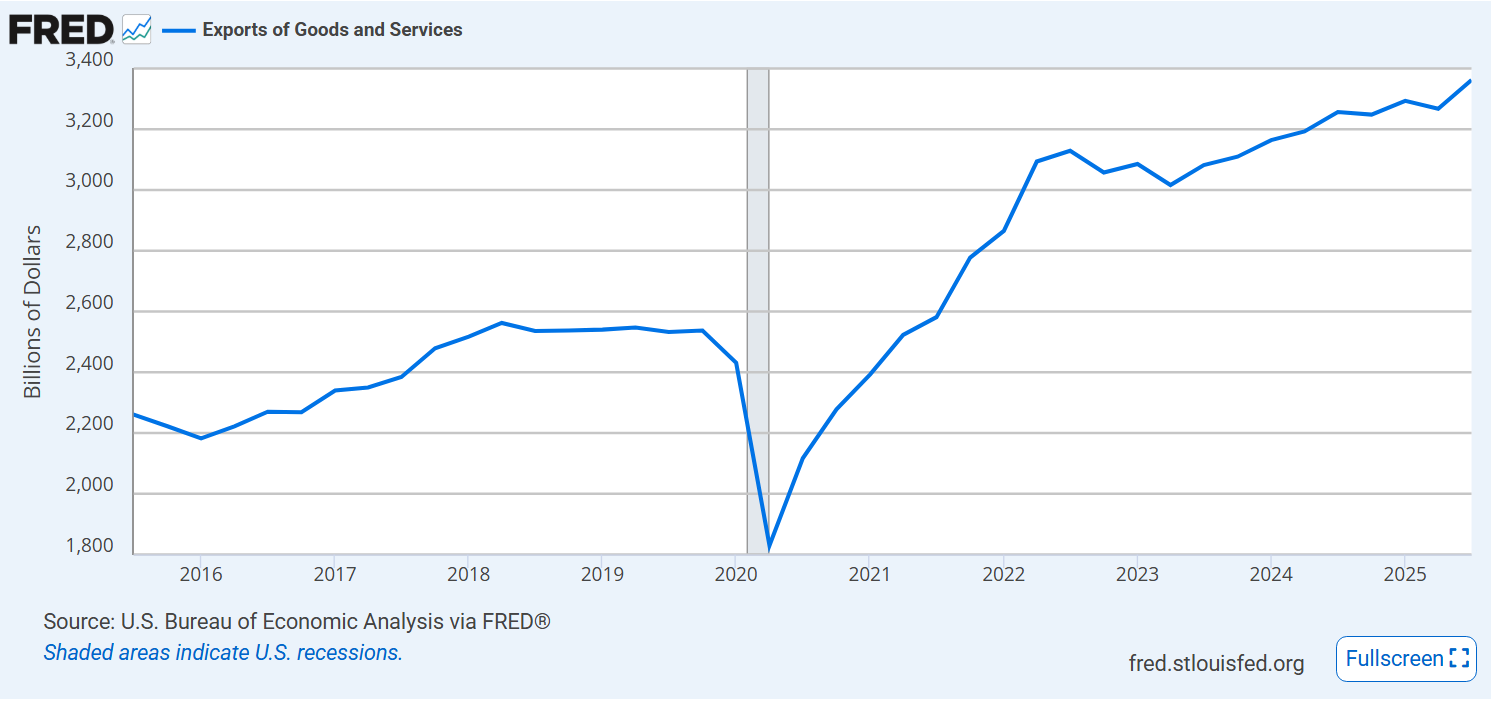
Exports are up 50% and still growing slowly.
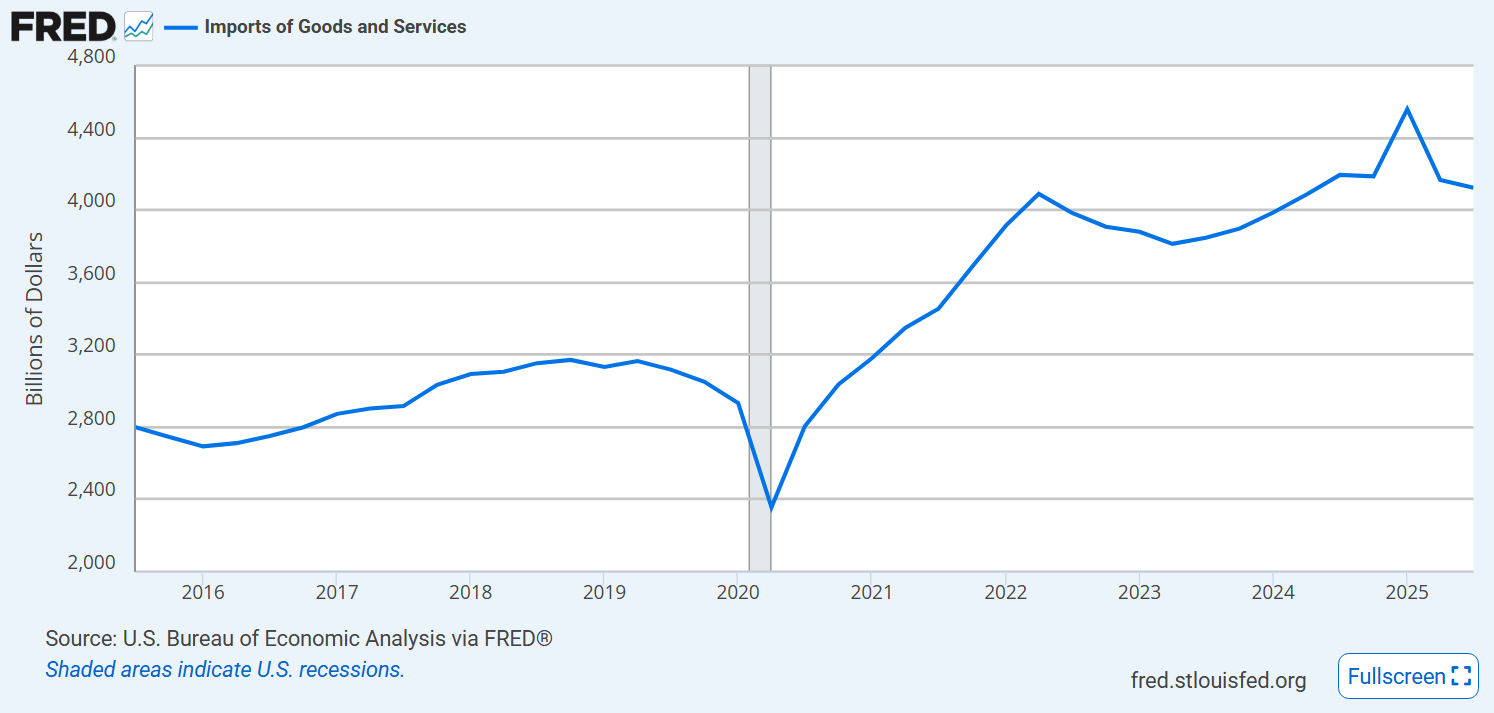
Imports also increased by 50%.
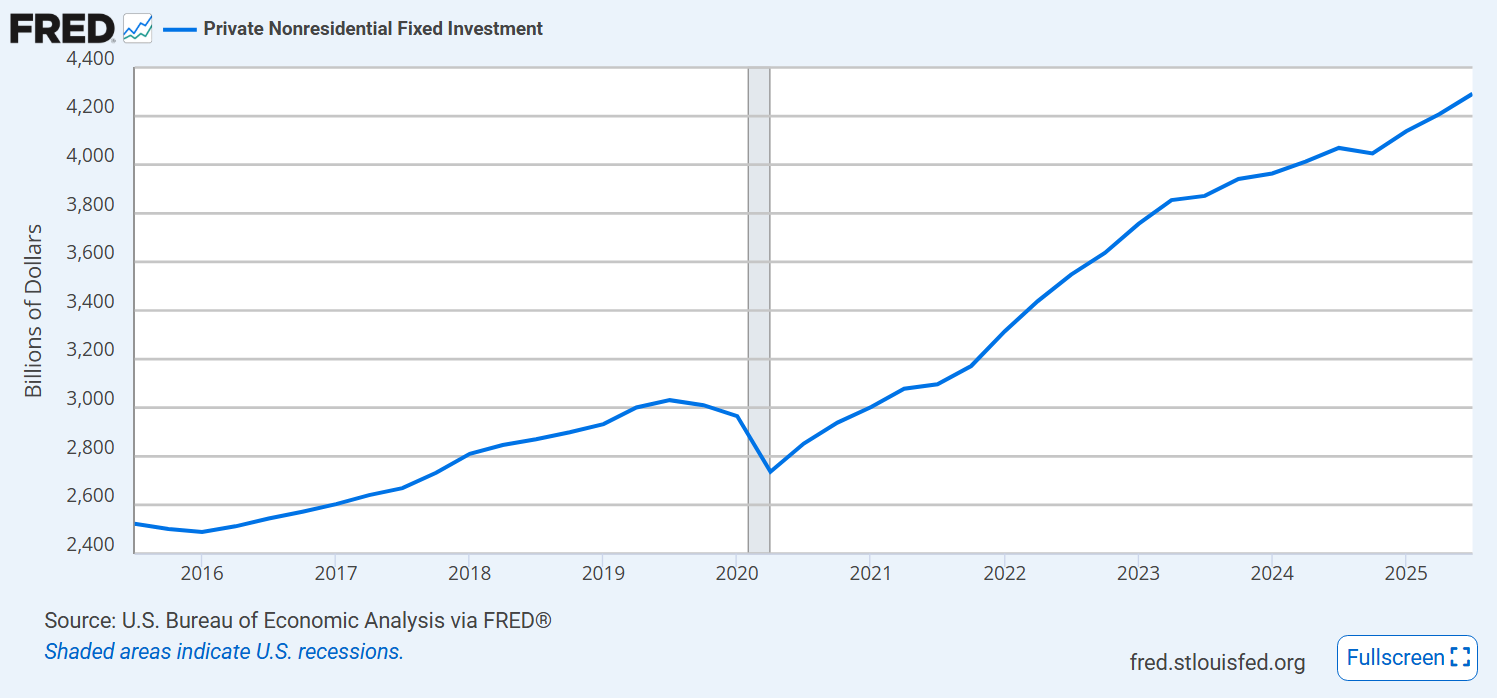
Businesses continue to invest.
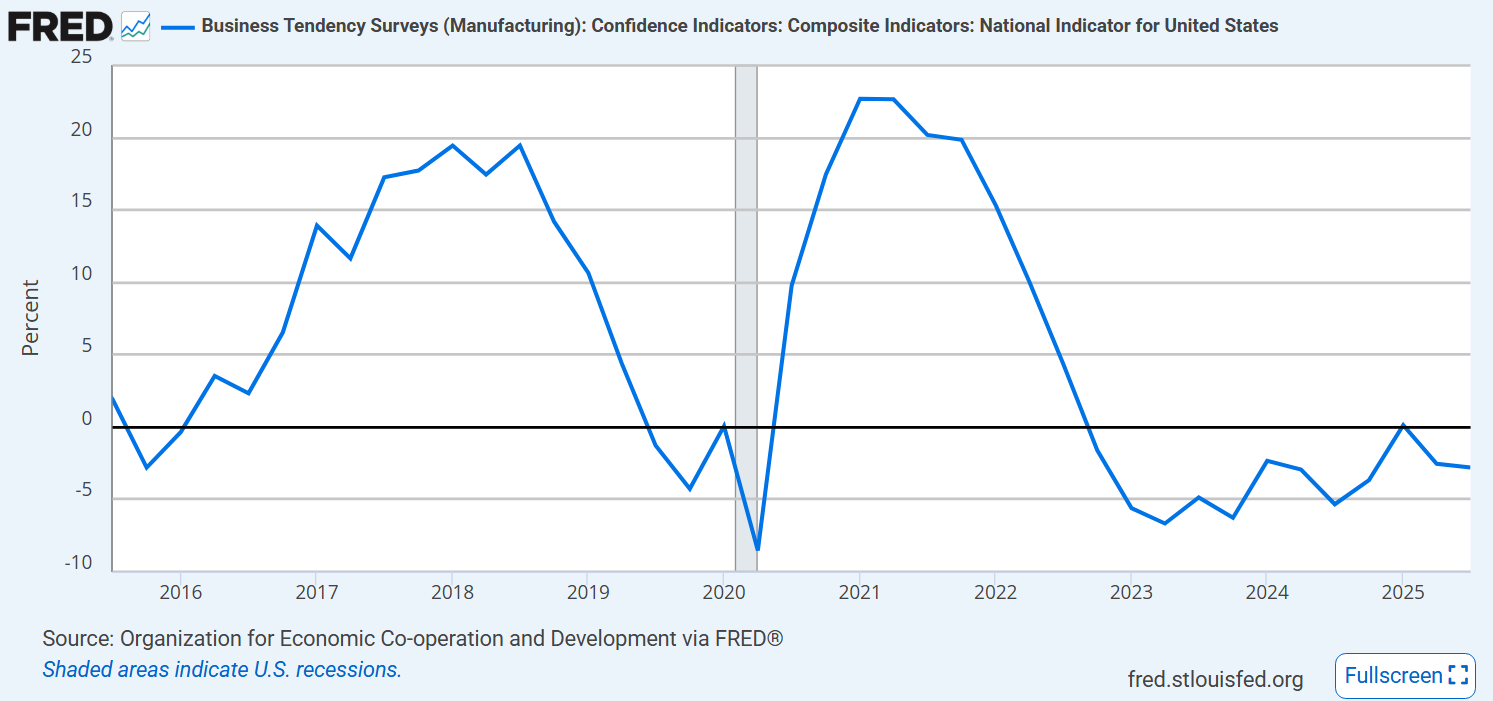
Business confidence remains weak.
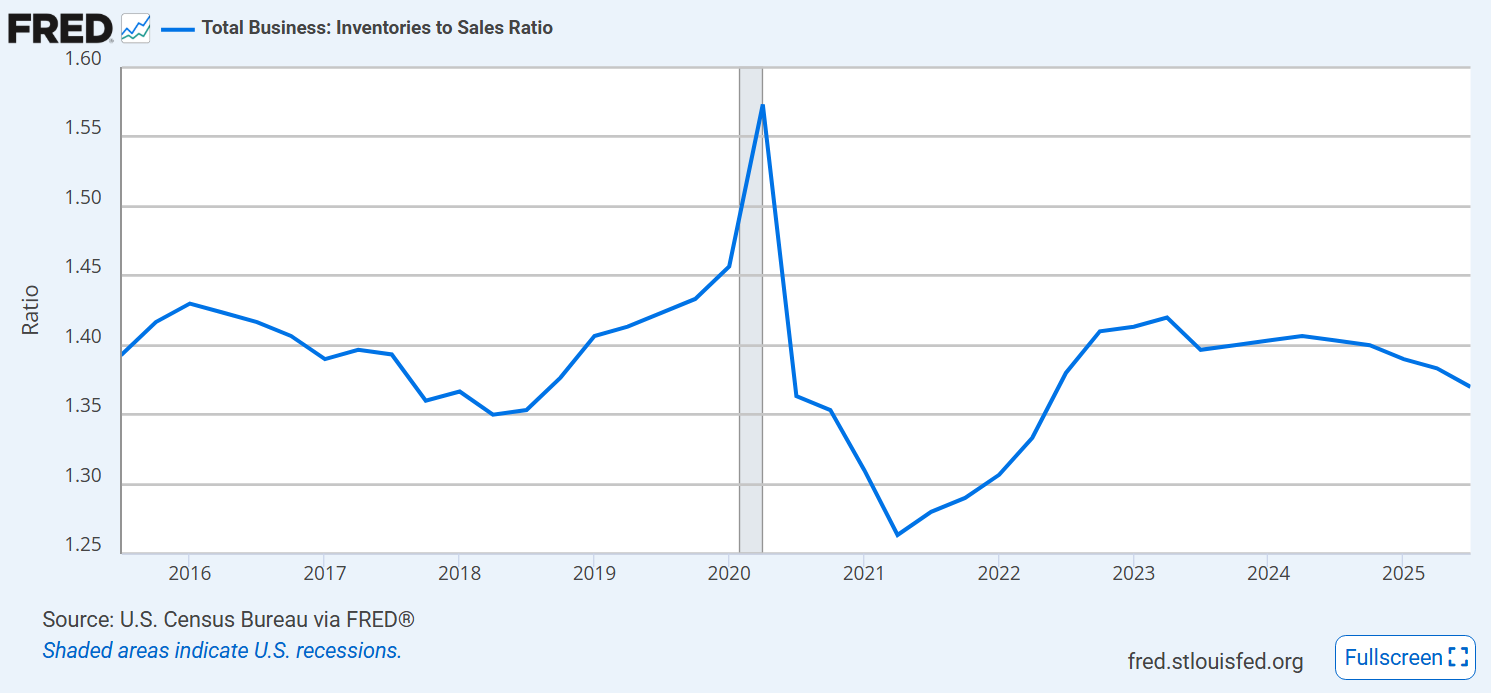
Businesses have maintained their target inventory to sales ratios.
Consumer confidence is down and weak.
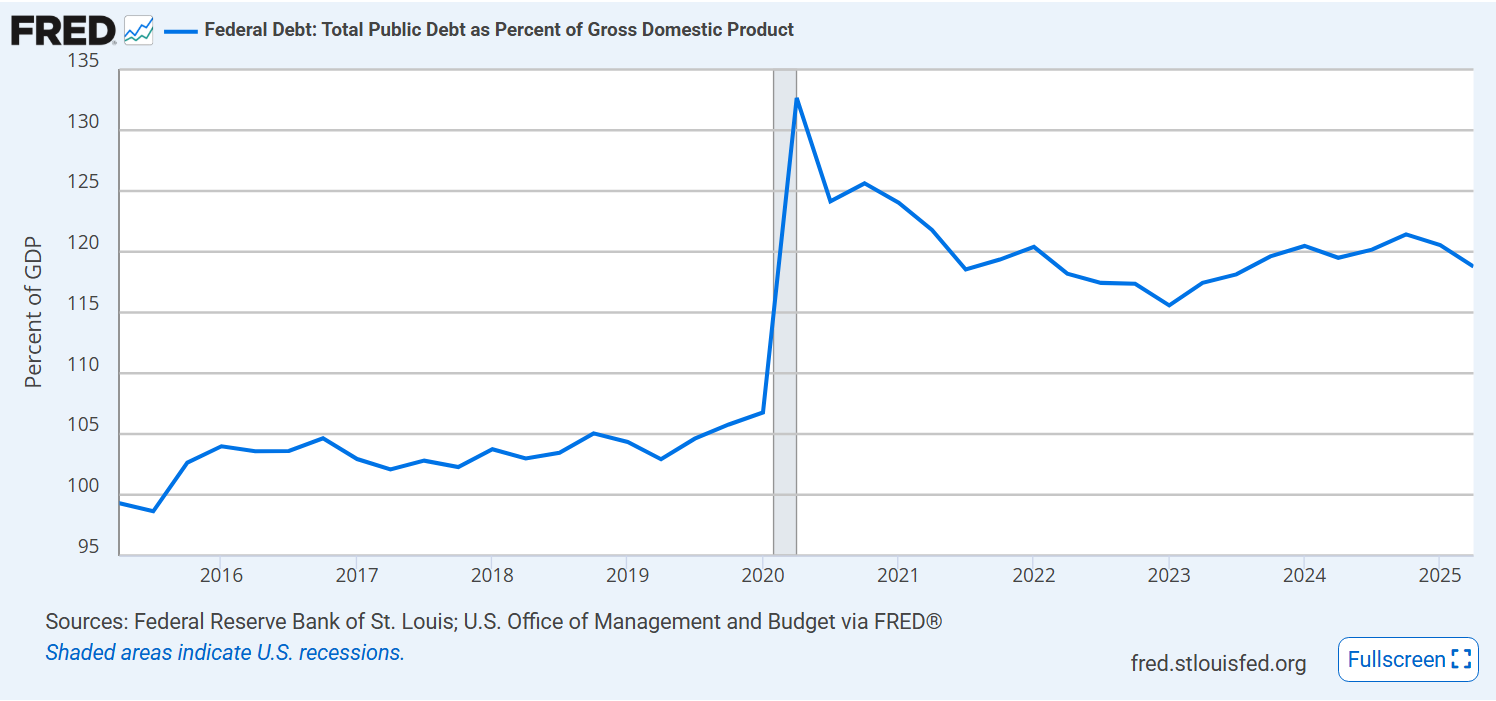
Federal debt % of GDP remains at 120%, up from 105%.
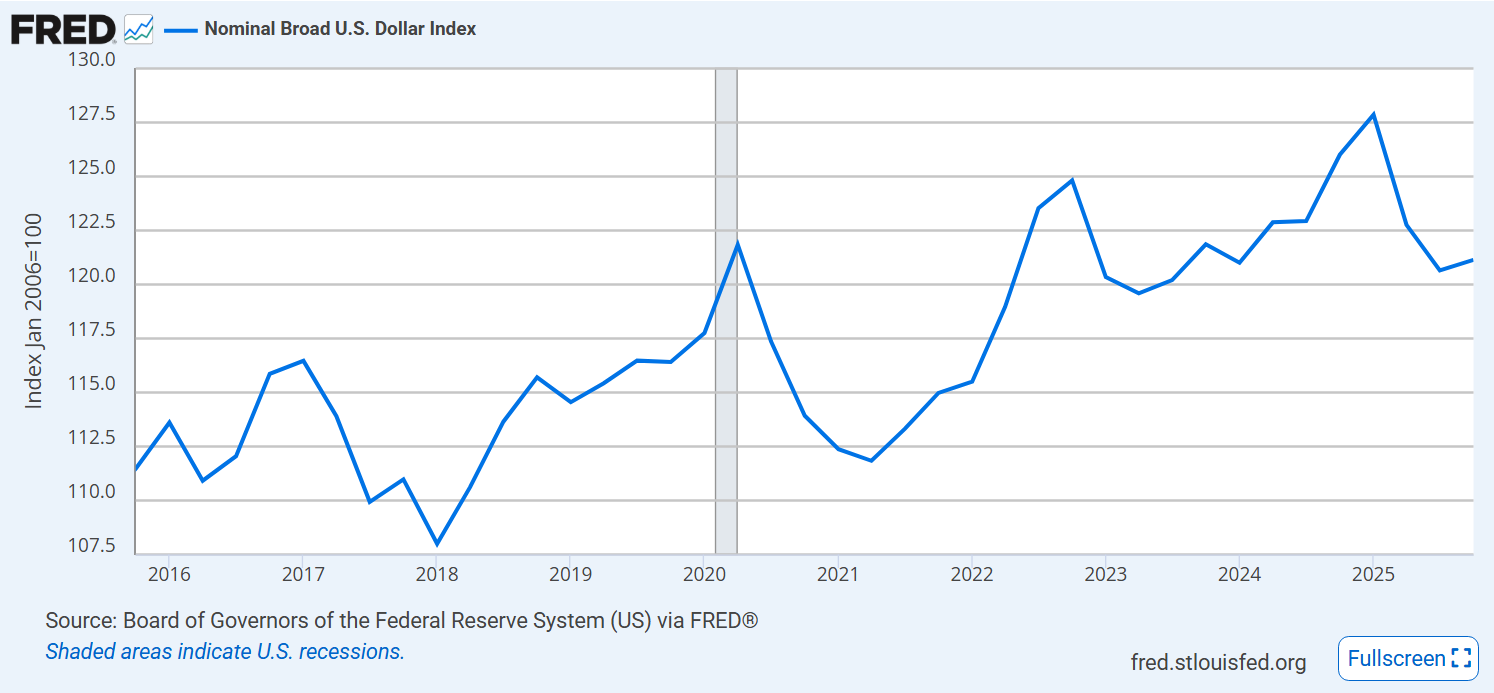
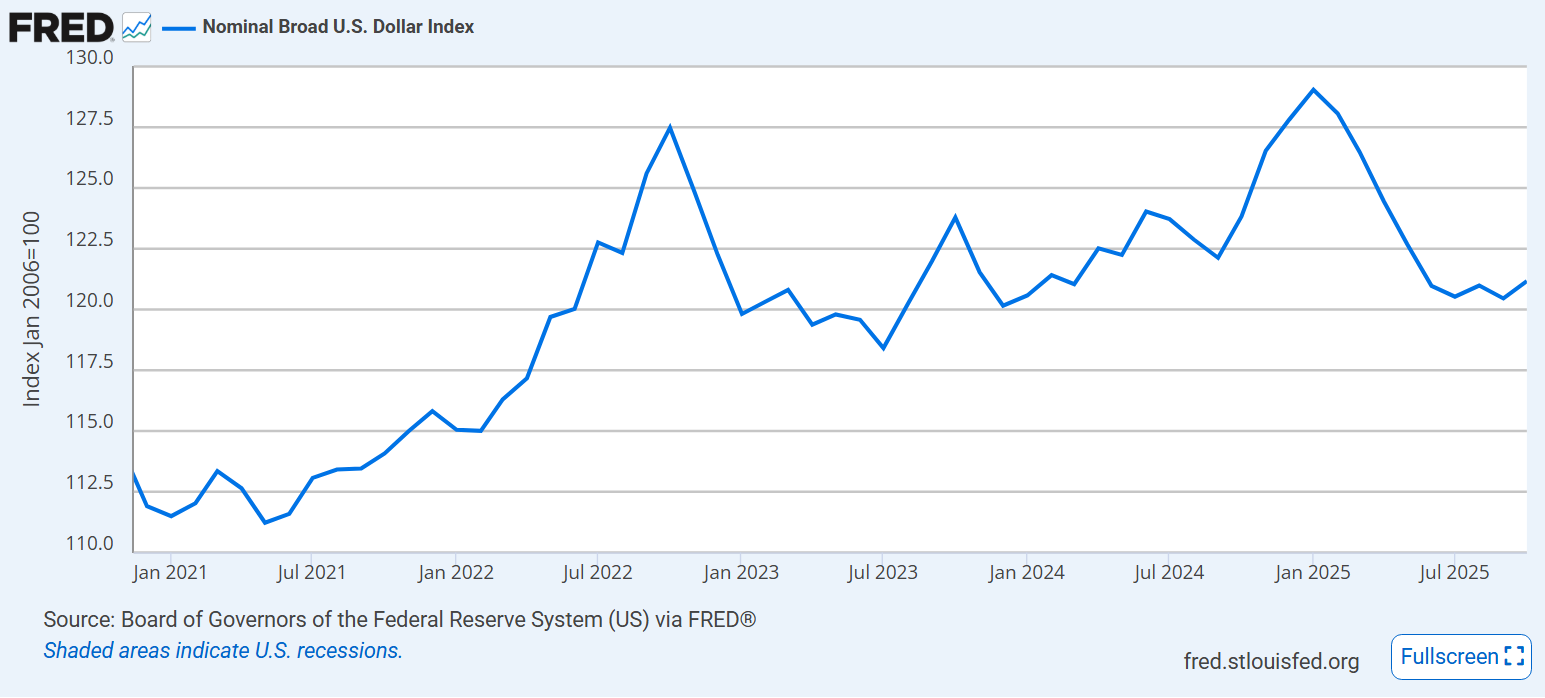
Value of the US dollar increased by 10-12% after the pandemic, but has retreated by 6%.
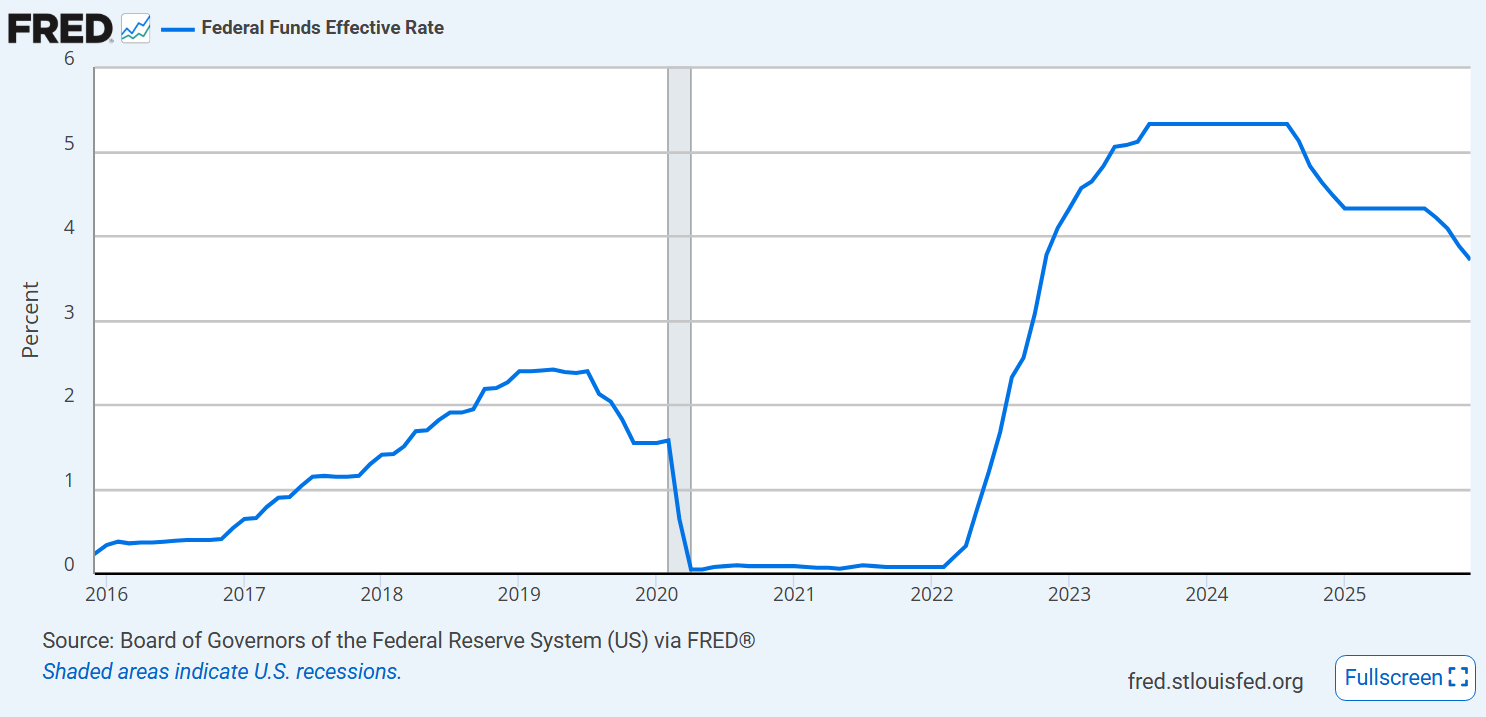
The Federal Reserve Board has reduced interest rates by 1.5%.
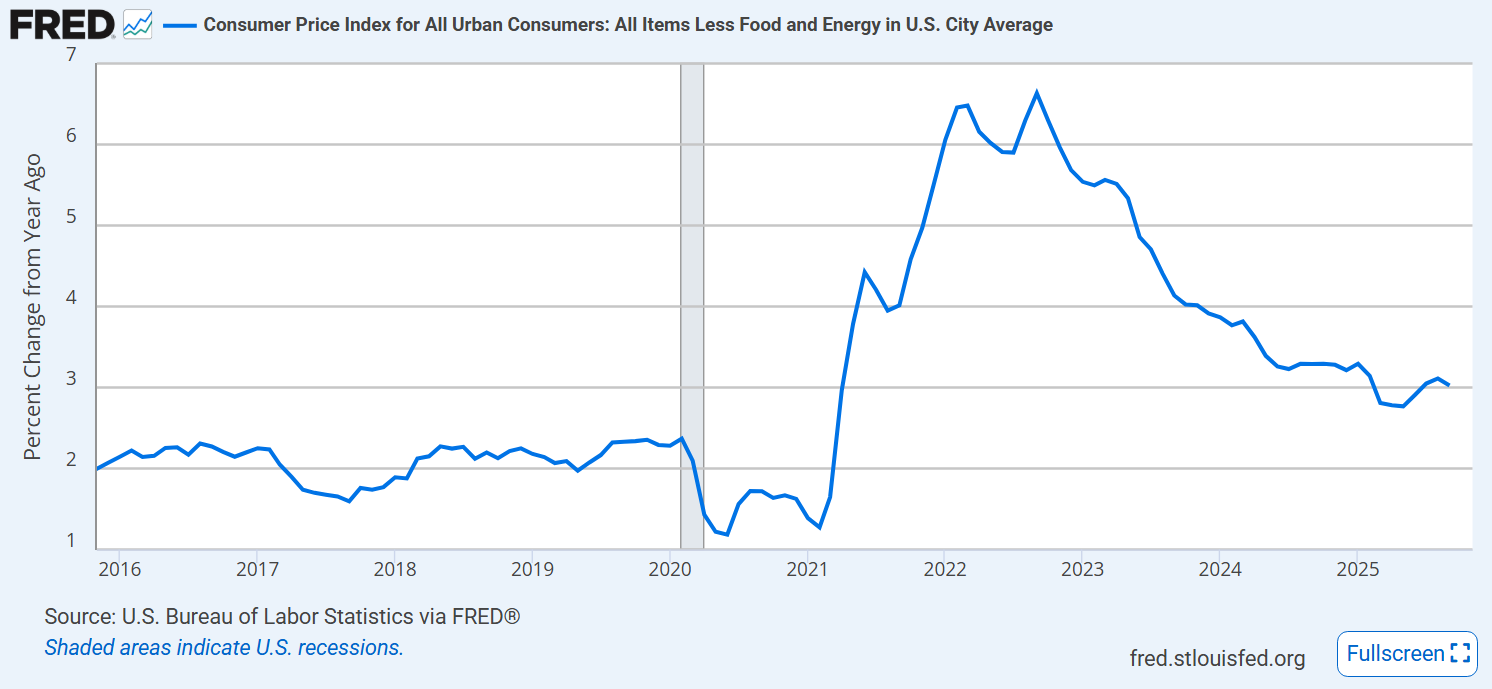
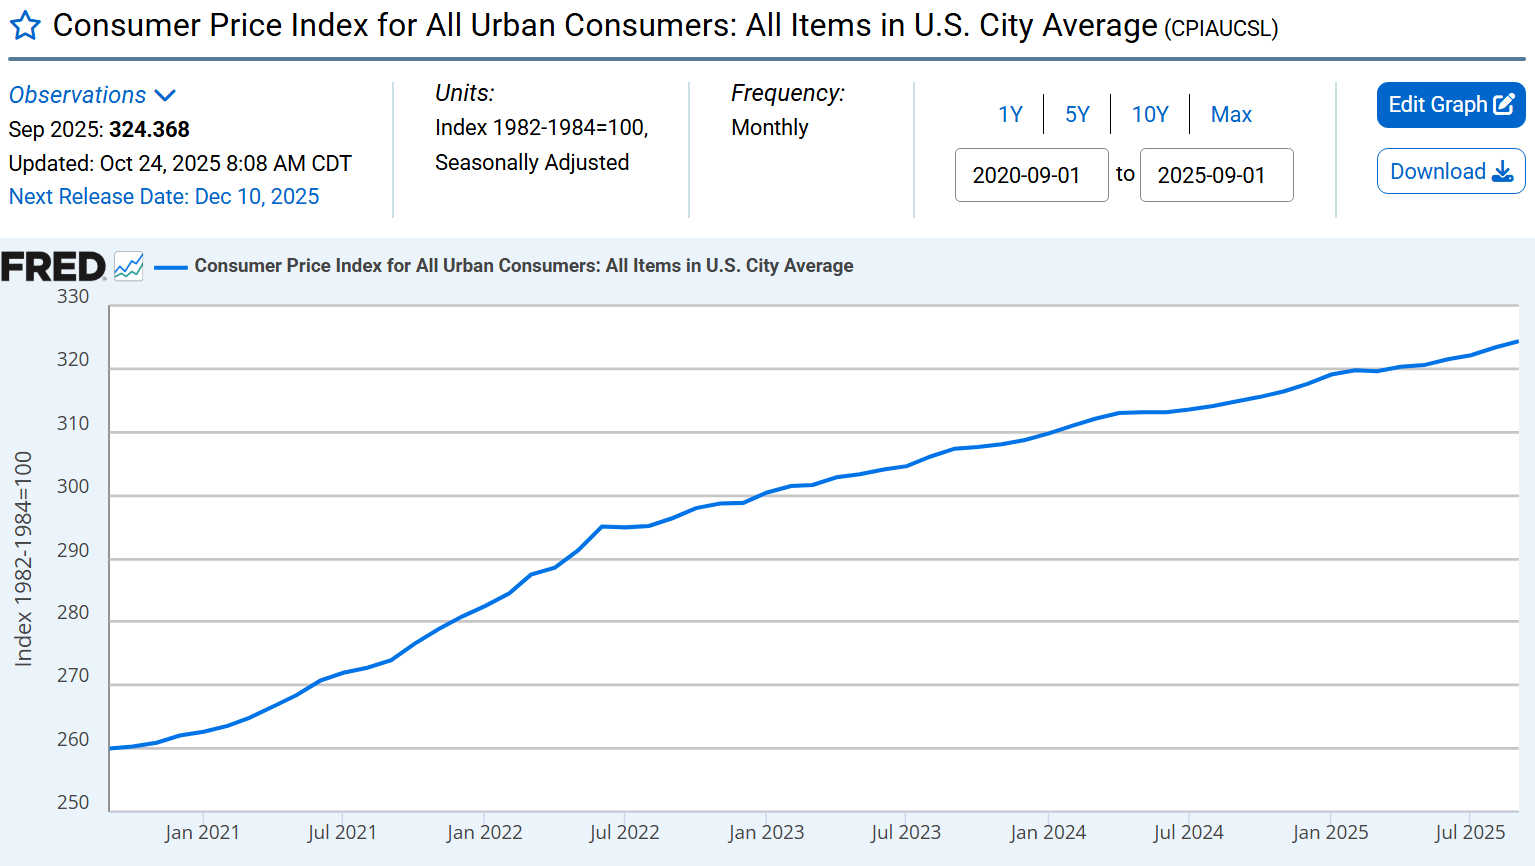
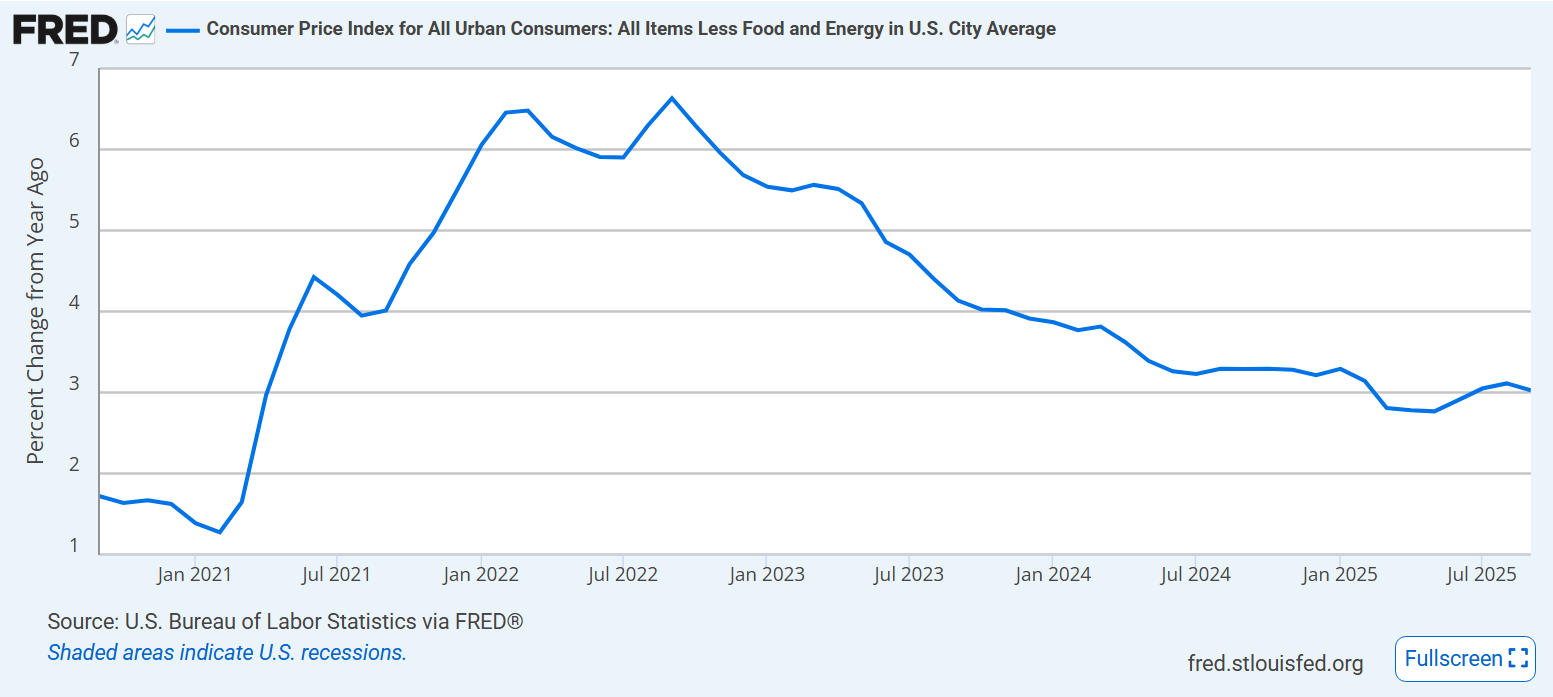
Core inflation rate has levelled off near 3%.
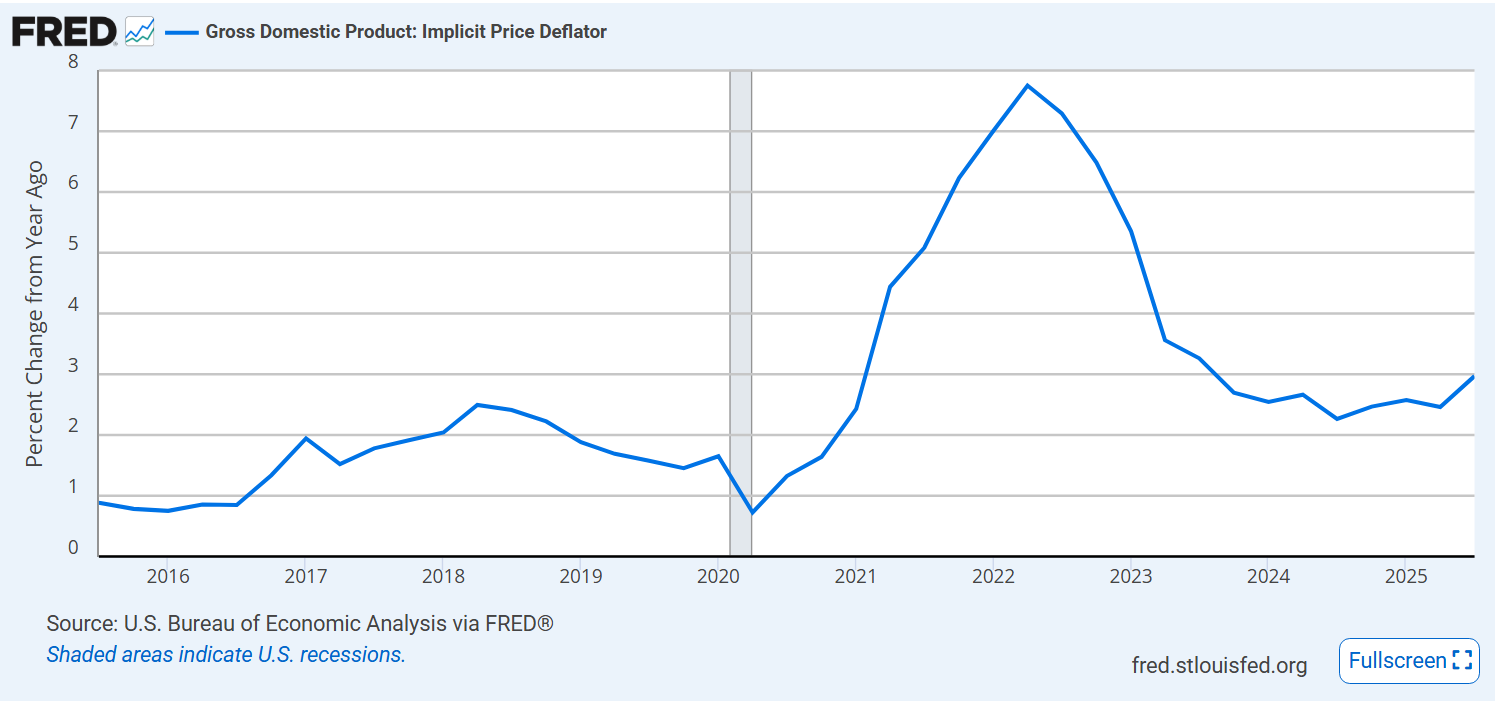
The GDP Price deflator measure of inflation is a little better, approaching 2.5%, but also level or growing.
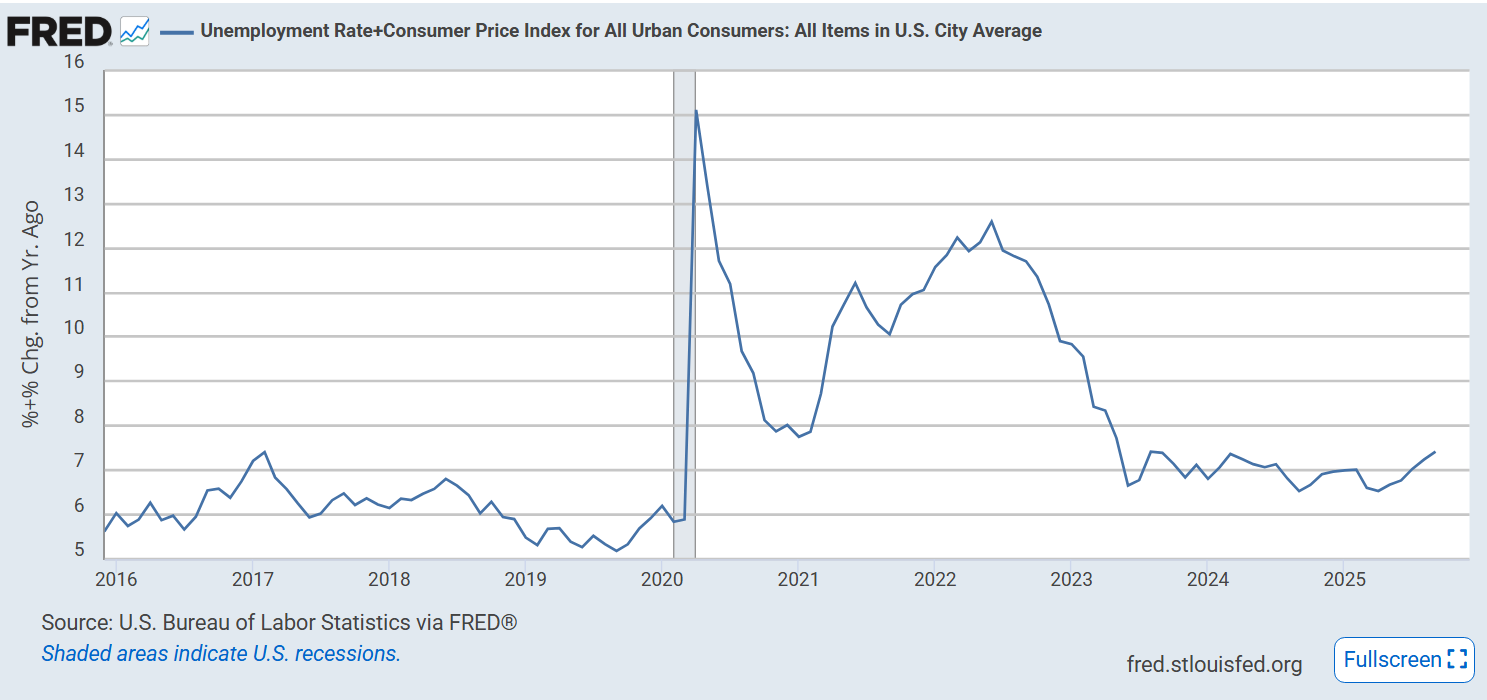
Misery index is up a bit at 7.5%.
Summary
Stock market is solidly up together with corporate profits and business investment.
Inflation and unemployment are up. Budget deficits and debt remain high. Dollar value is down. Manufacturing employment is down. Business and consumer confidence is down.
Other measures are comparable to the 2023-2024 Biden economy base; not improving as often claimed.
The US economy is increasingly resilient and not easily changed by small policy choices or “jawboning”.
I wrote many posts during the Biden administration to counteract the recurring false claims about “runaway inflation”. Biden was certainly guilty of spending too much taxpayers’ money for economic recovery, infrastructure, green projects and student loan forgiveness. This aggravated the inflation rate, made it slower to fall and established expectations of higher long-term inflation. However, the primary drivers of inflation were the pandemic driven demand for physical goods after factories closed, loose monetary policy and bipartisan government spending to offset the pandemic. We all enjoyed 20 years of price stability before this. A little bumpiness after a pandemic driven global shutdown was not surprising.
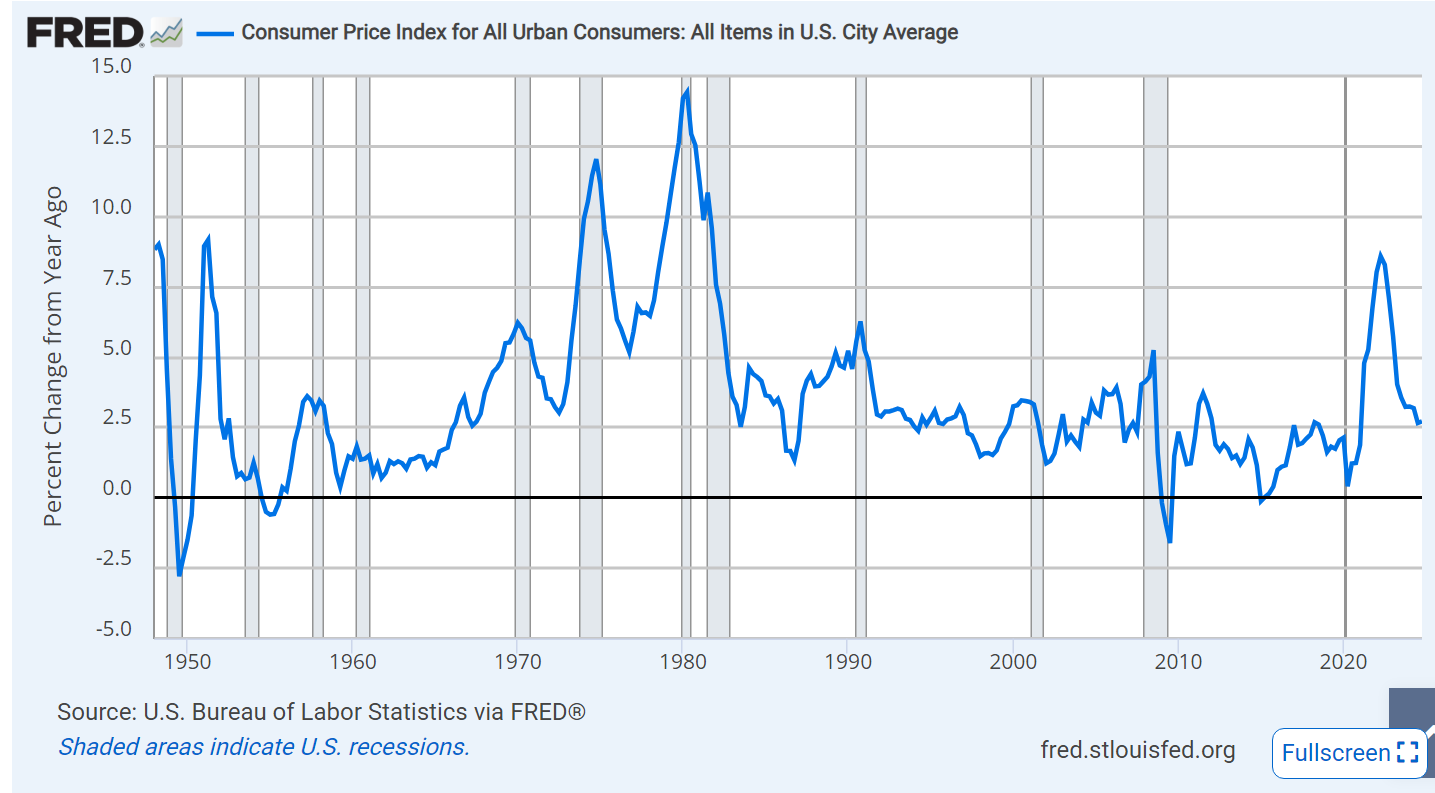
The climbing inflation rate broke in June, 2022 more than 3 years ago. It has not slowed under Trump’s stewardship.
The inflation rate has been in the 3% +/- range for the last 2 years. That means that prices, on average, continue to increase each year. 2% inflation was the normal rate for the prior 20 years. It (3%) seems to be a rate that is “non-accelerating”. Economic agents, including consumers, are able to ignore 2% inflation. It is immaterial, too small to really notice. 3% inflation is on the border of being “concerning”. Inflation can more easily accelerate from 3% to a concerning 5% or higher. President Trump can claim that he has maintained the Biden inflation reduction from 9% to 3% but he cannot claim that he has reduced prices, reduced inflation or made the cost of living more affordable.
The core inflation rate, excluding the more volatile food and energy prices, has shown the same pattern. It peaked at 6.5% and declined to “about 3%” by June, 2024. It has moved down by one-quarter percent since then. Unfortunately, it seems to be flat. Trump has not moved it down.
President Trump has pursued 2 of these 12 areas but worked in the opposite way to increase inflation on most. He has pressured drug prices down. He has encouraged increased supply of traditional fossil fuels energy.
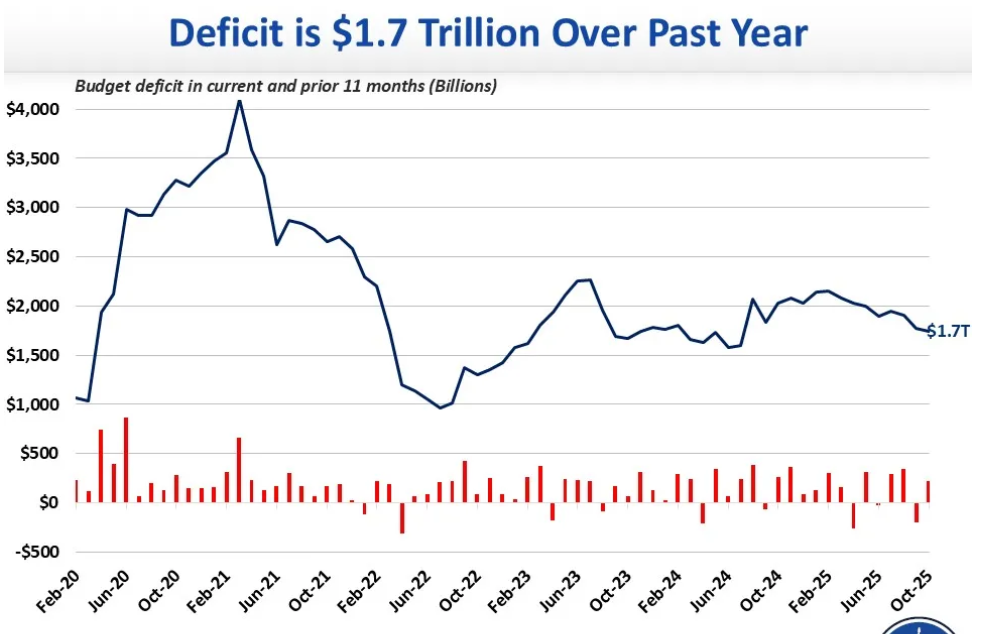
Fiscal Policy
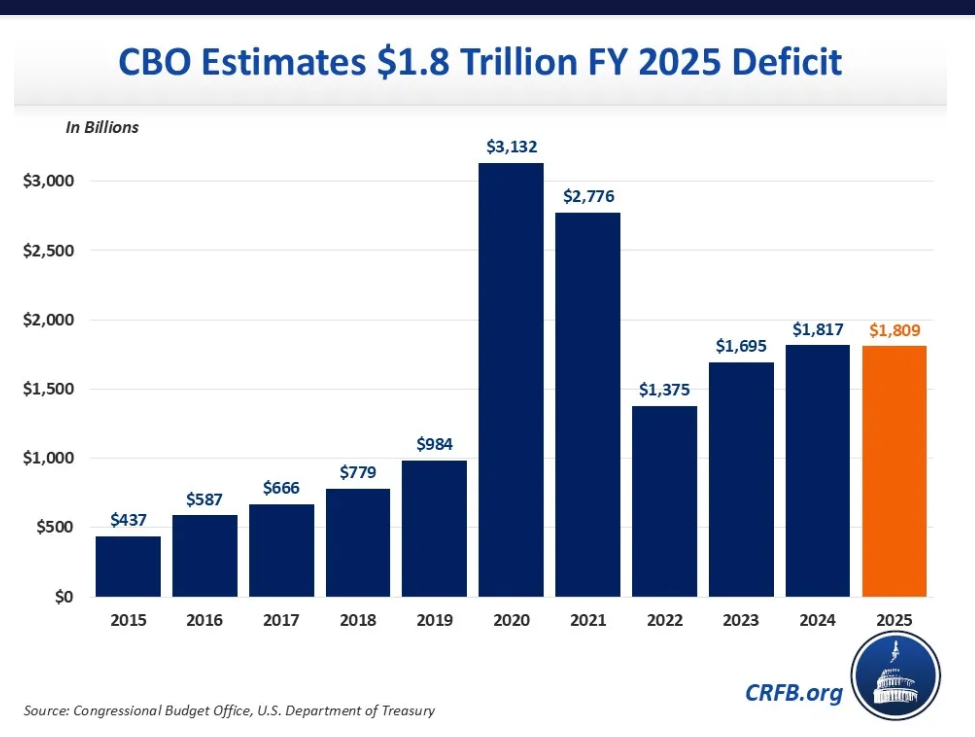
Federal budget deficit remains at an unsustainable $1.7T per year. Too much demand, not enough supply.
Monetary Policy
President Trump has been harassing Fed Chair Jerome Powell (who he appointed) to cut interest rates. The real, inflation adjusted, interest rate is currently 1%. Monetary policy is neutral or a little tight. President Trump encourages looser monetary policy which increases inflation. Not an inflation fighter.
US Dollar
The US dollar has declined in value since Trump took office, making foreign purchases more expensive.
Housing Costs
Housing prices peaked in 2022, drifted down by 5% in 2022 and have remained flat for the last two and a half years. Trump policies have no impact here.
Health Care
3% medical inflation continues despite efforts to reduce drug prices.
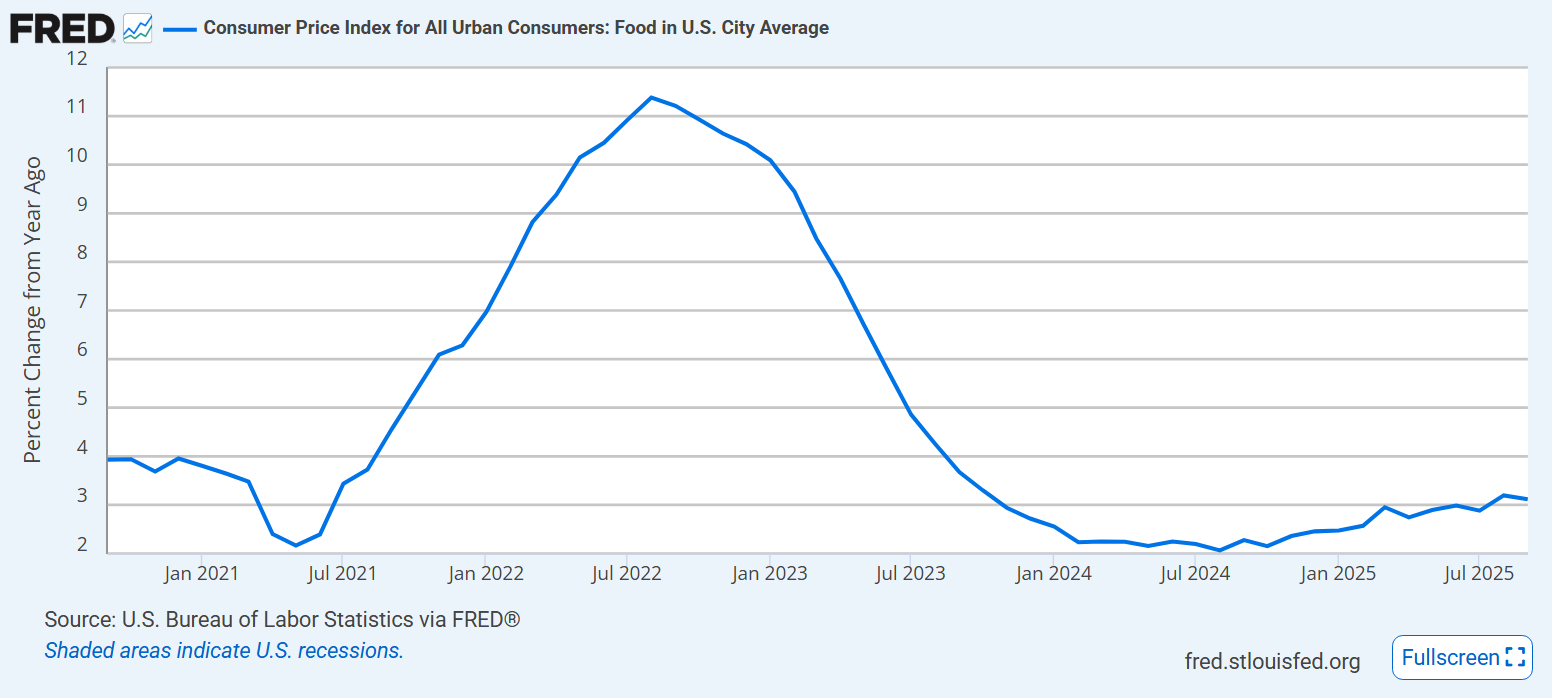
Food prices are more volatile than most. Inflation reached 11% in 2022. It approached 2% in 2024 but has since increased to 3% annually.
Energy
Energy prices jumped in the first 2 years of recovery from the pandemic. They have been flat since then. Trump has cancelled $8B worth of previously authorized energy projects.
Gas prices averaged $2.50/gallon before the pandemic, spiked up to $4.50/gallon during the recovery and settled back to $3.00/gallon for the last 3 years.
Tariffs
US consumers enjoyed immaterial average import tariff rates for the last 50 years. Trump has levied an 18% tax on imports, increasing costs for American consumers of the 14% of their consumption that is imported. The inflationary impact of the Trump tariffs has not yet been passed along to consumers. The frequent changes in tariff rates have led businesses to absorb costs in the short run. This will not continue.
This recent tax change benefits individuals with enough income to pay federal income taxes, so improves affordability for an estimated 4 million people.
This provision of OBBA benefits low to moderate income households aged 65 and older. Many experts criticize its structure, but it clearly makes life more affordable for those who benefit from the change.
Higher Limit for State and Local Tax (SALT) Deductions
Higher income taxpayers who itemize deductions received a significant federal tax reduction. This change does not benefit most low to moderate income households.
Increased Cost and Reduced Availability of Child Care
The OBBBA increased tax credits to partially offset childcare costs. Critics considered these changes to be inadequate, noting that a “pro-family” political party should do better.
Greatly reduced net immigration will tighten the labor supply in some industries, leading to higher compensation for some workers and higher prices for consumers. Economists have not reached a consensus on the net impact to the typical American.
Inflation continues at 3% annually. Real wages are keeping up with inflation. The memory of large price increases in 2022 that were never reversed seems to have reset inflation expectations from 1-2% to 3-4% per year. Some tax law changes in the One Big Beautiful Bill meaningfully cut taxes. Fiscal policy remains very loose and drives inflation. Monetary policy is considered neutral by most economists, but Trump is trying to loosen it, which risks further inflation. Trump’s “on/off” tariff negotiations have not yet driven large consumer price increases but have slowed business investments. Trump’s claims to have improved “affordability” rest on his specific actions that point in that direction, not on the economy wide statistics or large-scale policies that might significantly improve affordability for the “average” family.
The “orange one” does not “hold all of the cards”. He is critically threatened by his foreign handlers and the US justice system. He was not elected to promote a trade war. No one expected a trade war. He merely “shadow boxed” during his first term on trade. He has made the “trade war” his first priority because it is a “sure win” politically, in the short-run. He first bluffed exaggerated 50% and 100% tariffs, and the media duly reported these crazy claims that anchor or outline the story. He now claims HUGE victories with 15% tariffs. The self-described GOAT negotiator thereby proves his standing. He claims victory. He uses this temporary bump in support to take over the government.
Citizens need to recognize that this is clearly not a “win” for the country. Import tariffs are simply taxes. They get split between the foreign exporter, the importer and the retail customer. At 15%, the typical payment split is 25%, 25% and 50%. Exporters still want to sell goods and maintain market share. They have fixed costs. They have profits. They can reduce prices in the short-term. Importers still want to sell goods and maintain market share. They can limit price increases in the short-term. Most markets are “sticky”. Brands, supply chains, habits, marketing and convenience matter. Import costs are half to three-quarters of retail prices. The consumer price increase is 5-8%. Some consumers switch to lower priced options, some don’t. The “next best” low price option for an imported good is probably another imported good. The “Trump tariffs” distort markets. They don’t deliver a “victory” for American consumers, producers, labor, finance or government. They merely “gum up the works”.
The “orange one” understands leverage, populism and persuasion. He really doesn’t understand markets, as demonstrated by his dozens of business failures. A 15% import tariff will cause pain for foreign exporters, US importers and consumers. It’s not large enough to cause a domestic firm to invest in expanded capacity. They will use all of their existing capacity and even cut prices a little to win market share. Manufacturing investments require 20-30-40 year timeframes to be viable. They require confidence in government policies on trade, regulations, antitrust, labor, environment, intellectual property, lobbying, property taxes, inventory taxes, corporate income taxes, international taxes, international finance, transportation, supply chains, labor costs, etc. Trump’s policies strongly work against such investments.
US industries don’t import goods to save just 10%. They import goods because the total cost of imports is at least 20% lower and trending in the right direction. Importing always has extra costs for transportation, communications, delays, coordination, property risks, quality control, product development, supplier management, flexibility, tariff risks on both ends, legal risks, capital controls, financial transactions, inventory, obsolescence, etc. There is a “step function” involved here. US firms from 1970-2000 only relinquished their domestic manufacturing because when they completely ignored all fixed costs and only looked at short-term variable costs, they had to outsource production. There will be no overall manufacturing renaissance. There will be some very low labor cost manufacturing that returns to the states. That is, only where labor costs are a small percentage of the total production cost. Hence the “job creation” impact will be tiny, impossible to measure.
So … if they won’t build new factories, what will be the leading responses of domestic importers? They will find ways to import/reroute goods from lowest tariff countries. They will find ways to reclassify goods and avoid tariffs. They will lobby for exemptions. They will import only key components and do “final assembly” locally in highly automated factories. They will hold imported goods in a Free Trade Zone. They will split physical products from services and intellectual property to minimize tariffs. They will lobby for domestic government subsidies. They will offer “service hour models” to customers as in aircraft engines and never sell the physical goods and incur the tariffs.
Will the import tariffs reduce the federal budget deficit? Yes. The US imports 15% of GDP. Tariffs will be applied to about half of the imports. Imports will be reduced and replaced by domestic production, a little. 15% of 5% is about 0.75% of GDP. The federal budget deficit is 6.5% and climbing. This will help a little. Consumers will pay for half of this as in a sales tax.
What are the secondary impacts of the tariffs? Domestic firms will invest management time and money in managing the system instead of developing better goods and services. Lower import competition often leads to higher prices overall. Domestic producers experience higher input costs and attempt to pass them along to consumers. Foreign countries will increase their tariff and non-tariff barriers to US exporters. The US loses its moral advantage as a promoter of “free trade”. The US loses opportunities to reduce trade barriers through global and regional “free trade” agreements. The US loses the opportunity to drive global labor and environmental standards. The US loses the opportunity to expand free trade in services, the industries of the future. The US’s “unfair advantage” as the manager of the US dollar as the global currency will be challenged. The US’s soft power in language, arts, education, language, culture, and global leadership will be questioned. The US’s role as a stalwart ally will be undermined, leading to merely costlier and unreliable transactional relations with former allies. Foreign citizens will choose to not consume US goods and services. The US will have to pay directly for its global military bases. The US will have to pay for allies’ support on the “war on terror”. The US will have to pay for all global initiatives. The US will have to directly control “rogue states”. The indirect costs are HUGE and unappreciated.
Why did the US pursue the post WW II new world order? Ending imperialism and colonies. Forming the United Nations and trying to use it to manage some conflicts. Principles of political self-determination and human rights. Global bodies for better health. Investments in Germany, Italy, Japan and Europe instead of reparations. International Monetary Foundation and World Bank to support developing nations and manage currencies. GATT and WTO to promote lower trade barriers and multilateral deals. NATO and other alliances rather than colonies and protectorates. The win/lose approach of the 1800’s, WWI and WWII had failed. The world was ready to try a win/win approach. The US, with its history of isolationism, exceptionalism and national independence, chose to not pursue “world dominance”. The post- WWII institutions were not perfect, but they demonstrated that they were much better than those that had governed international relations for the prior 500 years.
Again, put everything in perspective. The US imports 15% of GDP. 15% import tariffs on half of goods. Consumers adjust and substitute domestic and lower total price imports. US consumers pay a 1% sales tax on imported goods. US military and influence costs rise by much more than 1% of GDP. Consumers pay higher prices. The US has less global influence. Where is the win? Marginal manufacturing plants and jobs are not returning to the US, no matter what the “orange one” says unless they are subsidized by the local, state or national government.
This is just another “con” by the “orange one”. We want to believe that American jobs have been unfairly stolen by government subsidized factories and low-cost labor without environmental protections in foreign countries. There is a grain of truth in each claim. Foreign governments do subsidize export firms. They try to maintain low currency values to support exports. They accept low total labor costs and environmental damages. Every country tries to be globally competitive.
No “magic wand” exists to force or entice everyone into embracing win/win institutions or deals naively. There is always an incentive to be a “free rider”, taking advantage of the global deals and quietly not really complying, just like some oil producers in OPEC. There is always an advantage for a single country with enough power to “hold out” or bluff or play “chicken” to extract a better deal for that country than for the others. This is the real world of bargaining, negotiations and deal-making. No system, philosophy, institutions, social pressure, or trump card easily delivers win/win results without overcoming the win/lose incentives of the game’s players.
There was a time when “Republicans” were supposedly the party of realism, pragmatism, common sense, business, efficiency, logic, finance, trade, capitalism, science, industry, proof, objectivity, best practices, and elite opinion. “Democrats” allegedly appealed to emotions, wishes, utopias, fairness, justice, perspectives, hopes, possibilities, oppression, victimhood, persuasion, popular opinion, populism, and ideals. The post-WWII institutions were supported on a bipartisan basis for more than 50 years. In 1992, President Clinton and the Democratic party embraced the “third way”, fully supporting these policies, capitalism and limited government, despite criticisms from the progressive, new, far left. The post – WWII system of international institutions has been criticized as “globalism” and “neo-liberalism” by the left wing of the Democratic party.
The post-WWII institutions were not perfect for Democrats, Republicans, the USA or the global community. But they worked incredibly well. Real global GDP has increased by 40 times since 1945, from $2.5 trillion to $100 trillion!!!!! That is 4.72% real growth compounded year after year after year for 80 years, coming out of a world war, encompassing a cold war, the Vietnam War, the Korean War, a global pandemic, the collapse of birth rates, business cycles, financial panics, energy crises, Middle East wars, and terrorism.
A comparable 80-year period before the Great Depression shows just 4-fold global real GDP growth, not 40-fold. Of course, much of this difference is due to differences other than the post-WWII institutions. This was a time of 1.75% annual growth rather than the modern 4.72%. The 3% annual difference compounded across 80 years delivers 10 times greater growth. This is not a marginal advantage. This is an UNBELIEVABLE advantage. This is difficult to communicate. Small percentage differences across a lifetime.
The “bottom line” is that the “orange one” only believes in “win/lose” and rejects any form of “win/win”. The post-WWII institutions are win/win, so they must be rejected. Capitalism, alliances, partnerships, joint ventures, corporations, modern supplier relations, families, communities, nations, treaties, fraternities, sororities, ecosystems, clubs, cooperatives, unions, study partners, mentors/mentees, credit unions, mutual insurance companies, social enterprises, not-for-profits, churches, service organizations and many others are win/win. The “win/lose” framework supports the “orange one’s” desired position as a great leader needed to save the people.
Free trade has provided truly amazing benefits for the US and the world. The post-WWII cooperative institutions have reduced wars and conflicts. The “Trump tariffs” will slow global economic growth. They will not provide any material benefits for the US.
The US has enough economic, social, political and military power to force country by country “deals” that appear to benefit the US, when considered in a short-term win/lose framework. These deals will harm the US and the global economy.
From 1945-2000 “free trade” was Republican economic orthodoxy. “Free trade” benefitted US multi-national corporations which had the ability to take advantage of global markets. The US economy and labor markets were flexible enough to manage the changes. Capitalism was supported as the best economic system versus communism, fascism, socialism, protectionism, imperialism, colonialism or mercantilism. US financial institutions were well positioned to facilitate trade. US universities were ready to educate the world. Imported goods and immigrant labor drove lower US wages.
Trump is appealing to his populist base to oppose the “others” of immigrants, non-whites, non-fundamentalist Christians, criminals, thieves, rapists, sweat shops, subsidized factories, polluters, underpaid workers, etc. “We should produce everything we need in America. We have the factory capacity, finances and skills to do so.” He appeals to nationalism while ignoring the critical principle of comparative advantage. Countries export only what they are very best at growing, producing or serving. They do not produce everything themselves just like states, firms and individuals that are not fully self-sufficient.
1984 – Eli Goldratt offers a “theory of constraints” as a way to understand and manage complex systems effectively, leading to true “lean manufacturing” and “lean operations”.
Process standardization. Financial innovation. Highly focused strategies. New business forms. Markets and international trade deliver desired products, lower prices and competition. A role for government regulation remains. The macroeconomy can be managed to reduce the impact of business cycles and shocks.
From 1945 through 1985 the US economy regularly accelerated its growth, reached a peak, fell back and then recovered. Businesses, economists, politicians and the public expected that this 3-5 year business cycle would continue forever.
Looking back, it seems like the business cycle was broken by 1985. All of the subsequent downturns have been prompted by extraneous, outside of the system, shocks. In 1990 a second global oil shortage shock.
40 years without a classic business cycle recession is long enough to claim victory.
How could this happen? The independent Federal Reserve Bank has maintained a neutral monetary policy. We have not “shot ourselves in the foot” and we have implemented reasonable policies to offset external shocks. The federal government budget deficit has generally returned towards zero following depression periods. Automatic stabilizers and congressional action have addressed recessionary periods with enough stimulus to stop economic decline and restart recovery.
More importantly, the structure of the US economy has changed. The share of high fixed cost manufacturing has declined as “services” has increased as a share of the total economy. The share of international trade (imports and exports) less directly connected to the domestic economy alone, has increased. The power of labor (unionized or not) has fallen, allowing firms to reduce hours and real wages during a downturn. In most recent times, firms better recognize the cost of attracting and developing highly skilled labor in a complex production world, so they retain key staff even during downturns. Vertical integration has been reduced, allowing firms to respond to minor demand changes more effectively. Based upon the quality revolution, major firms have reset their capacity utilization targets to 80% rather than 95%, providing firms with greater flexibility in managing variable demand and not reaching the point where internal costs increase and the need to increase prices occurs.
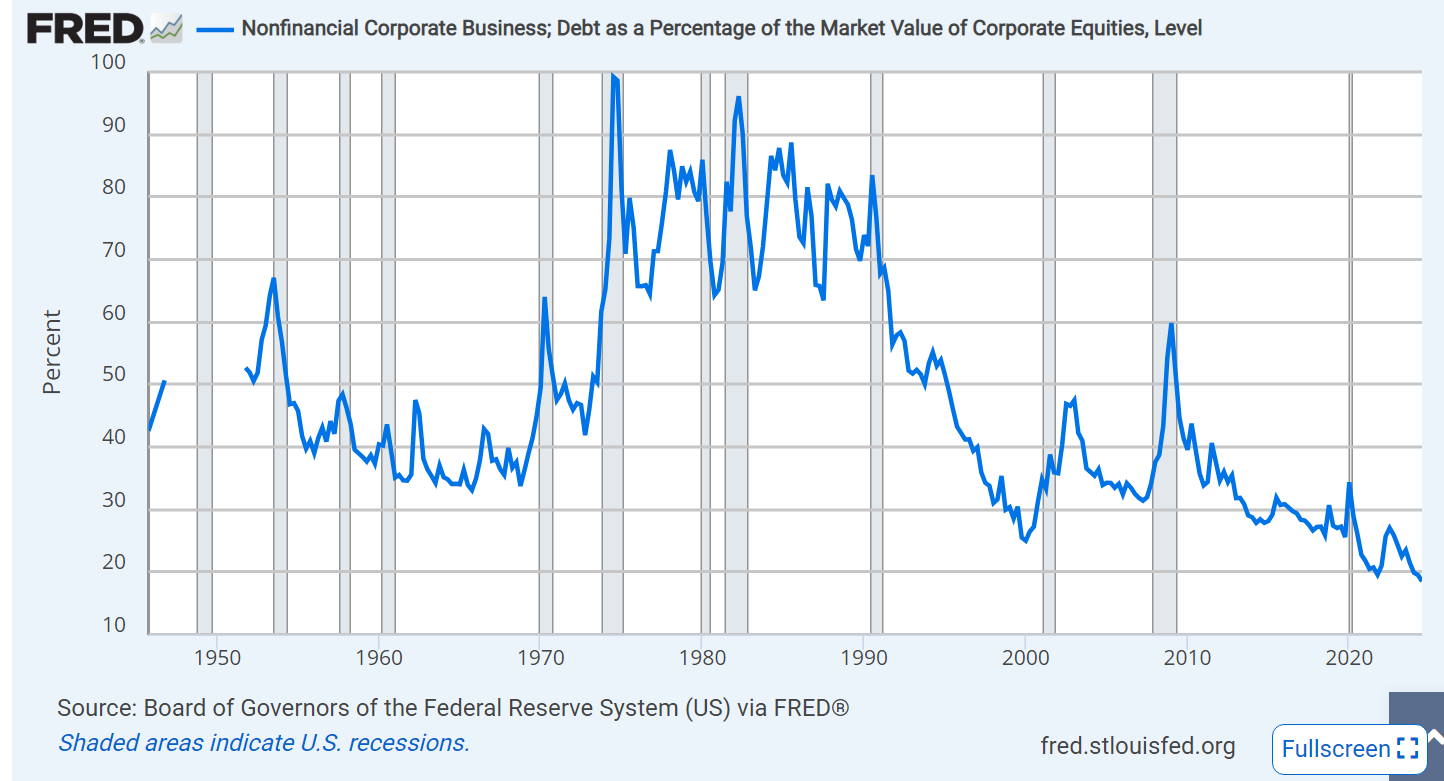
Financial leverage has also decreased. US firms have access to deep bond markets so are they able to incur only necessary levels of indebtedness.
Even with a much greater level of imported goods, retailers hold lower levels of inventory, allowing them to not overreact to changes in demand. Firms have more effective supply chain management processes.
The unemployment rate also shows this structural change. When it was pushed below 5% in the 1960’s, inflation increased and was not permanently checked for 20 years. By 2000 the economy was able to expand and keep unemployment below 5% for extended periods of time without triggering “cost-push” inflation. Unemployment still increases during an economic downturn, but low unemployment does not seem to trigger a recession.
From the 1950’s through the 1980’s inflation tended to increase as the economy overheated before a reduction in credit availability would slow the overall economy. Aside from the Covid pandemic shortages, we no longer see major inflation increases.
Impact
The business cycle caused firms to underinvest because the best available forecast was always that the boom period would be interrupted in 1-5 years. Sales, margins and profits could not be assumed to increase forever.
The business cycle caused firms to follow a stop-start pattern for capital investment projects, process improvement, research & development, new product introduction, new markets, new channels and mergers & acquisitions. Seeing a downturn, firms would cancel existing initiatives, even at a significant cost, in order to conserve cash and signal to stakeholders that management was actively managing the business. Projects would slowly resume after it was clear that the business cycle recovery was under way 2 years later.
For individuals, the “last hired, first fired” cycle applied. Firms froze open position hiring. They released interns and summer workers. They prohibited overtime. They cancel contracts with temporary labor firms. Less experienced workers and minority groups suffered. Labor intensive industries, especially construction, were hard hit. Smaller firms closed. The hiring cycle would resume 2 years later.
Historically, stock market values also followed the pattern of the business cycle closely. Stock market declines were seen as an “early warning” indicator by forecasters. Since stock market values are theoretically determined by a risk-adjusted discount rate, the reduction of business cycle variability allows investors to use a lower interest/discount rate and value future earnings at a higher net present value.
Summary
The business cycle appears to be gone. The modern economy does not have the same high fixed costs it once had. Firms are able to increase their sales, profits and capacities in tandem without greatly overshooting the mark. Our national institutions help to keep growth at a sustainable level. Workers, firms, investors and society all benefit from this great advance, even if it is not publicly celebrated.