

Population Growth
The US population has grown from 2.5 million in 1776 to 76.3 million in 1900 to 158.8 million in 1950 to 329.5 million in 2020. More than a 100-fold increase, 2+ orders of magnitude.
28 individual metro areas today EACH have a population (2020) equal to or greater than the WHOLE USA in 1776. Pittsburgh, Portland, San Antonio, Austin and Sacramento each have the same 2.5 million residents. Charlotte, Orlando, Baltimore and St. Louis each have a slightly greater 2.8 million citizens. 19 other metro areas today have a significantly larger population.
Declining Rural Population
The US began as 100% rural. By 1900, cities (2,500+) accounted for 40% of the total population. By 1950, city populations were the majority at 60%. In 2020, cities contained 80% of the US population.
Urbanization
In 1776, the US had 5 cities of 10,000 people, led by Philadelphia with 30,000.
By 1900 the nation had 11 major cities with a half-million people or more, led by New York with 5 million and Chicago, Philadelphia and Boston near 2 million. Baltimore on the east coast and San Francisco on the west coast were joined by the Midwest cities of Pittsburgh, St. Louis, Cleveland, Cincinnati and Buffalo to round out this group of early leaders. These 11 exceptions to the still largely rural landscape accounted for one-half of the urban population, 20% of the national population.
By 1950 there were 15 metro areas with a million people or more, up from just 5 in 1900. San Francisco, St. Louis, Cleveland, Baltimore and Buffalo exceeded 1 million as did newcomers to the major city list: Los Angeles (4.4M), Detroit (3.0M), DC, Seattle and Dallas-Ft. Worth. Kansas City, Minneapolis-St. Paul and Houston joined Cincinnati as “major cities” defined as greater than 750K residents. These 19 metro areas contained 50 million people, 31% of the nation’s total and a little more than half of all urban residents. Led by New York’s 13M, the east coast metros totaled 22 million people. Led by Chicago’s 5M, the Midwest metros were close behind with 18 million people. The 3 west coast cities combined for 8 million while the Sunbelt’s 3 cities amounted to just 2.5 million people.
For 2020, we use 2 million as the minimum size for a major metropolitan area. New York (20M), Los Angeles (12M) and Chicago (9M) led the way. Dallas-Fort Worth, Houston, Washington, DC, Philadelphia, Atlanta and Miami all had at least 5 million citizens. 15 new metro areas joined the list, beginning with 6 on the west coast: Phoenix, Riverside-San Bernardino, San Diego, Portland, Sacramento and Las Vegas. The others are widely distributed across the country: Tampa, Orlando, San Antonio, Austin, Columbus, Indianapolis, Charlotte, Nashville and Denver. These 35 metro areas account for nearly one-half of the country’s total population of 330 million. The 4 major regions were relatively evenly balanced: east coast (40M), Midwest (37M), west coast (45M) and sunbelt (43M).
One-half of Americans now live in one of the 35 major metropolitan areas, amounting to 162 million people. That compares with 50 million people in 19 areas in 1950 and 15 million people in 11 areas in 1900. The character of American life has shifted from rural to urban to metropolitan.

https://www.skyscrapercity.com/threads/largest-us-metropolitan-areas-1900-1950.913696/
https://en.wikipedia.org/wiki/Metropolitan_statistical_area
Greatly Increased Diversity

https://en.wikipedia.org/wiki/Historical_racial_and_ethnic_demographics_of_the_United_States
https://www.npr.org/2021/08/13/1014710483/2020-census-data-us-race-ethnicity-diversity
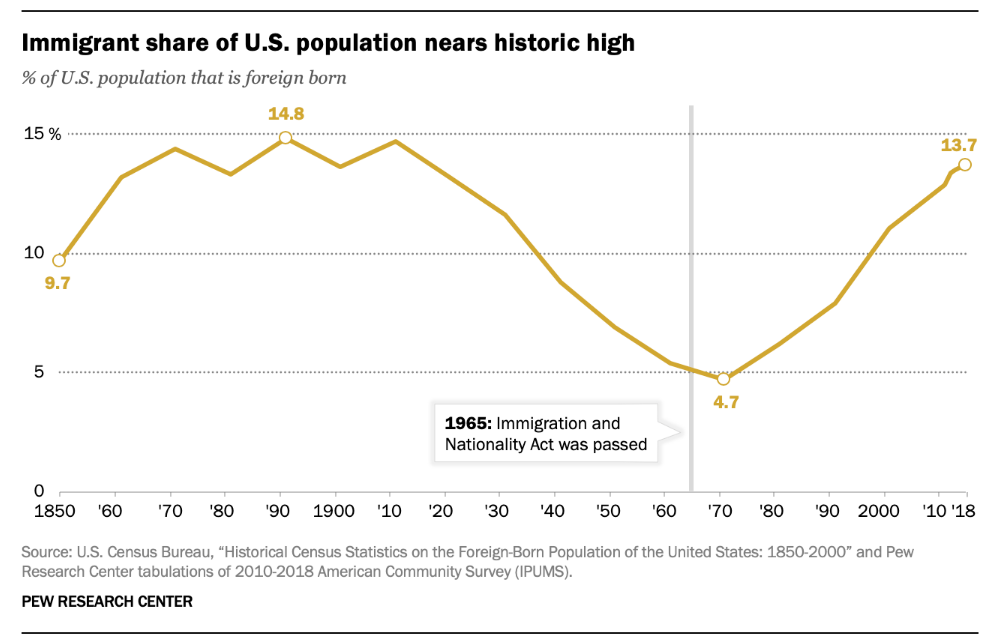
The White, non-Hispanic population has typically been 80-89% of the total. It has fallen rapidly to 58% as Hispanic, Asian and multi-race claimers have increased their shares of the population.
Amazing Real Economic Growth
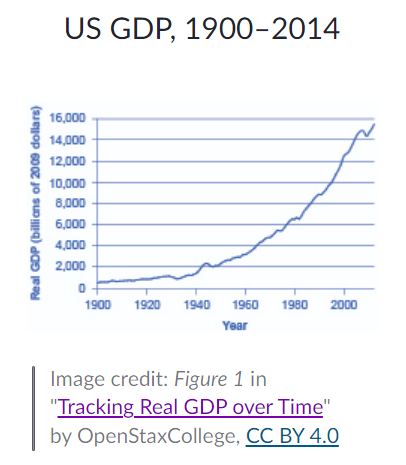
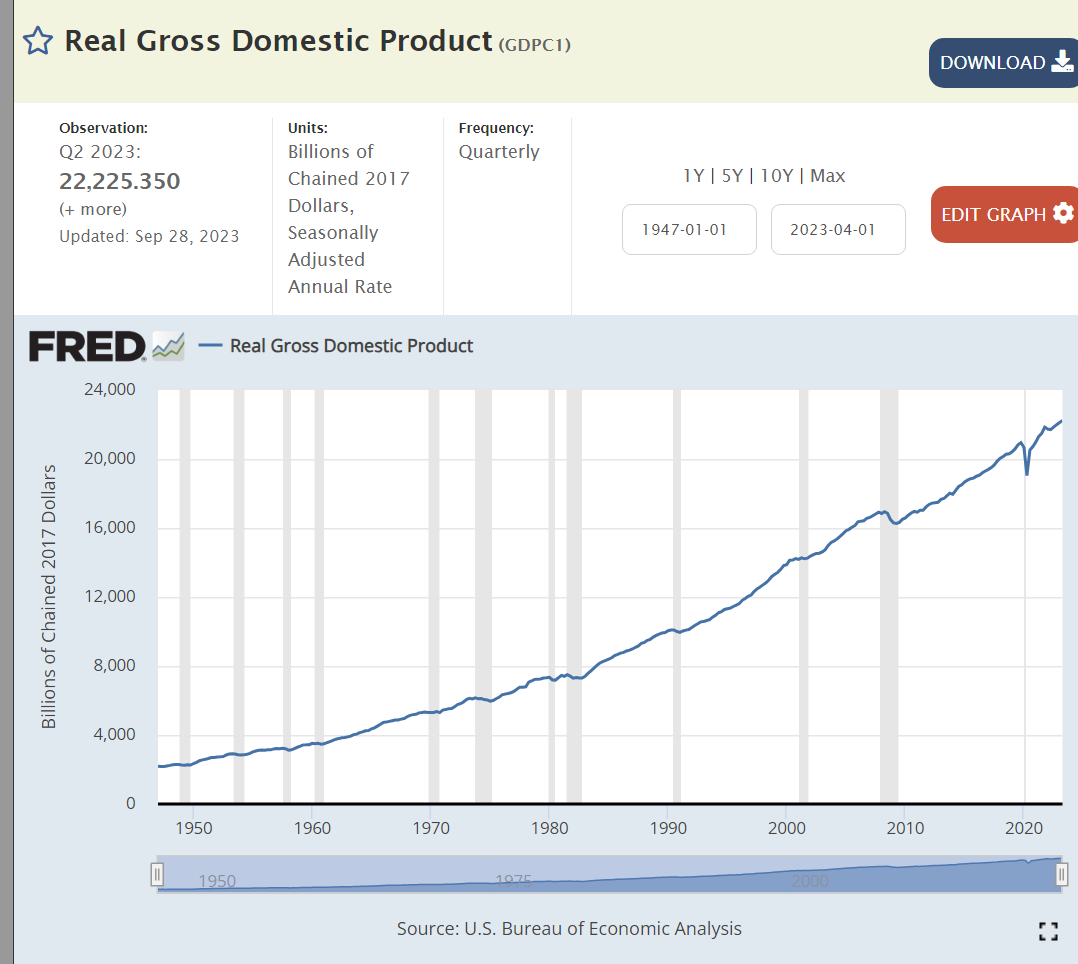
The growth in the size of the US Gross Domestic Product (GDP), the value of goods and services produced in the country, from 1776 to today is essentially incomprehensible at 19,000 times its original size. The population has grown 132-fold, from 2.5M to 330M. Real, inflation-adjusted GDP per person has averaged 2.0% per year across long periods of time. Due to compounding, this 2% becomes 2.7 times in 50 years, 7.25 times in 100 years, 52.5 times in 200 years and 141 times in 250 years.
https://fred.stlouisfed.org/series/GDPC1


Ag and Manufacturing Down, Services Up

Post-War Growth of Large Corporations
In 1955 the 11 corporations at the middle of the newly created Fortune 500 listing averaged $123 million of annual revenue. Adjusting for inflation (GDP deflator), they would have revenues of $939 million today. Comparable revenues in the latest Fortune 500 listing are $15.6 billion, a 16.6X increase.
https://money.cnn.com/magazines/fortune/fortune500_archive/snapshots/1984/3574.html
https://www.50pros.com/fortune500
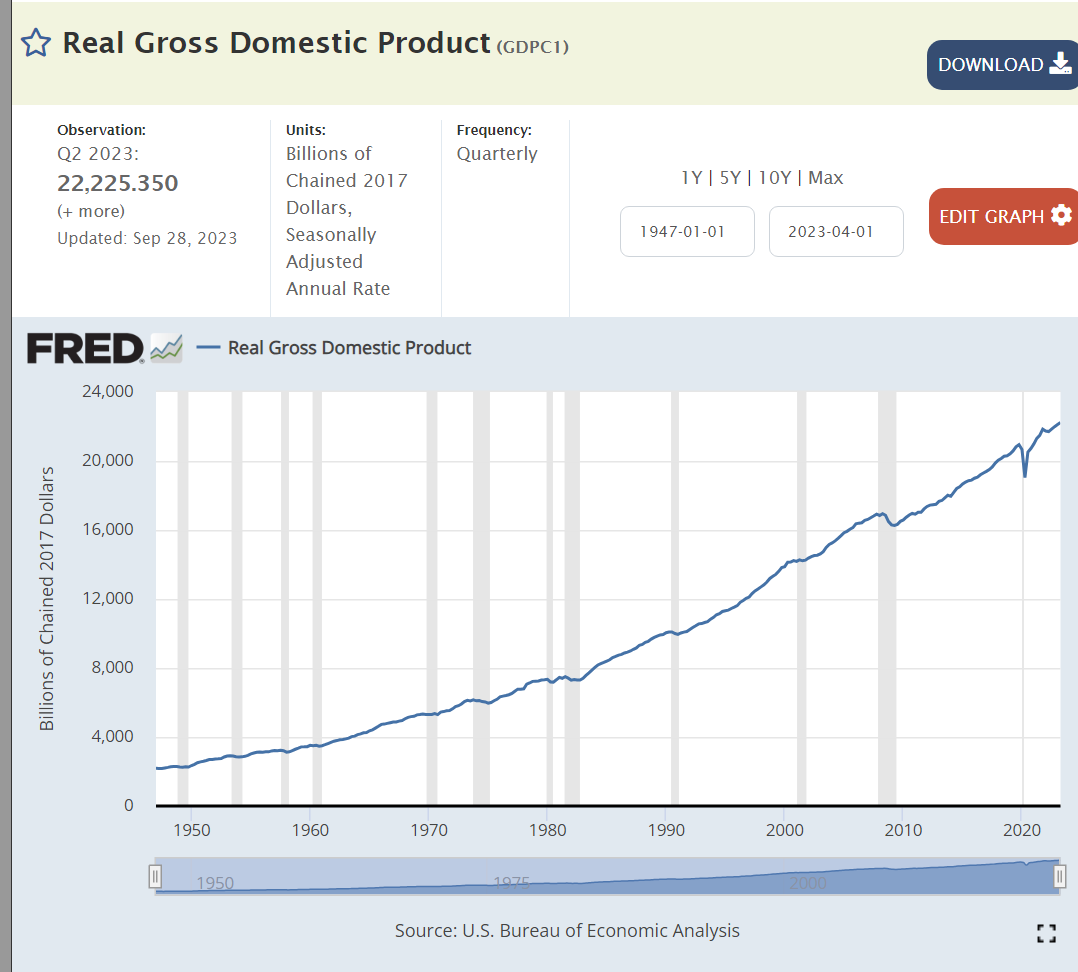
Over this same period total national real GDP has increased from $3.1 trillion to $21.8 trillion; 7.1 times as large. Large US-based corporations have grown twice as fast as real US GDP.
Summary
Small annual percentage changes add up to become transformations through time.
We see this in population, race, immigration, occupations, industries, urbanization, productivity, output and concentration of businesses.
The population and production scale, complexity, trade, product innovation and diversity of the US is beyond any expectations of the founders of the country. The country and its social, political and economic institutions have survived and adapted to allow the country to thrive for almost 250 years. Further adaptations may be needed to support such continued growth and success.

[…] Really Big Changes in the USA: 1776 – 2026 […]
[…] Good News: US is Leading the Global Recovery Personal Value Creation and Capture Really Big Changes in the USA: 1776 – 2026 Statistical Illiteracy and Logical Fallacy Good News: Real Mortage Rates Are 2% […]
[…] Really Big Changes in the USA: 1776 – 2026 […]