In 2022, 34% of those aged 25+ in the US had completed bachelor’s degrees. Indiana lagged the national average at 30%. Nearby Kentucky (28%), Ohio (32%), Michigan (32%) and Illinois (38%) were near the national average. Nine east coast states (VT, NJ, CT, NH, NY, VA, DC, MD and MA) plus CO and WA exceeded 44%.
The Census Bureau provided a nice interactive map to display county level data from the American Community Survey for 2015-19. They used 40% as the cut-off for the very highest educated counties.
Focusing on Indiana and its 4 adjacent states, there were just 15 counties with 40%+ bachelor’s degree completion rates among the 485 counties (3%). Hamilton County was in first place at 56%, tied with suburban Detroit’s Washtenaw County. Columbus suburb Delaware County was in third place at 54%. Suburban Chicago’s DuPage County and Indy’s Boone County tied for fourth place at 49%. Detroit’s Oakland County (47%) claimed sixth place, while Indiana’s Monroe County (46%) snagged seventh place. Franklin and Warren counties in Ohio, Leelanau County in Michigan, Champaign, McLean and Lake counties in Illinois, and Oldham and Fayette counties in Kentucky earned honorable mention.
Hamilton County ranked in 16th place overall (99.5 percentile) among all 3,100 counties nationally.
Of the top 20 counties, 5 had populations below 25,000. The greater DC/Baltimore area claimed 7 of the top spots: Arlington, Alexandria, Howard, Fairfax, Loudon, Montgomery and DC. Denver suburban Boulder and Douglas counties won two places. New York and San Francisco placed in the top 20. Marin, CA, Williamson, TN and Orange, NC claimed the other 3 top spots.
Hamilton County is in very fine company. It’s bachelor’s degree percentage increased from 56% in the 2015-19 average to 61% in the 2017-21 average.
Hamilton County municipalities, townships and districts had $2.3 billion dollars of debt outstanding at the end of 2022. That amounts to $6,300 per resident. Carmel entities accounted for $1.05 billion, or $10,300 per resident. The other 8 townships owed $1.26 billion, or $4,800 per resident. The other 91 Indiana counties’ 6.5 million citizens owed $30.5 billion, or $4,700 per resident.
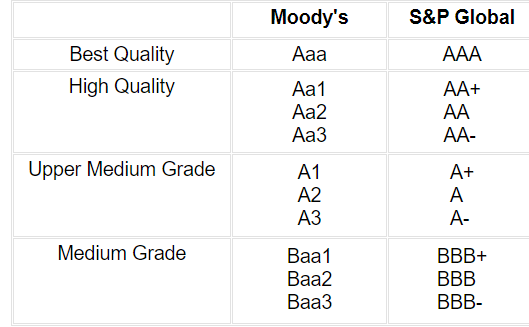
Municipalities have significantly less resources and taxing authority than states. Hence their bond ratings are lower. 16 states have AAA ratings, 9 have AA+, 5 AA-, 15 AA and 5 lower ratings.
Hamilton County’s Per Capita Personal Income exceeded $80,000 in 2020.
This ranks above the 97th percentile of the 3,100 U.S. counties.
Hamilton County ranks first in Indiana and would rank first in 30 other states.
Nationally, Hamilton County ranks 42nd among the 600 counties with populations of 100,000+ people. These counties represent 80% of the U.S. population.
Hamilton County’s per capita income is 72% higher than the median county ($46,600) in the U.S.
One of the “control centers” at MISO Energy in Hamilton County.
Hamilton County’s unemployment rate has averaged 3.1% since 1990, a little more than one-half of the nation’s 5.8% average. The Indy metro area has averaged 4.6%. In the last decade, Hamilton County has still averaged 2.0% lower than the national average of 5.3%.
The US population has grown from 2.5 million in 1776 to 76.3 million in 1900 to 158.8 million in 1950 to 329.5 million in 2020. More than a 100-fold increase, 2+ orders of magnitude.
28 individual metro areas today EACH have a population (2020) equal to or greater than the WHOLE USA in 1776. Pittsburgh, Portland, San Antonio, Austin and Sacramento each have the same 2.5 million residents. Charlotte, Orlando, Baltimore and St. Louis each have a slightly greater 2.8 million citizens. 19 other metro areas today have a significantly larger population.
Declining Rural Population
The US began as 100% rural. By 1900, cities (2,500+) accounted for 40% of the total population. By 1950, city populations were the majority at 60%. In 2020, cities contained 80% of the US population.
Urbanization
In 1776, the US had 5 cities of 10,000 people, led by Philadelphia with 30,000.
By 1900 the nation had 11 major cities with a half-million people or more, led by New York with 5 million and Chicago, Philadelphia and Boston near 2 million. Baltimore on the east coast and San Francisco on the west coast were joined by the Midwest cities of Pittsburgh, St. Louis, Cleveland, Cincinnati and Buffalo to round out this group of early leaders. These 11 exceptions to the still largely rural landscape accounted for one-half of the urban population, 20% of the national population.
By 1950 there were 15 metro areas with a million people or more, up from just 5 in 1900. San Francisco, St. Louis, Cleveland, Baltimore and Buffalo exceeded 1 million as did newcomers to the major city list: Los Angeles (4.4M), Detroit (3.0M), DC, Seattle and Dallas-Ft. Worth. Kansas City, Minneapolis-St. Paul and Houston joined Cincinnati as “major cities” defined as greater than 750K residents. These 19 metro areas contained 50 million people, 31% of the nation’s total and a little more than half of all urban residents. Led by New York’s 13M, the east coast metros totaled 22 million people. Led by Chicago’s 5M, the Midwest metros were close behind with 18 million people. The 3 west coast cities combined for 8 million while the Sunbelt’s 3 cities amounted to just 2.5 million people.
For 2020, we use 2 million as the minimum size for a major metropolitan area. New York (20M), Los Angeles (12M) and Chicago (9M) led the way. Dallas-Fort Worth, Houston, Washington, DC, Philadelphia, Atlanta and Miami all had at least 5 million citizens. 15 new metro areas joined the list, beginning with 6 on the west coast: Phoenix, Riverside-San Bernardino, San Diego, Portland, Sacramento and Las Vegas. The others are widely distributed across the country: Tampa, Orlando, San Antonio, Austin, Columbus, Indianapolis, Charlotte, Nashville and Denver. These 35 metro areas account for nearly one-half of the country’s total population of 330 million. The 4 major regions were relatively evenly balanced: east coast (40M), Midwest (37M), west coast (45M) and sunbelt (43M).
One-half of Americans now live in one of the 35 major metropolitan areas, amounting to 162 million people. That compares with 50 million people in 19 areas in 1950 and 15 million people in 11 areas in 1900. The character of American life has shifted from rural to urban to metropolitan.
The White, non-Hispanic population has typically been 80-89% of the total. It has fallen rapidly to 58% as Hispanic, Asian and multi-race claimers have increased their shares of the population.
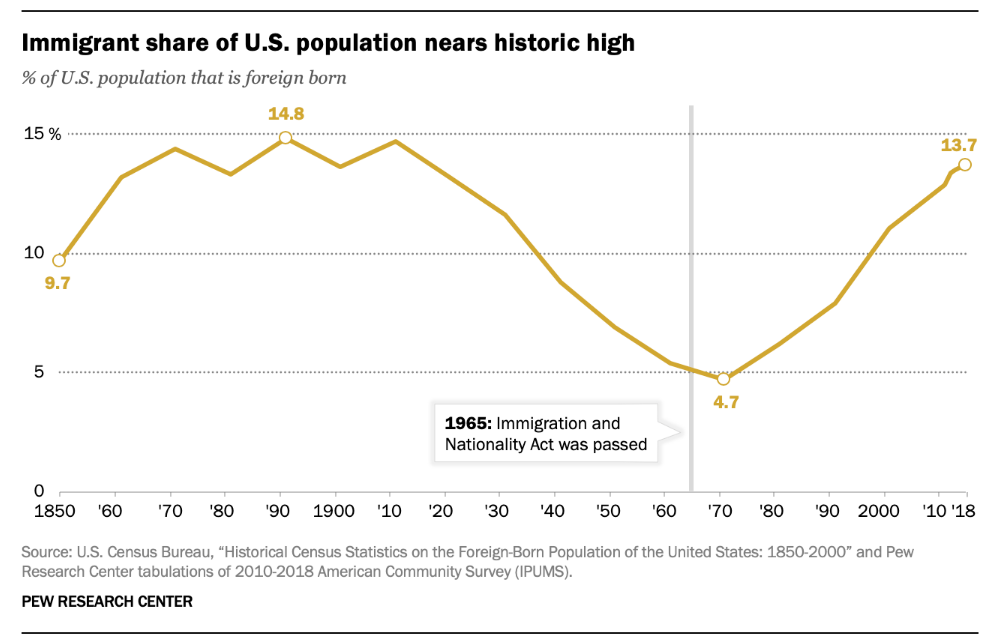
The share of immigrants reached a high of 15% from 1870-1910, dropped to 5% in 1960-1970 before reclimbing back to 15% recently.
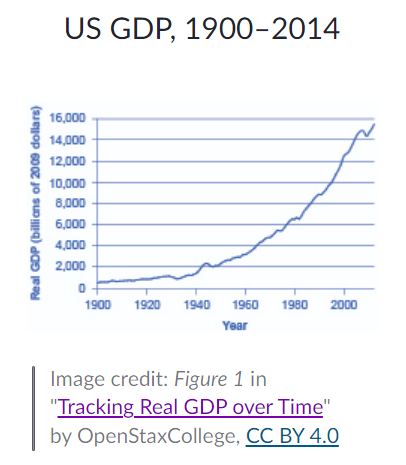
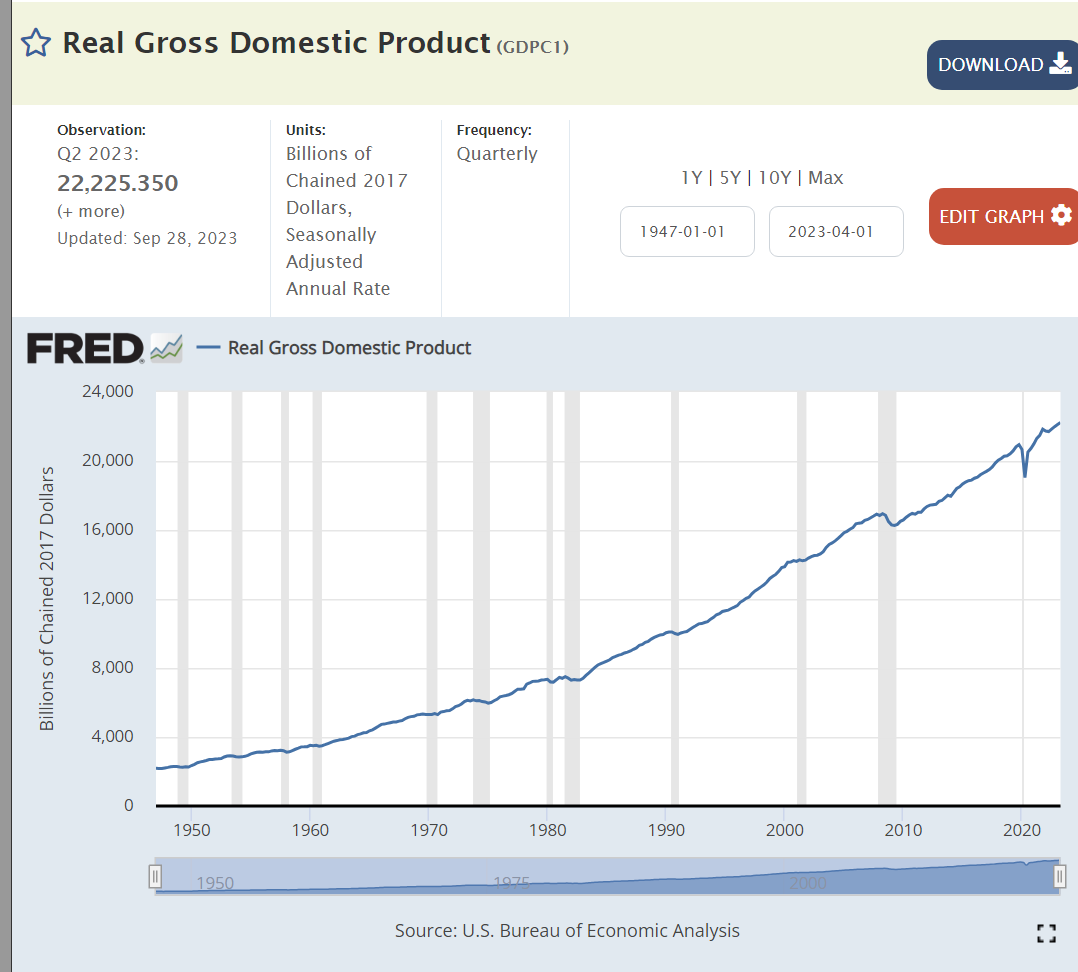
Amazing Real Economic Growth
The growth in the size of the US Gross Domestic Product (GDP), the value of goods and services produced in the country, from 1776 to today is essentially incomprehensible at 19,000 times its original size. The population has grown 132-fold, from 2.5M to 330M. Real, inflation-adjusted GDP per person has averaged 2.0% per year across long periods of time. Due to compounding, this 2% becomes 2.7 times in 50 years, 7.25 times in 100 years, 52.5 times in 200 years and 141 times in 250 years.
In 1955 the 11 corporations at the middle of the newly created Fortune 500 listing averaged $123 million of annual revenue. Adjusting for inflation (GDP deflator), they would have revenues of $939 million today. Comparable revenues in the latest Fortune 500 listing are $15.6 billion, a 16.6X increase.
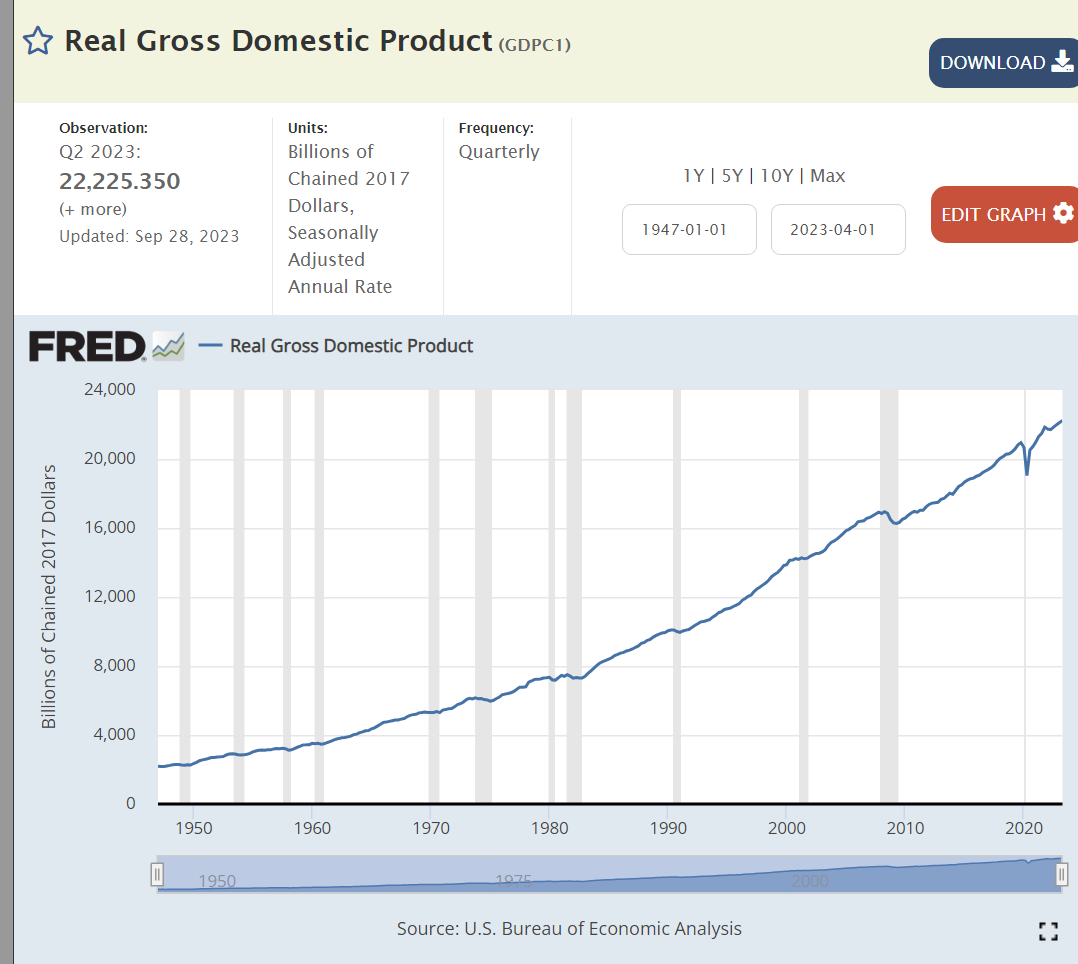
Over this same period total national real GDP has increased from $3.1 trillion to $21.8 trillion; 7.1 times as large. Large US-based corporations have grown twice as fast as real US GDP.
Summary
Small annual percentage changes add up to become transformations through time.
We see this in population, race, immigration, occupations, industries, urbanization, productivity, output and concentration of businesses.
The population and production scale, complexity, trade, product innovation and diversity of the US is beyond any expectations of the founders of the country. The country and its social, political and economic institutions have survived and adapted to allow the country to thrive for almost 250 years. Further adaptations may be needed to support such continued growth and success.
The United States’ political founders understood the nature of man and the risks of direct democracy (rule of the mob). They designed a system of “checks and balances” to ensure that a system of representative government would not aggregate power at the center or allow the whims of the majority or any minority to be served.
Yet today we live in a time where the “cult of individualism” rules. Senators are directly elected, not by state legislatures. National political candidates are chosen by popular vote in primaries, with limited political party filtering or influence. Earmarks are considered “dirty business”, so they cannot be used to influence the votes of individual legislators. Representatives and candidates create individual brands and raise funds independent of political parties. A majority of political districts at the state and national levels are gerrymandered to ensure that incumbents are re-elected without credible opponents in the general election. There are effectively no limits to political fundraising by individual candidates. Only a small share of highly motivated, largely extremist individuals vote in the primaries where most elections are won.
As a result, we have either partisan monopolies or polarized governments. Almost 80% of states endure one party rule.
The Senate Does Not Advocate for the Whole or the Center Today
The US Senate was intended to play the role of offsetting or delaying the demands of popular government in the House of Representatives. The House could propose and the cozy, experienced, independent Senate could “dispose” of legislation. In our current polarized system, with disproportionate representation to rural and Republican leaning states, the Senate is as politicized as the House. Bipartisanship is rare. Seeking the public good is rare. Fighting to win for your party is the only goal.
Any number of reforms could make the Senate more effective in serving its intended function. Campaign financing reform. More senators for very high population states. Increased rules and committee power for the minority party. A 60-vote filibuster rule with time limits.
A Solution: A Council of Advisors
Congress should create a “Council of Advisors” to advocate for the country as a whole, highlighting representatives and legislation that are supported by a significant majority of the country rather than by one political party or the other.
Former governors or US Senators could choose to run in a biannual referendum where they would be required to earn 60% of the popular vote in order to be appointed to a single 10-year term as an advisor, elder or guardian. The body would have a minimum of 10 and a maximum of 30 members. The body would be qualified to offer opinions only when each of the two major parties had at least one-third of the representatives.
The Council of Advisors would have two functions. First, it would consider whether Senators who are seeking re-election have “generally acted on behalf of the American public in a bipartisan fashion during their last term of office”. Senators who earned 60% of the vote of the Council of Advisors who be designated as “approved” by the Council. Others would not have this seal of approval.
Second, the Senate could refer any single bill to this body each month and seek its approval as “generally supported by the American people as a whole” on the basis of a 60% affirmative vote.
The Council would be a solely advisory body. It would be composed of individuals who were approved by the people as representing the country as a whole. It would have moral authority to make judgments about Senators and legislation. This moral authority would help to pressure both parties to produce legislation that serves the majority of the public and that is supported by the majority of the public. In essence, it would be a counterweight to the many pressures for polarization and “winner take all” politics that is practiced today.
I believe that we have unintentionally arrived at the current state of affairs where political pandering to the lowest common denominator drives our political decisions. There ARE important political judgments that cannot be compromised in the long run. But most of our political issues do NOT require a one side wins and the other side loses result. Our elected officials are intended to represent our views and to provide results. Political results that involve creative solutions, imperfect processes and administration (sausage making), negotiations and compromise. Every for profit and not-for-profit organization lives by these same rules. They have owners, customers, employees and stakeholders with competing claims. Yet, the organization’s leaders must produce acceptable results and be held accountable. We need to have these same expectations and processes for elected officials.
Just as a president or CEO is faced with the judgment of a board of directors, our US Senators need to have a Council of Advisors review their performance.
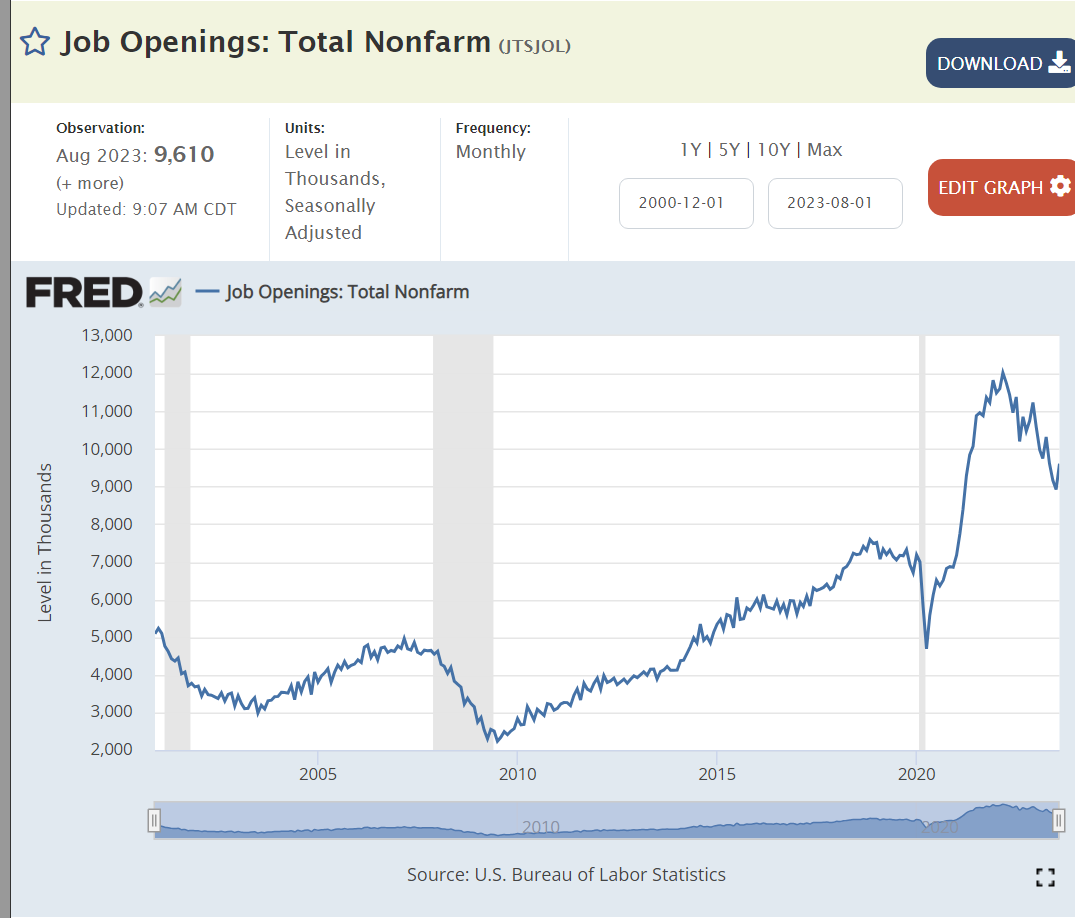
The stock market overreacted today. Job openings increased by 700,000 between July and August. Oh no! The labor market is too strong! Wages will increase! Cost-push inflation will build. The Fed will increase interest rates. We’ll be in recession soon! Boo!
Job openings are clearly falling. From an all-time high of 11.5 million to about 9.5 million in 18 months. With another 18 months of a “cooling” labor market, there will still be an historically high 8 million open positions in February, 2025. The labor market is slowly returning to “normal” after the Pandemic disruption.
This is a solid labor market, not an overheated labor market. Real wages finally grew during 2016-2020, by 7%. They spiked during the pandemic but have been flat for the last 18 months.
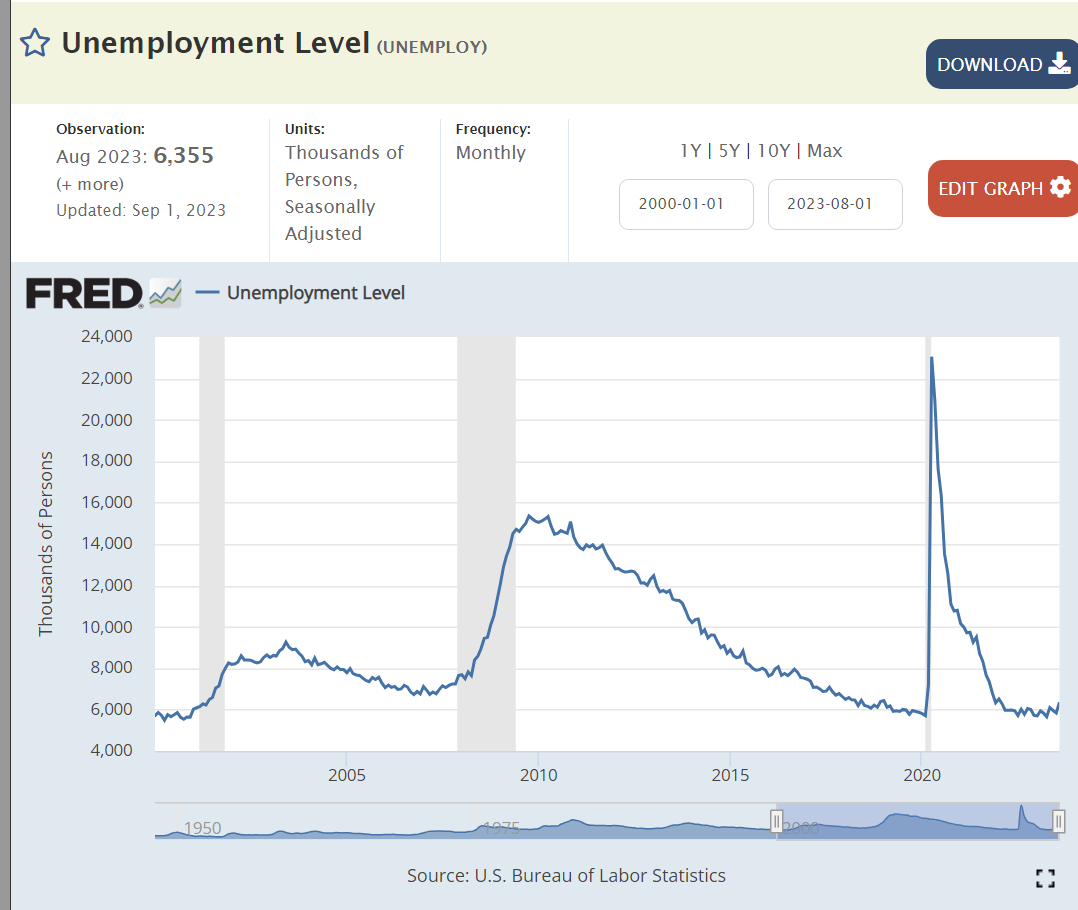
The number of unemployed people remains at 6 million, low by history, but not declining to unsustainable levels. 6 million is better than 8 or 15 or 23 million.
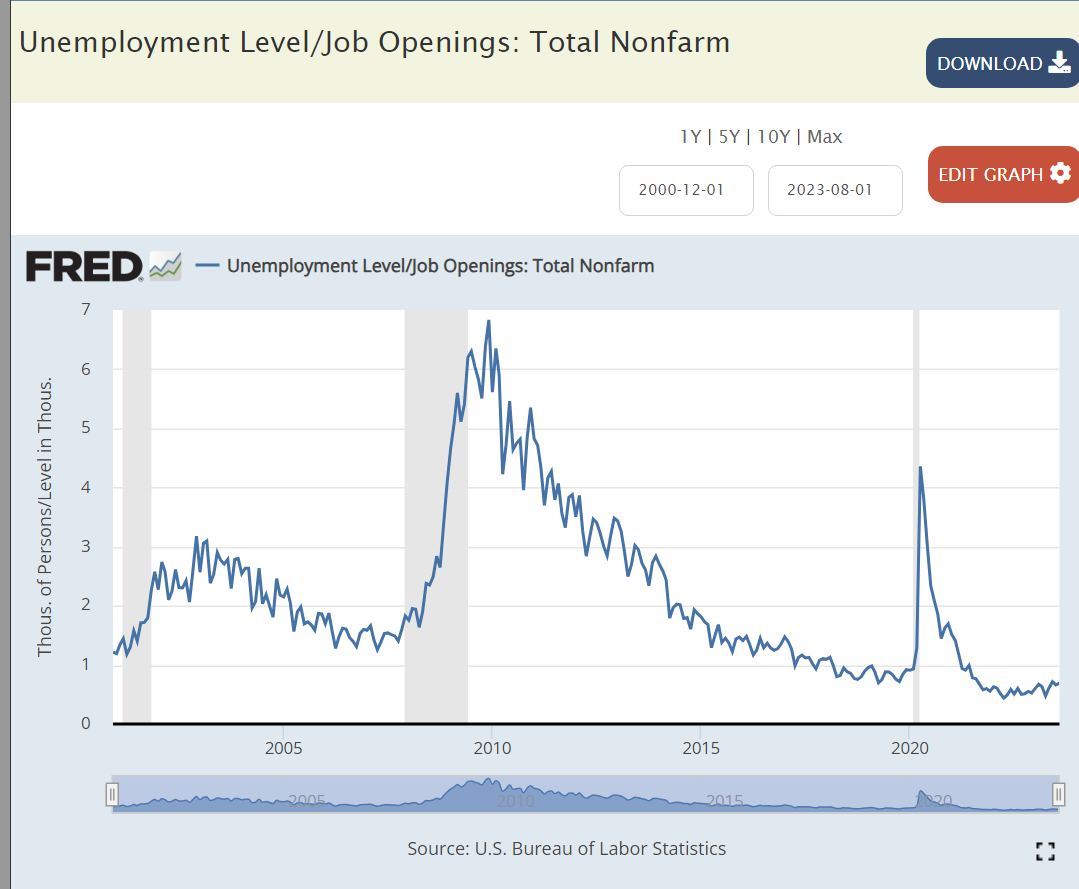
It’s a great time to be a job seeker, 3 jobs for every 2 job seekers. This is an historically positive ratio. It has been maintained for 2 years.
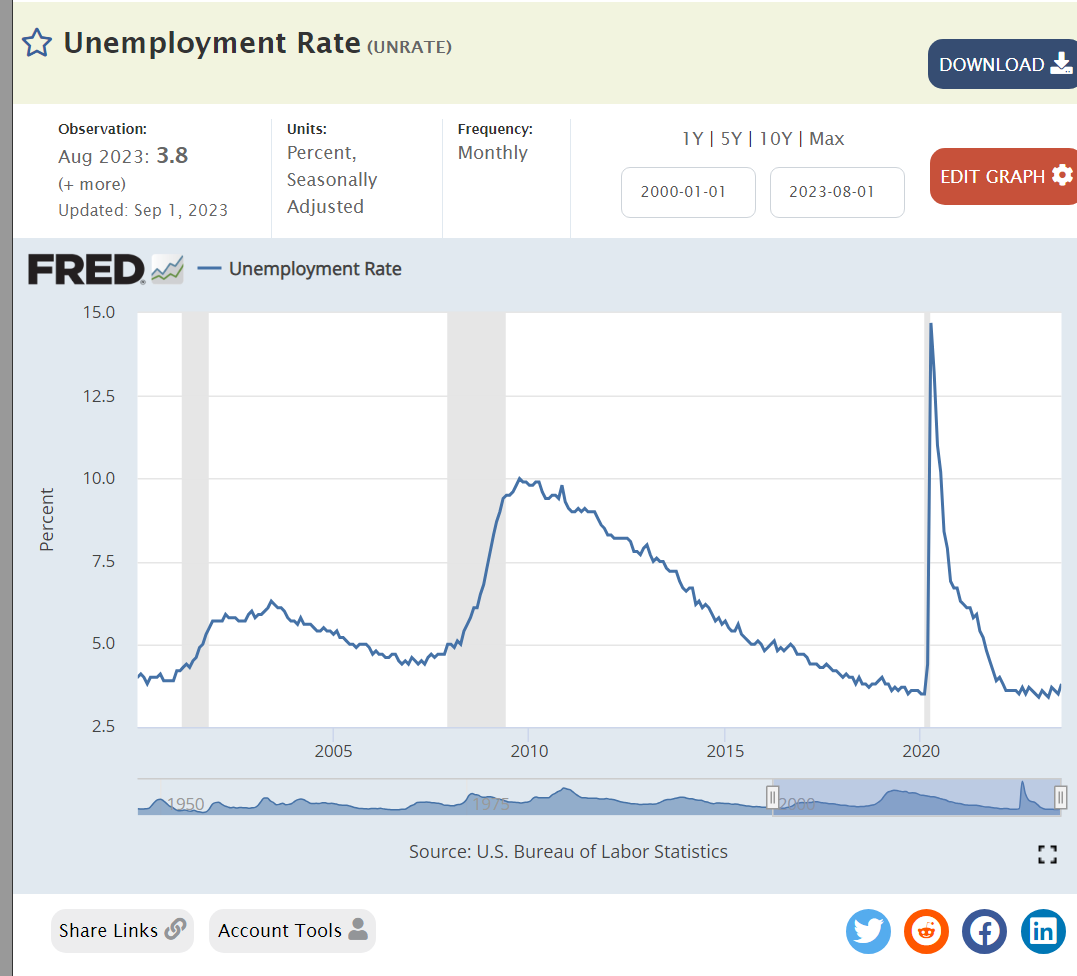
The unemployment rate remains at an historical low of 3.5% but is not falling.
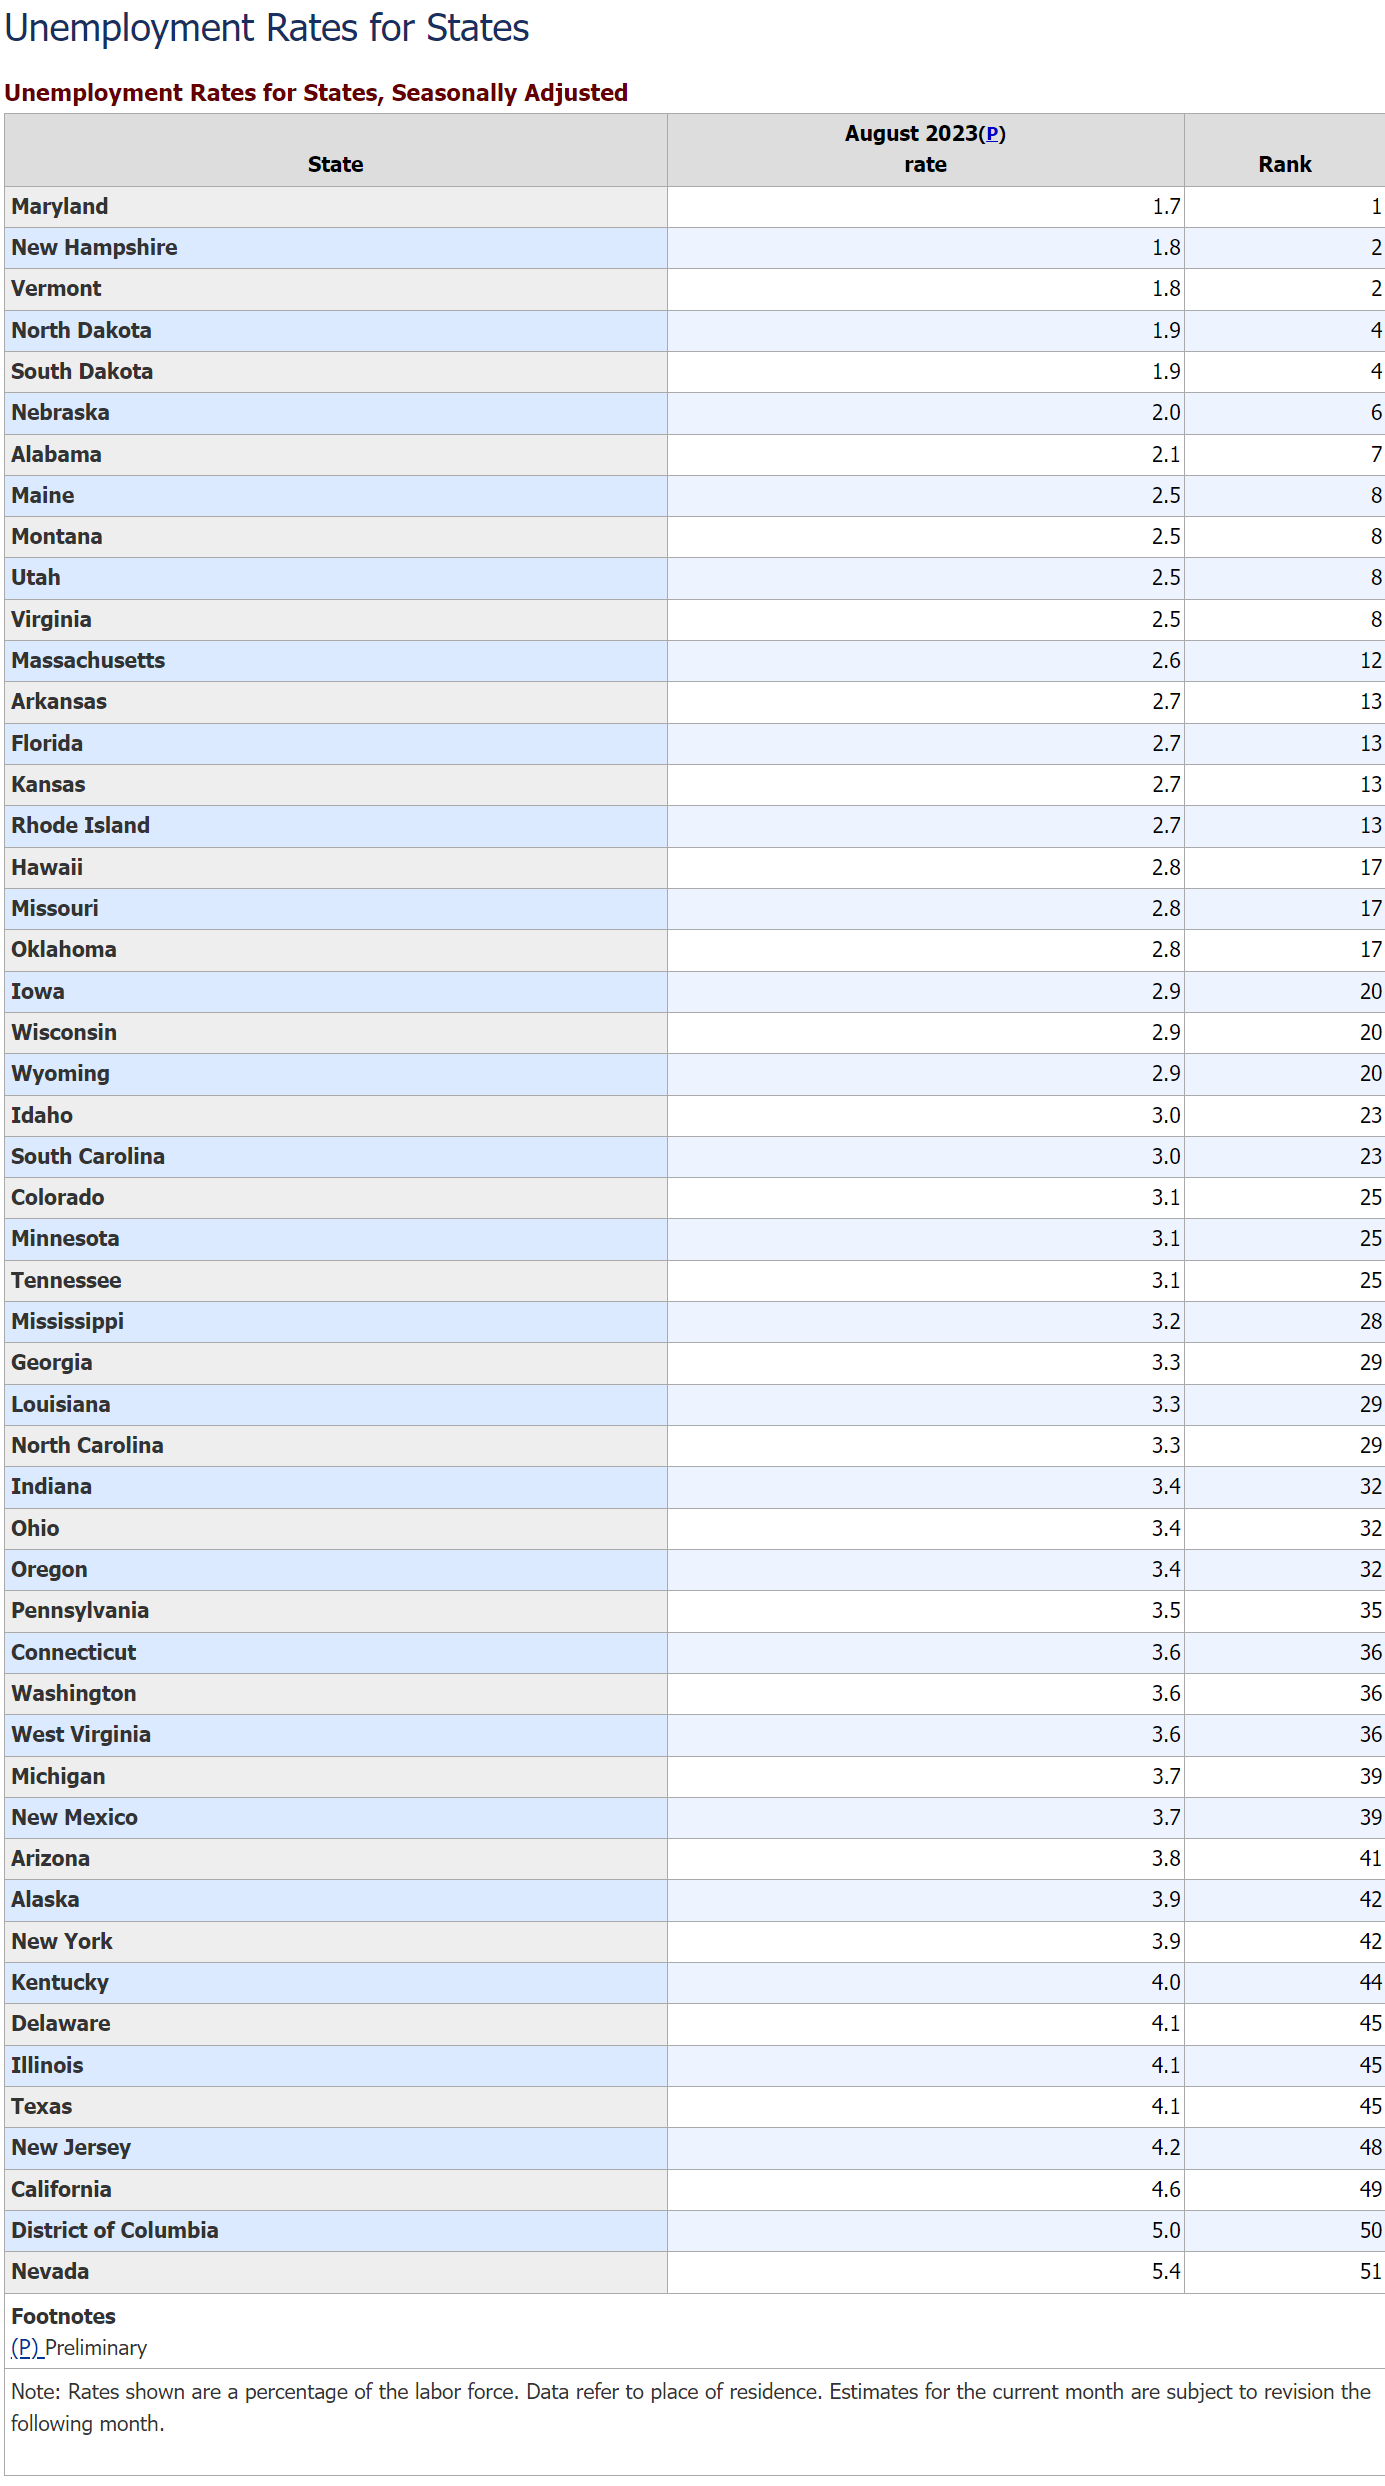
Low unemployment is a widespread phenomenon. 22 states are below 3%. Only California, Nevada and DC are above 4.1%.
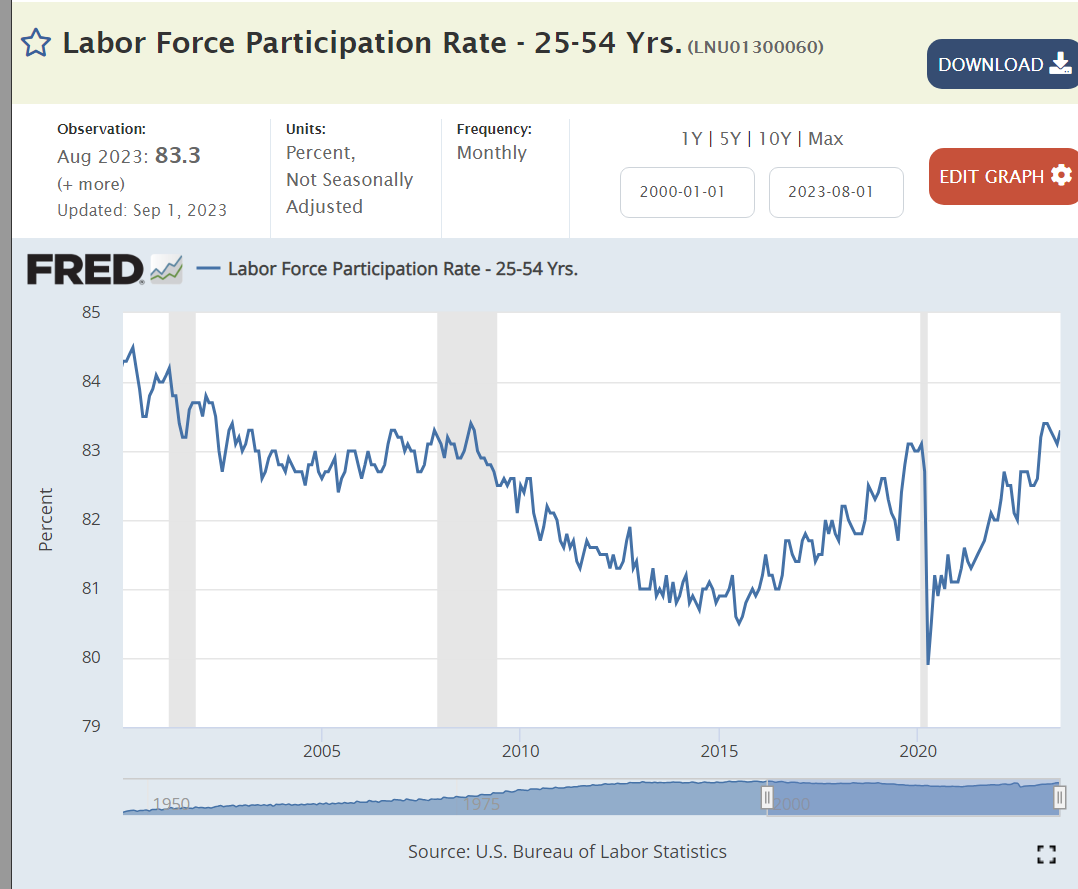
The labor force participation rate is at a 15 year high, with positive hiring and wage conditions attracting greater participation.
The quit rate remains above the pre-pandemic high, indicating that employees still see a positive labor market, but not an exploding market.
Total employment was flat for the first 11 years of the new millennium, parked at 132 million. Job growth accelerated for the next 8- and one-half years, adding a very solid 20 million new jobs. Post-pandemic, the economy has added another 4 million jobs.
Summary
This remains a Goldilocks labor market, neither too weak nor too strong. The Millennium pause, Great Recession and Pandemic have made us gun-shy. We don’t want to claim victory for fear of disturbing the labor market gods. But we are enjoying victory. 156 million employed versus 132 million employed a dozen years ago. An 18% increase.
Hamilton County serves as a resource for central Indiana, offering entertainment and community building options for everyone. It promotes 70 festivals and events across the year. It hosts 10 farm markets. It provides 100 ticketed and 100 community concerts each year.