The national average for municipal and state offices is reported at about 32%. Hamilton County elects 25% more women to office than the national average.
Indiana ranks below average on the somewhat inconsistent summary data available. In general, municipal elections are similar to state legislature results.
This source rates neighboring states as follows: Michigan 5th highest, Illinois 14th, Indiana 32nd, Ohio 43rd and Kentucky 47th.
Individual sources point to Indiana (27%), Ohio (29%), Kentucky (30%), Michigan (35%) and Illinois (41%) as the percentage of women office holders. Indiana is relatively low for the Midwest. Hamilton County is relatively high.
Although Democrats have begun to stand up candidates for more offices and have won a small number of races, Hamilton County remains a Republican oriented county. Congresswoman Spartz won 54% and 58% of the vote in her 2 congressional races. Governor Holcomb won 61% in his 2020 re-election victory. President Trump received 52% of the local vote in his losing 2020 effort. US Senator Todd Young won 54% of the vote in his 2022 re-election campaign.
For a Republican leaning county, Hamilton County has a greater than expected share of women office holders. In Congress, women are one-third of Democratic seats and just one-sixth of Republican seats.
Many notable officeholders have set the example for women in leadership in Hamilton County. Patricia Logan and Mary Sue Rowland led Noblesville from 1980-1991. Jane Reiman and Dorothy Hancock led Carmel from 1980-1995.
Hamilton County has been a Republican stalwart. Although women have been underrepresented by Republicans nationally, Hamilton County has elected many more Republican women to office than the overall national average.
Hamilton County residents enjoy the outdoors benefits of the 2,000 acre Geist Reservoir, 1,500 acre Morse Reservoir and 25 miles along the White River.
Hamilton County has redeveloped 20 miles of rail-trails along the Monon Railroad corridor, 100 miles of dedicated trails and 500 miles of designated sidewalks/pathways for bikes and pedestrians.
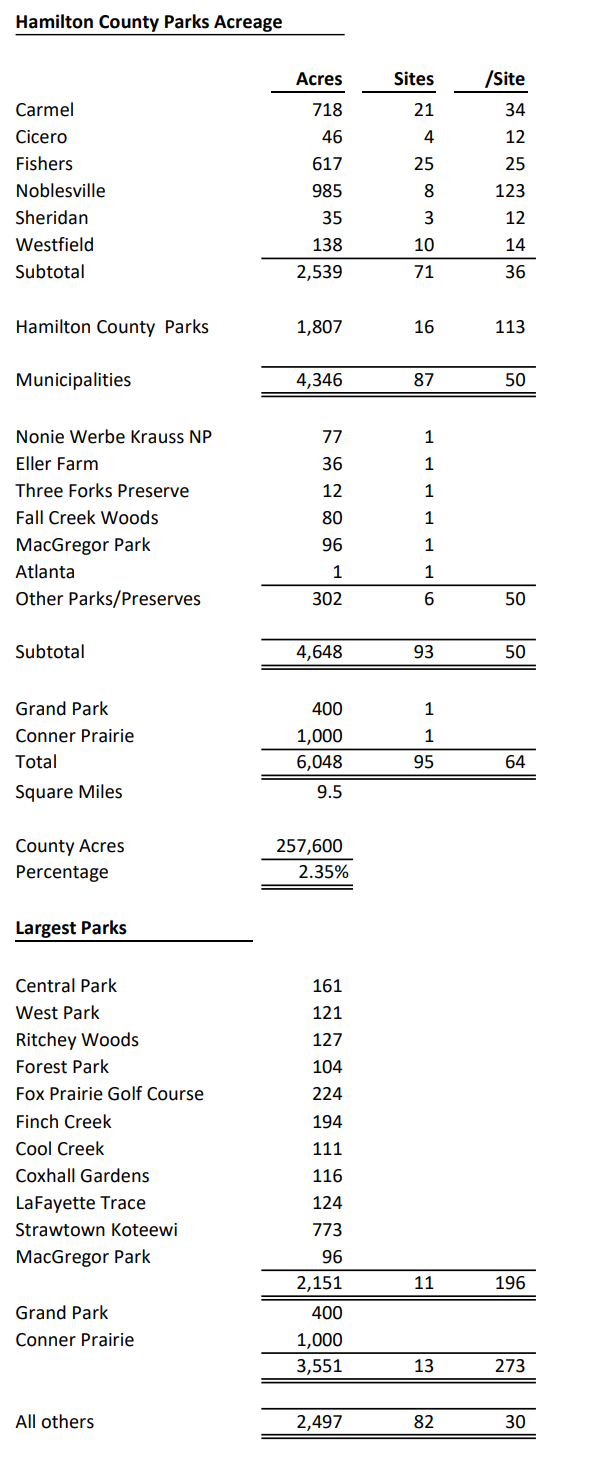
Hamilton County residents enjoy easy access to nearly 10 square miles of parks and nature preserves. Conner Prairie and Grand Park stand out as national/regional assets offering 1,400 acres to youth sports participants and those interested in Midwest history.
Hamilton County punches above its weight for outdoor amenities. Indiana is truly heartland and flatlands, but it is also blessed by water resources, woodlands and history. Waterparks, trails, woods, golf courses, creek stomping, bell towers, fishing, trails, wells, plazas, agriculture, sailing, canoeing, civic centers, wooden bridges, beaches and campgrounds. Yeah, we’ve got you covered.
Hamilton County offers 28 hiking trails of one mile or longer. The 3 major rail-trails: Monon, Nickle Plate and Midland Trace, combined with the Strawtown Koteewie Park trails account for 46 of the county’s 100+ miles of major trails.
When shorter trails and neighborhood roads and pathways are included, the county offers 500 miles of trails for hikers and cyclists!
In general, Hamilton County’s costs are similar to those of the Indy metro area. It’s 357,000 residents account for just 17% (1 in 6) of the formal Indy metro area’s 2,075,000.
Solid county level data is not available for all areas, but limited comparisons helped to identify goods and services that might differ between Hamilton County and the Indy average.
Hamilton County’s housing is 8% more expensive than the national average rather than 15-17% lower as seen in metro Indianapolis. The housing stock is also newer, larger and higher quality. The full housing price difference would increase the total cost of living measure by 7%. Considering one-half being due to age/quality and one-half due to prices adds 3.5% to 93.1% to yield a revised 96.6% cost of living ratio.
Indiana local taxes average 9.3% of income versus 10.2% nationally. This 10% savings on a 10% cost factor reduces the overall cost of living measure back down to 95.6%. State sales and income taxes do not vary by county. Hamilton County’s property and income taxes are lower than its large population peer group in Indiana.
Food Prices
Historically, Indianapolis has been a competitive grocery market. Kroger has a leading market share. Cub Foods and Marsh have left the market, but Meijer’s, Trader Joe’s, Whole Foods, Fresh Thyme, Fresh Market and Market District now compete with the others.
Hamilton County’s retail sales per capita figure is 14% above the national average, despite the very high concentration of retail stores in Marion County along 82nd/86th Street. The county is well served by retailers of all kinds.
Food away from home makes up almost 5% of the consumer price index. No restaurant food index is publicly available. However, the Big Mac price in Hamilton County is $4.59 versus the $4.39 national average price, a 5% premium. If this applied to all restaurant prices, the overall cost of living index would be 0.3 higher, 95.9. The average Indiana Big Mac price was just $4.11.
The Economic Policy Institute provides “modest income” food prices that are 19% higher in Hamilton County than in Marion County. Given the proximity of the counties and the long-standing coverage of “food deserts” in Indianapolis contrasted with nearly none in Hamilton County, this indicator is suspect.
Hamilton County has 1.8 hospital beds compared with the national average of 1.9 and the Indiana average of 3.3. It has 1.5 primary care physicians versus 1.0 nationally and 1.3 in Indiana. 10% of Hamilton County households have medical bills in collections compared with 17% nationally and 19% in Indiana. Access to health care is adequate.
The Best Places website uses a simple index of a standard hospital bed night, a doctor’s visit and a dentist’s visit indicating that Hamilton County health care costs are equal to the national average (100).
A Rand Corporation study indicates that Indy metro hospital rates are 25% higher than the national average. This is driving Indiana statehouse political battles with claims and counterclaims. Professional services fees were 25% below the national average.
Although health care is as much as 18% of GDP in the US, the share in the consumer price index is only 5%. If Hamilton County consumer costs are the same as the nation, this would increase the cost-of-living index by 0.6 points to 96.5.
Utilities
Best Places pegs Hamilton County’s utility costs at 93 rather than 107.
Indiana natural gas prices are more than 20% below the 50 state median.
Local utilities are probably at least 10% lower than in the summary statistics, so the COL index should be reduced by 0.9 points based on their share of spending, reducing the index to 95.6.
Transportation
Indiana used car prices are the lowest in the nation, 11% below the average.
The Economic Policy Institute and Indiana Family and Social Services Administration indicate that Hamilton County childcare costs are 13% higher than in Marion. Because childcare accounts for just 0.6% of spending, no adjustment is indicated.
Summary: Hamilton County Costs are 4% Lower than the National Average
County level housing, health care and grocery costs added more than 4% while lower taxes and utility costs subtracted almost 2% for a final score of 95.6, more than 4% below the national average.
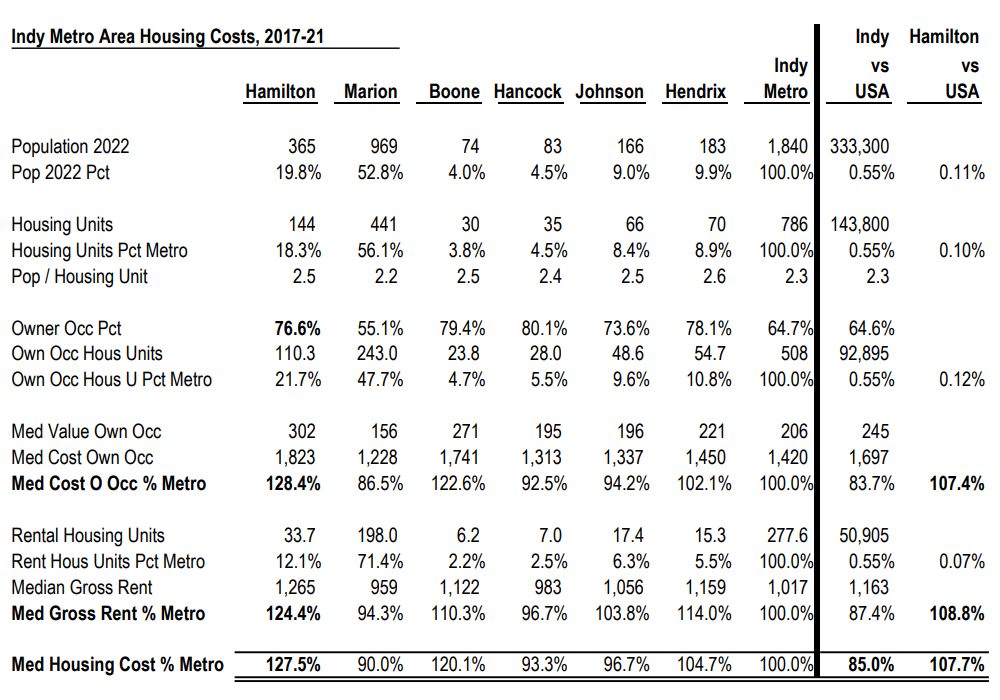
The US Census Bureau’s American Community Survey (ACS) is the best publicly available data source for housing data at the county level. The most recent survey covers 2017-21.
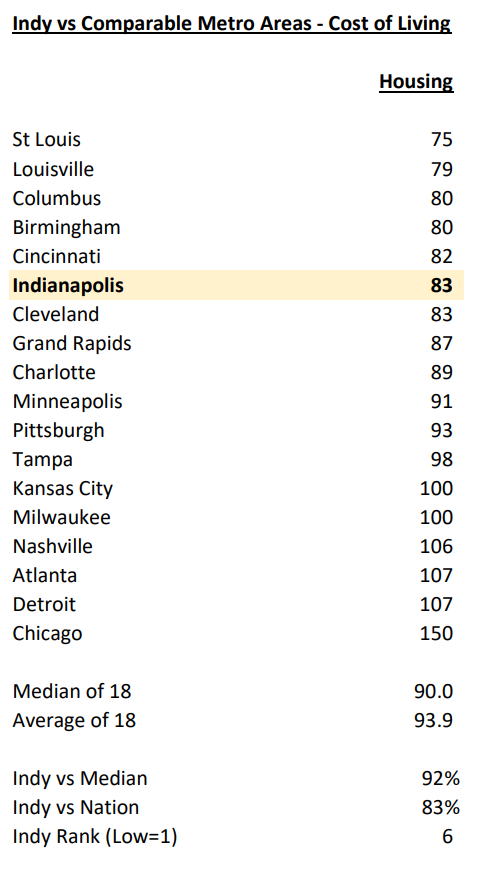
The metro Indy area’s housing costs are just 85% of the national average. Hamilton County’s housing costs are 28% higher than the metro average, but only 8% higher than the national average.
Hamilton County’s 40th percentile rent for this period is $1,265, 24% higher than the metro area. The median monthly cost for a homeowner with a mortgage is $1,823, 28% higher than the metro area.
77% of Hamilton County residents own their homes versus 65% in the metro area and in the national average. Hamilton County contains 22% of the owner-occupied homes (110,000) and 12% of the rental units in the metro area (34,000).
The Economic Policy Institute estimates the cost of modest housing in Hamilton County to be 32% above Marion County, less than the 41% indicated by the 128% to 90% ratios to the nation.
The Washington Post reports rental data by county through June, 2023. This also shows a 27% premium between Hamilton County and the weighted average for the 6 main Indy metro counties.
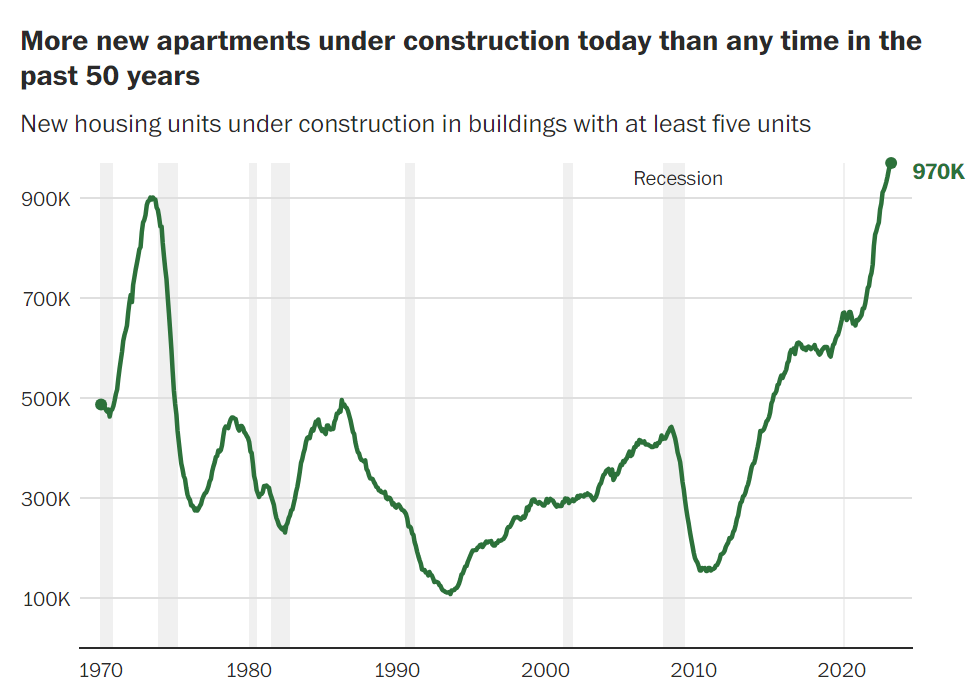
Hamilton County total housing starts have doubled between 2019 and 2022, not as fast as the national average for apartment units, but fast enough to have a cooling impact on rising rental prices.
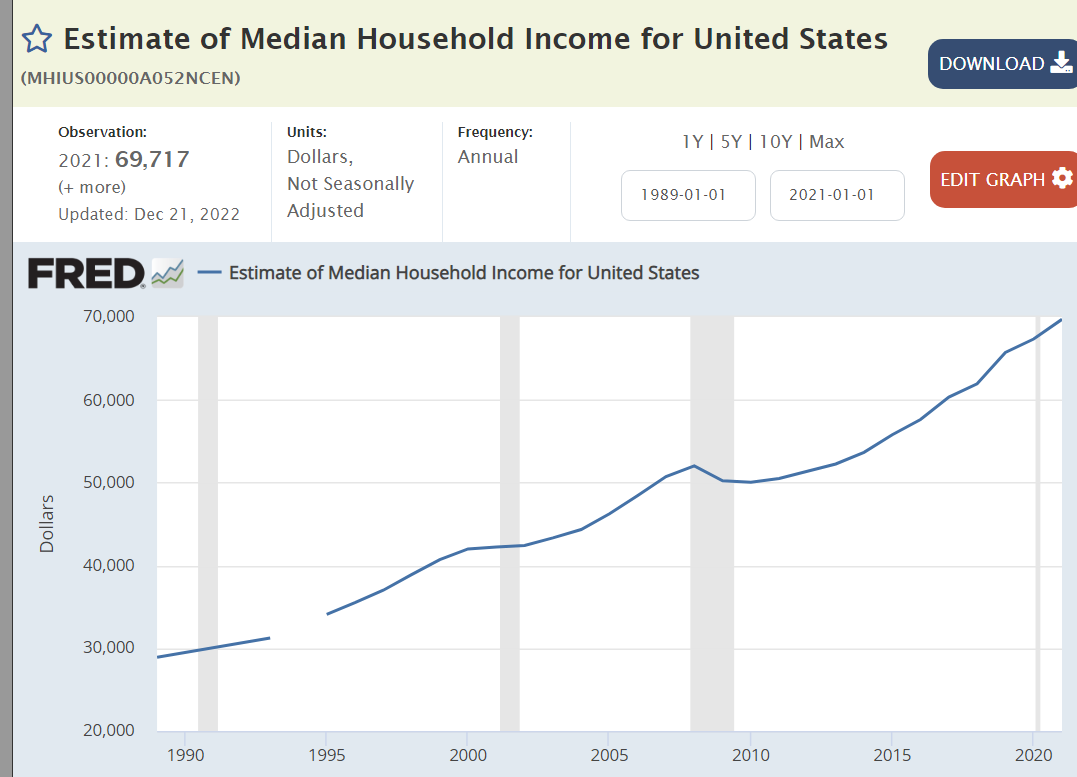
Hamilton County’s $105,000 median household income is 50% higher than the national level of $70,000. The 28% premium of average housing costs is not a significant burden for the median household income family.
On the other hand, families with the $70,000 national median income or lower income do struggle to find affordable housing in the rental and owner occupied housing markets locally.
State and local taxes are mostly driven by the state. In Indiana, state sales and income taxes account for 63% of the total. Local taxes account for 37% of the total.
Indiana is a lower tax state. Various sources rank it 11th to 18th lowest, with a median ranking of 14th. Hoosiers pay 9.3% of their income for taxes.
Indiana’s 9.3% paid is a little higher than 10th rated Oklahoma’s 9.0% and a little less than 25th rated New Mexico’s 10.2%. It is significantly lower than 40th rated Utah’s 12.1%.
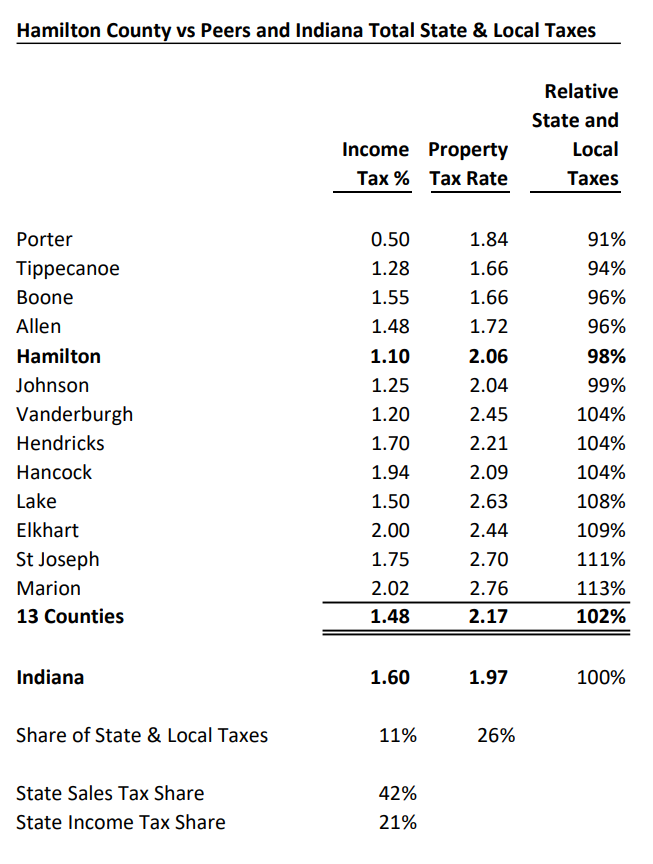
Hamilton County’s 1.1% income tax rate is the 12th lowest of 92 counties in Indiana, 31% lower than the average of 1.6%. The median is 1.75%. Its median property tax rate is 5% higher than the state average. The weighted average total state and local tax rate for Hamilton County is 2% lower than the state average. The Hamilton County total taxes paid as a percent of income is comparable to 12th ranked Louisiana and Florida at 9.1%.
Hamilton County has lower taxes compared with its Indiana peer counties, the top 10 in population plus Indy metro Johnson, Boone and Hancock counties. Its 1.1% income tax rate is lower than all except Porter County; significantly (26%) below the 1.48% average. Its median property tax rate is 5th lowest of the 13, 5% below the peer average. The peer counties’ total tax rate is 2% above the Indiana average. Hamilton County is 2% below the Indiana average.
For each measure, we’ll list the Hamilton County rate, the Indiana rate and a letter grade primarily comparing Hamilton County with the Indiana average but also considering the national average.
Annual flu vaccinations: 64% vs 54%, A.
Infants with recommended immunizations: 66% vs 67%, C.
Mothers receiving pre-natal care in first trimester: 84% vs 72%, A.
Mammography screenings: 47% vs 39%, A.
Adults with recent preventive care visit: 78% vs 75%, B.
Adults reporting excessive drinking: 18% vs 18%, C.
Alcohol impaired driving deaths: 24% vs 19% (US avg is 27%), C.
Adult smoking: 11% vs 20% (US avg is 16%), A.
Preventable hospital stays (by outpatient services) per 100K Medicare enrollees: 1,850 vs 3,174, A.
Adults without leisure-time physical activity: 17% vs 26% (US avg is 22%), A.
Adult obesity: 29% vs 37% (US avg is 32%), B.
Adult diabetes rate: 8% vs 11% (US avg is 9%), B.
Diabetes deaths per 100K: 12 vs 30, A.
Heart disease prevalence: 4.4% vs 6.0%, A.
Heart disease hospitalizations per 1K Medicare beneficiaries: 48 vs 62 (US avg is 57), A.
Sexually transmitted disease (chlamydia) cases per 100K: 216 vs 480, A.
Existing HIV cases per 100K: 82 vs 193, A.
Some medical experts dispute classifying measures (above and below) as being strongly related to individual behaviors or as social indicators. They are grouped as conventionally done by others reporting on public health.
Social Indicators
Emergency room injury visits per 10K: 532 vs 850, A.
Injury deaths per 100K: 43 vs 85 (US avg is 76), A.
Drug overdose deaths per 100K: 12 vs 28 (US avg is 23), A.
Opioid ER visits per 100K: 31 vs 75, A.
Deaths of despair per 100K: 31 vs 53, A.
Teen births per 1K females: 4 vs 17, A.
Births, mother smoked during pregnancy: 1% vs 11%, A.
Infant deaths per 1K live births: 4.7 vs 6.7 (US avg is 5.4), B.
Deaths per 100K under age 18: 30 vs 60 (US avg is 50), A.
Children in single parent households: 13% vs 25%, A.
Disconnected ages 16-19, not working or in school: 5% vs 6% (US avg is 7%), B.
Juvenile arrests per 1K: 8 vs 19, A.
Summary
Hamilton County earns summary A grades for both behaviors and social indicators. US News & World Report rates Hamilton County as 8th best nationally of the counties it tracks. County Health Rankings lists it as the healthiest county in Indiana.
For each measure, we’ll list the Hamilton County rate, the Indiana rate and a letter grade primarily comparing Hamilton County with the Indiana average but also considering the national average.
Primary care physicians per 100K: 140 vs 67, A+.
Hospital beds per 1,000: 1.8 vs 3.3, (US avg is 1.9), B.
Population per “other” (nurse practitioner) primary care providers: 920 vs 830, C-.
Population per mental health care provider: 580 vs 530 (US avg is 340): D.
Population per dentist: 1,350 vs 1,700 (US avg is 1,380), B.
Access to park or physical recreation facilities: 90% vs 77%, A-.
Uninsured adults: 5% vs 10%, A+.
Food insecurity: 7% vs 11%, A.
Limited access to healthy foods: 5% vs 9% (US avg is 6%), B.
Health Outcomes
Life expectancy: 81.6 vs 76.5 (US avg is 78.5), A.
Deaths per 100K: 710 vs 965, A+.
Premature deaths per 100K: 215 vs 420, A+.
Reporting poor or fair health: 9% vs 15%, A.
Poor physical health days per month: 2.5 vs 3.3 (US avg is 3.0), B.
Poor physical health one-half of the time: 7% vs 10%, A.
Low birth weight: 7% vs 8%, B.
Arthritis hospitalizations per 10K: 33 vs 33, C.
Hip fractures per 10K aged 65+: 56 vs 62, B.
New lung cancer cases per 100K: 46 vs 72, A+.
Total cancer rate per 100K: 442 vs 457, C+.
Total cancer death rate per 100K: 126 vs 163 (US avg is 144), A-.
Mental Health
Poor mental health days per month: 3.9 vs 4.9, A.
Frequent mental distress: 13% vs 16%, B+.
Medicare beneficiaries with depression: 20% vs 21% (US avg is 18%), C-.
Insufficient sleep: 27% vs 36%, A.
Suicide deaths per 100K: 9 vs 15, A+.
Summary
Subjectively, health resources combine for a solid B+ or A-. Health outcomes are clearly rated A. Mental health is A. US News & World Report rates Hamilton County as 8th best nationally of the counties it tracks. County Health Rankings lists it as the healthiest county in Indiana. Hamilton County operates Riverview Health. Its health department effectively managed several rounds of covid vaccines.
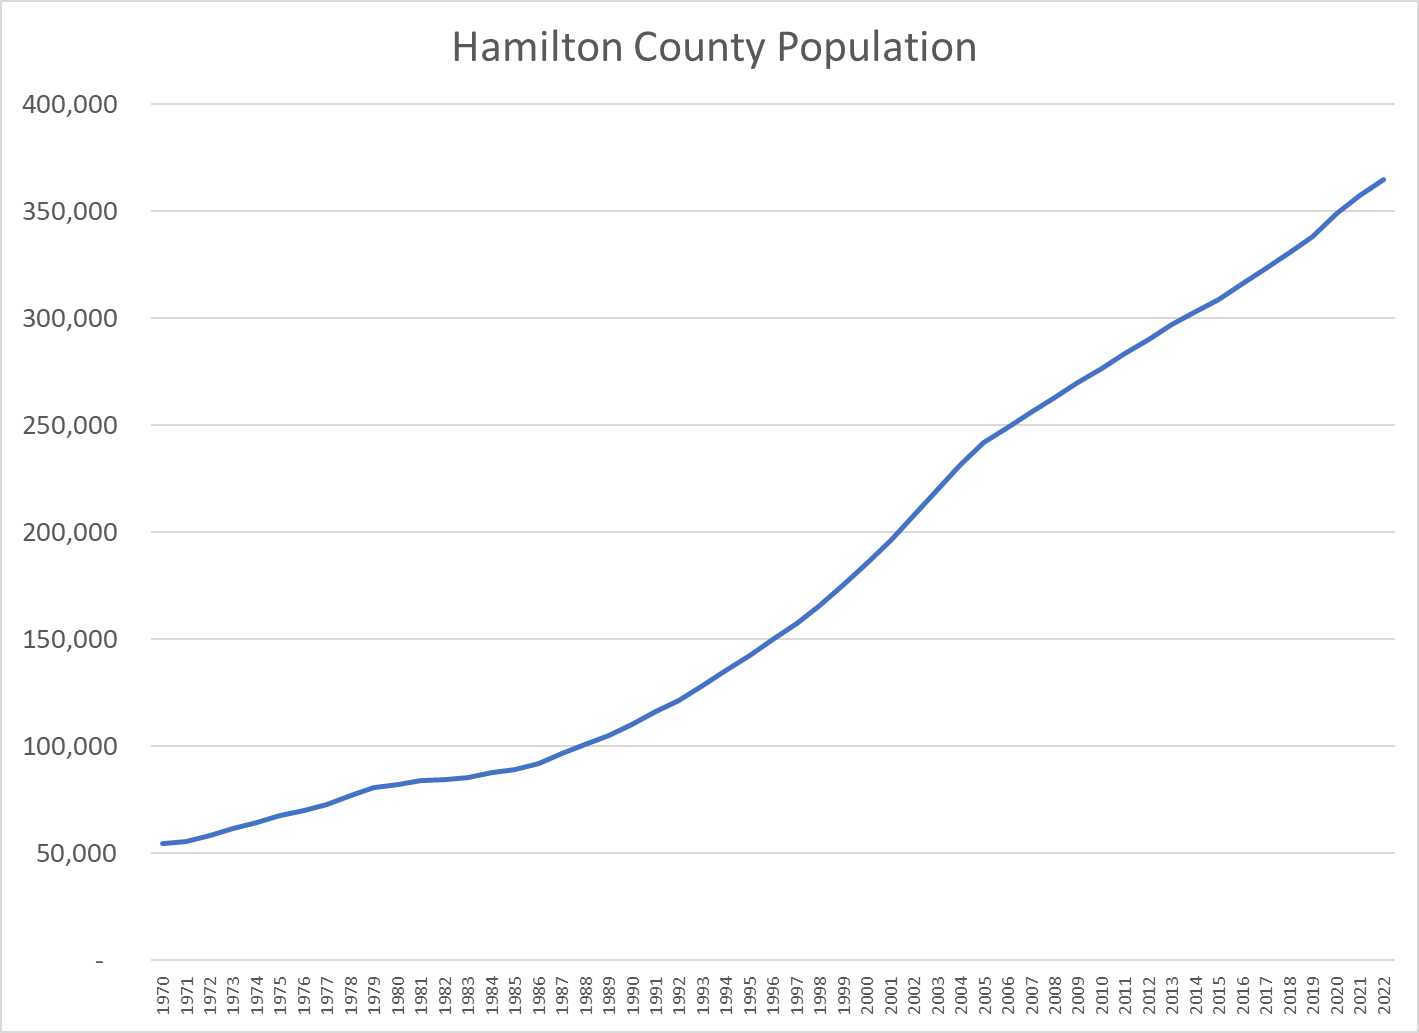
Hamilton County’s population has grown by at least 7,000 per year for 30 years. Growth peaked at 10,000 per year from 1999-2005, decreased to 7,000 in the aftermath of the Great Recession and has since increased to 8,000 per year.
The county has enjoyed a natural increase of about 2,000 per year, with 4,000 births per year and 2,000 deaths per year. Annual net in-migration has averaged 6,000 in the last decade. Hamilton County loses roughly 3,000 residents to other states and 2,000 students to attend major universities. It gains about 4,000 international immigrants, 1,000 from Illinois, 1,000 from other Indiana counties and 5,000 from nearby Marion County.
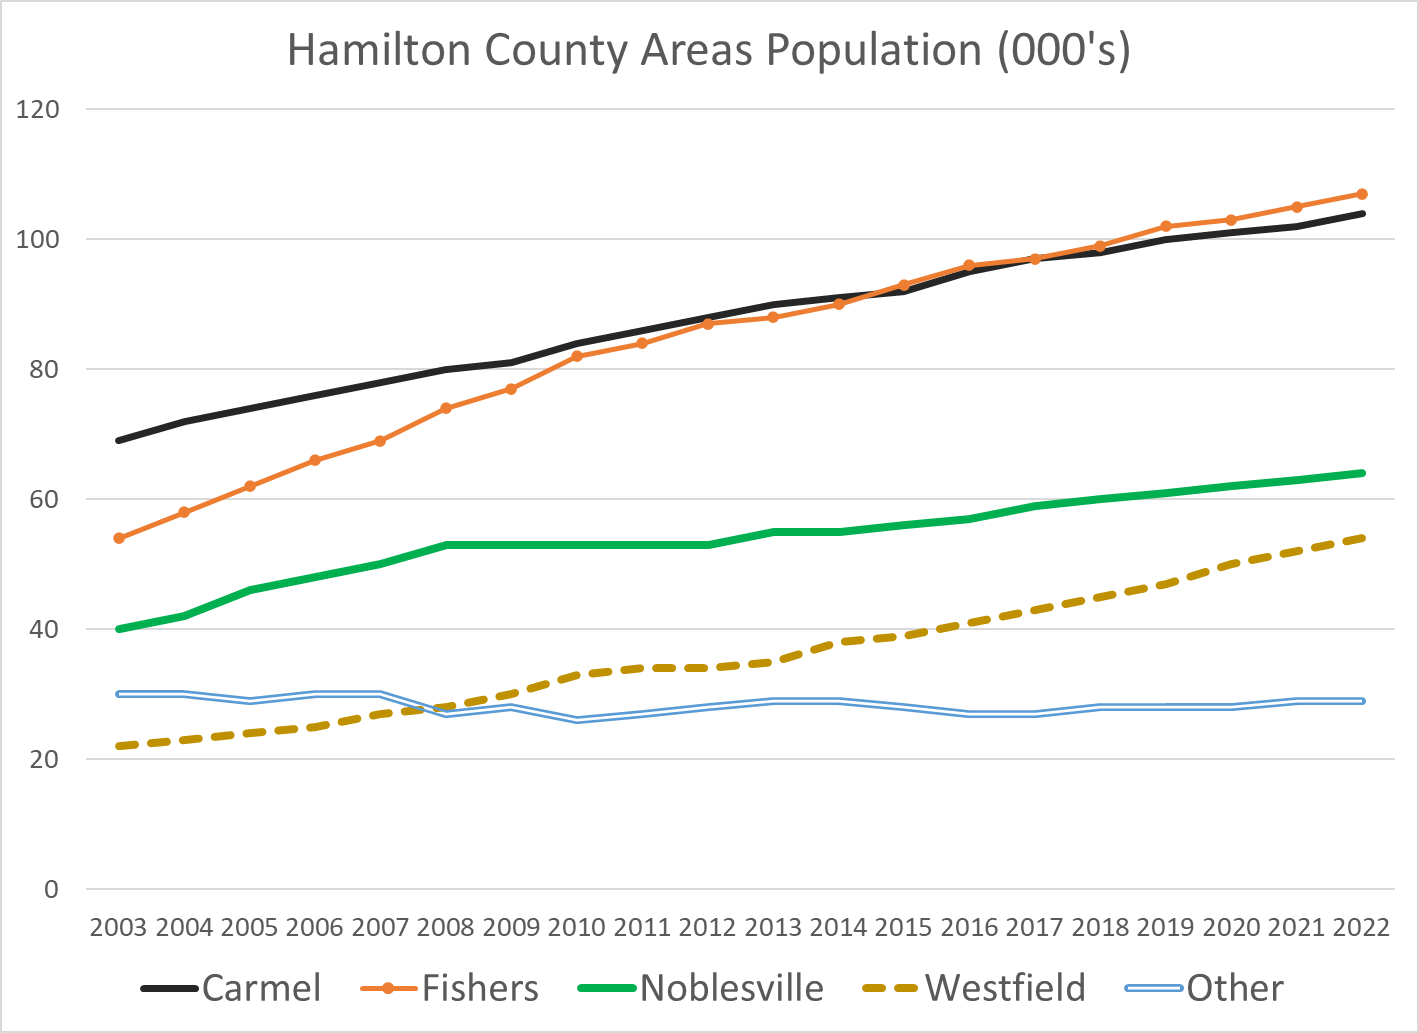
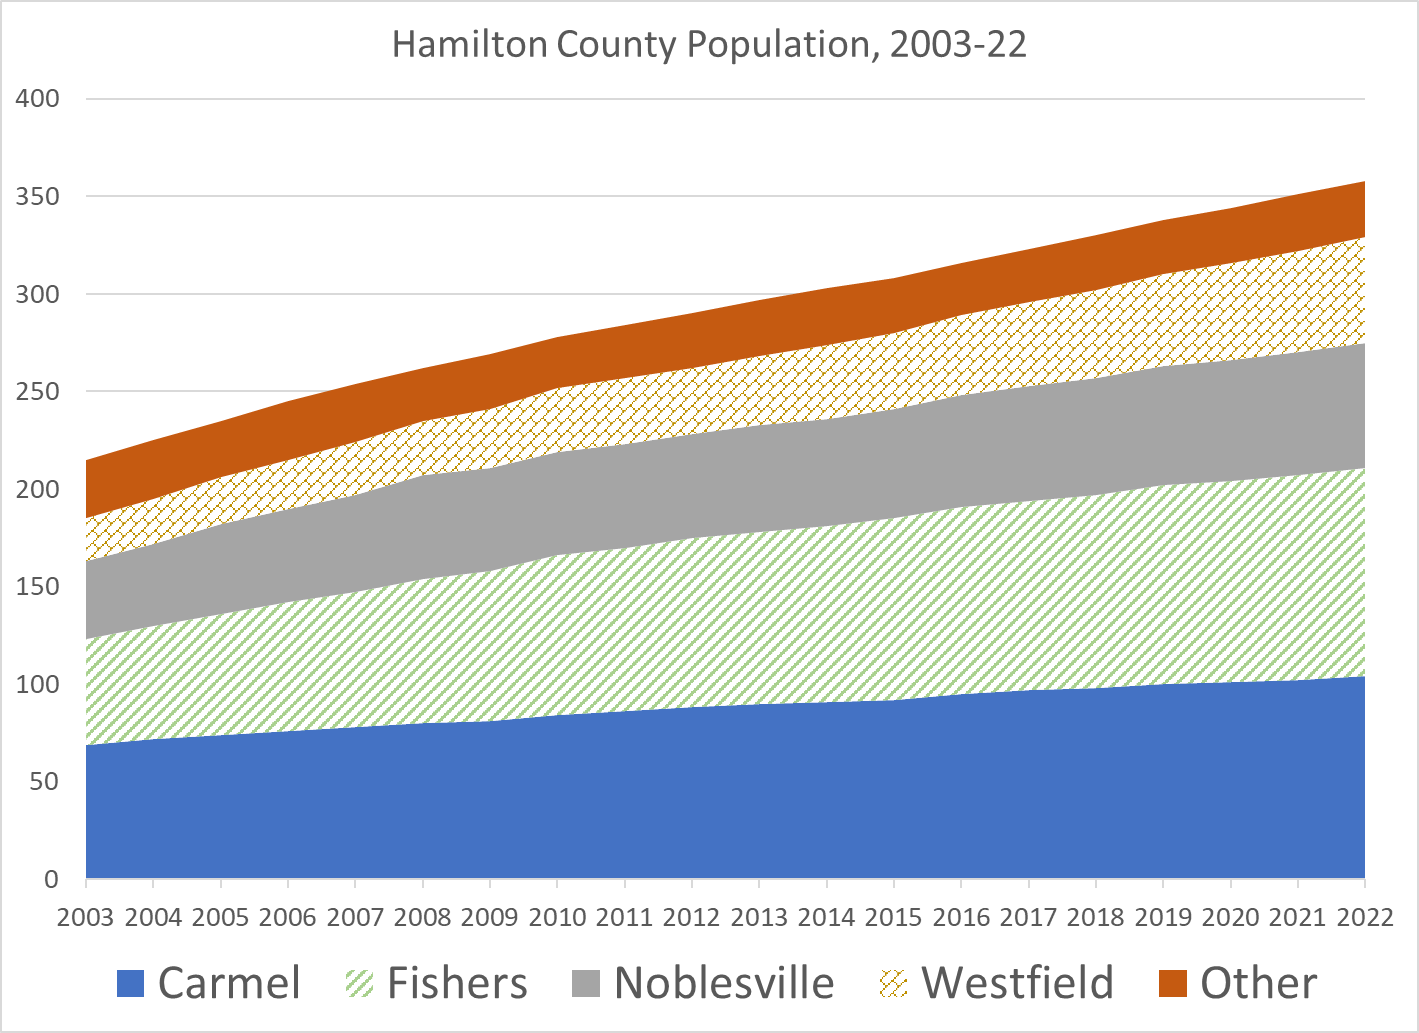
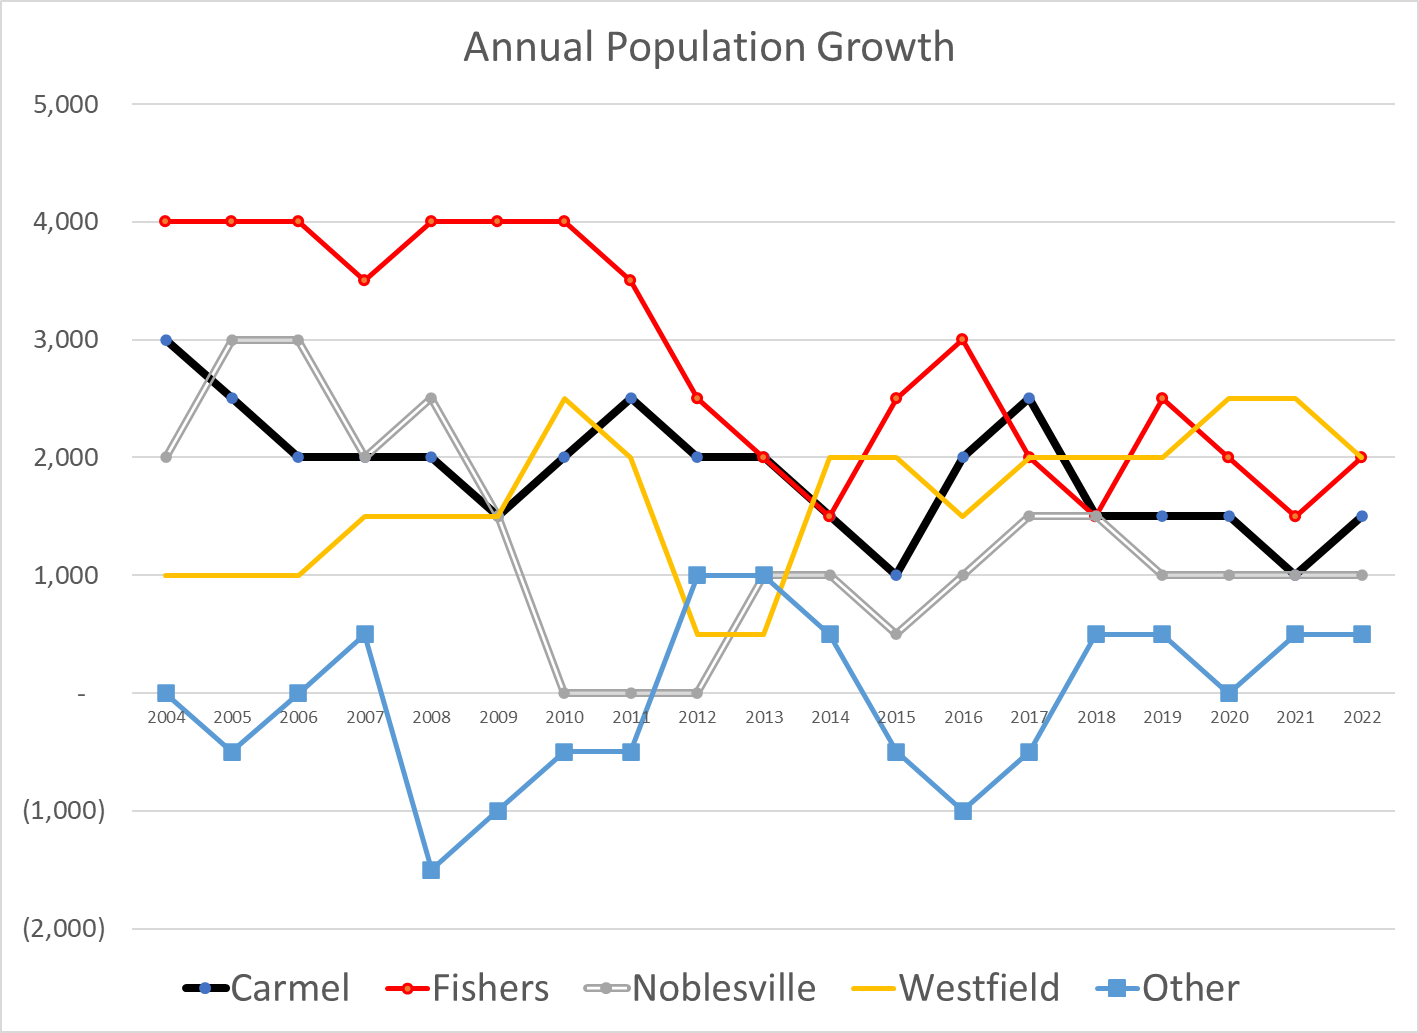
Four major cities contribute to Hamilton County’s rapid growth. Carmel was the early leader. Fishers grew even more rapidly in the 2000’s. Noblesville has continued its steady growth of 1,000 new citizens annually. Westfield has joined Carmel and Fishers in adding 2,000 residents per year, showing a higher percentage growth rate on its lower base.
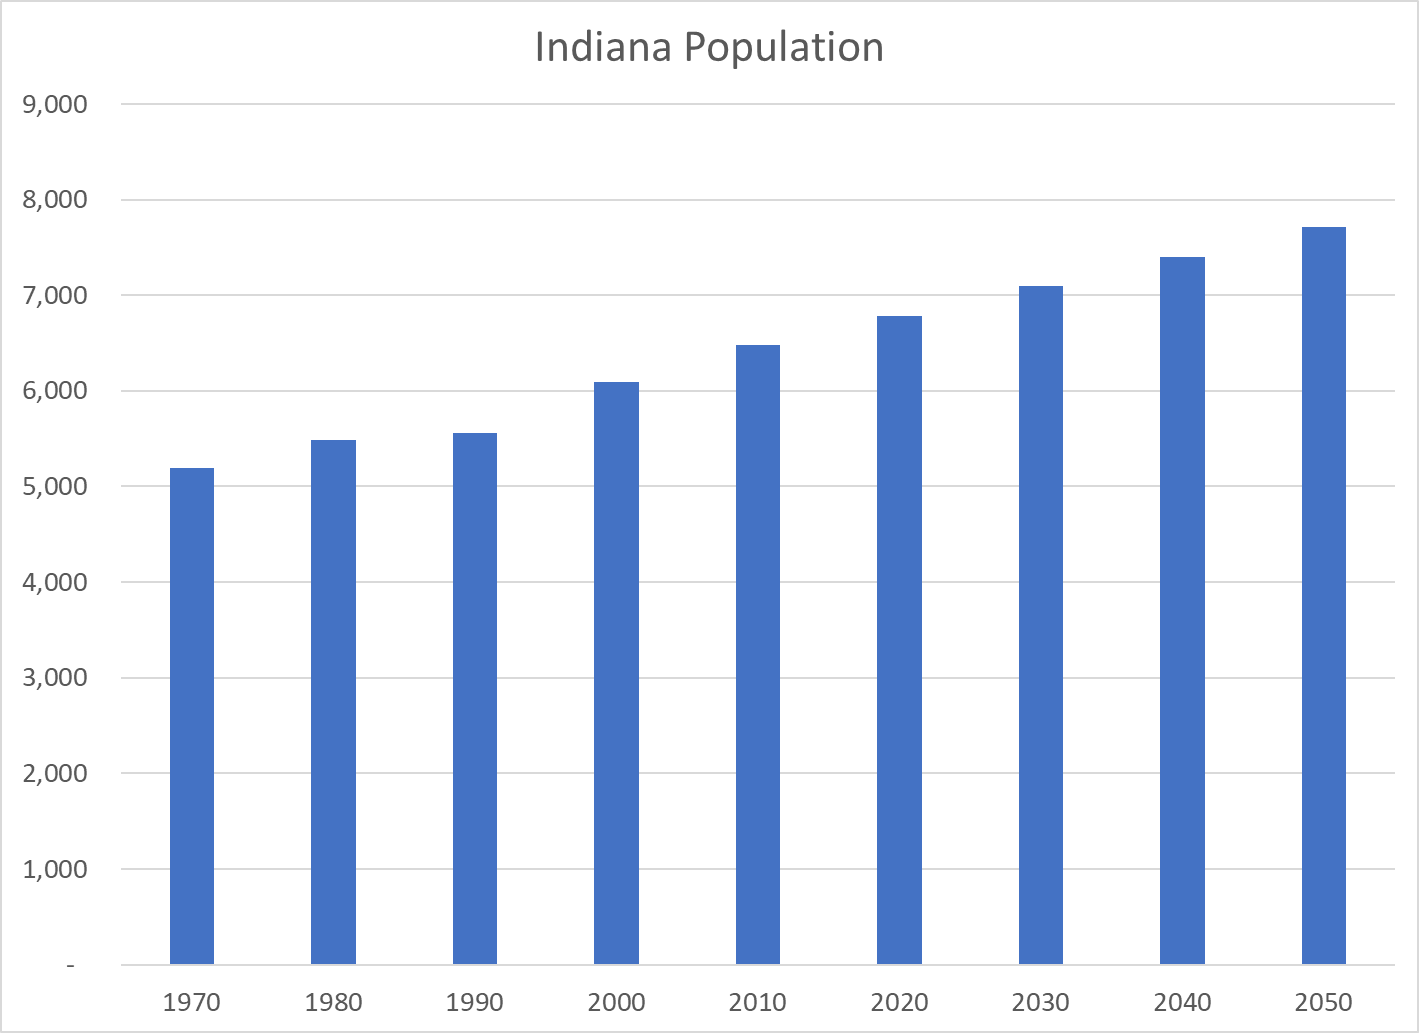
The 2020 census results were significantly higher than the 2018 state of Indiana forecast update. The 2018 forecast shows Hamilton County in 2050 at 528,000 people rather than 567,000 with growth of 180,000 rather than 219,000. It has Indiana at 7.3 million instead of 7.7 million people in 2050.
The metropolitan Indianapolis area is expected to continue to experience solid growth rates for the next 3 decades.
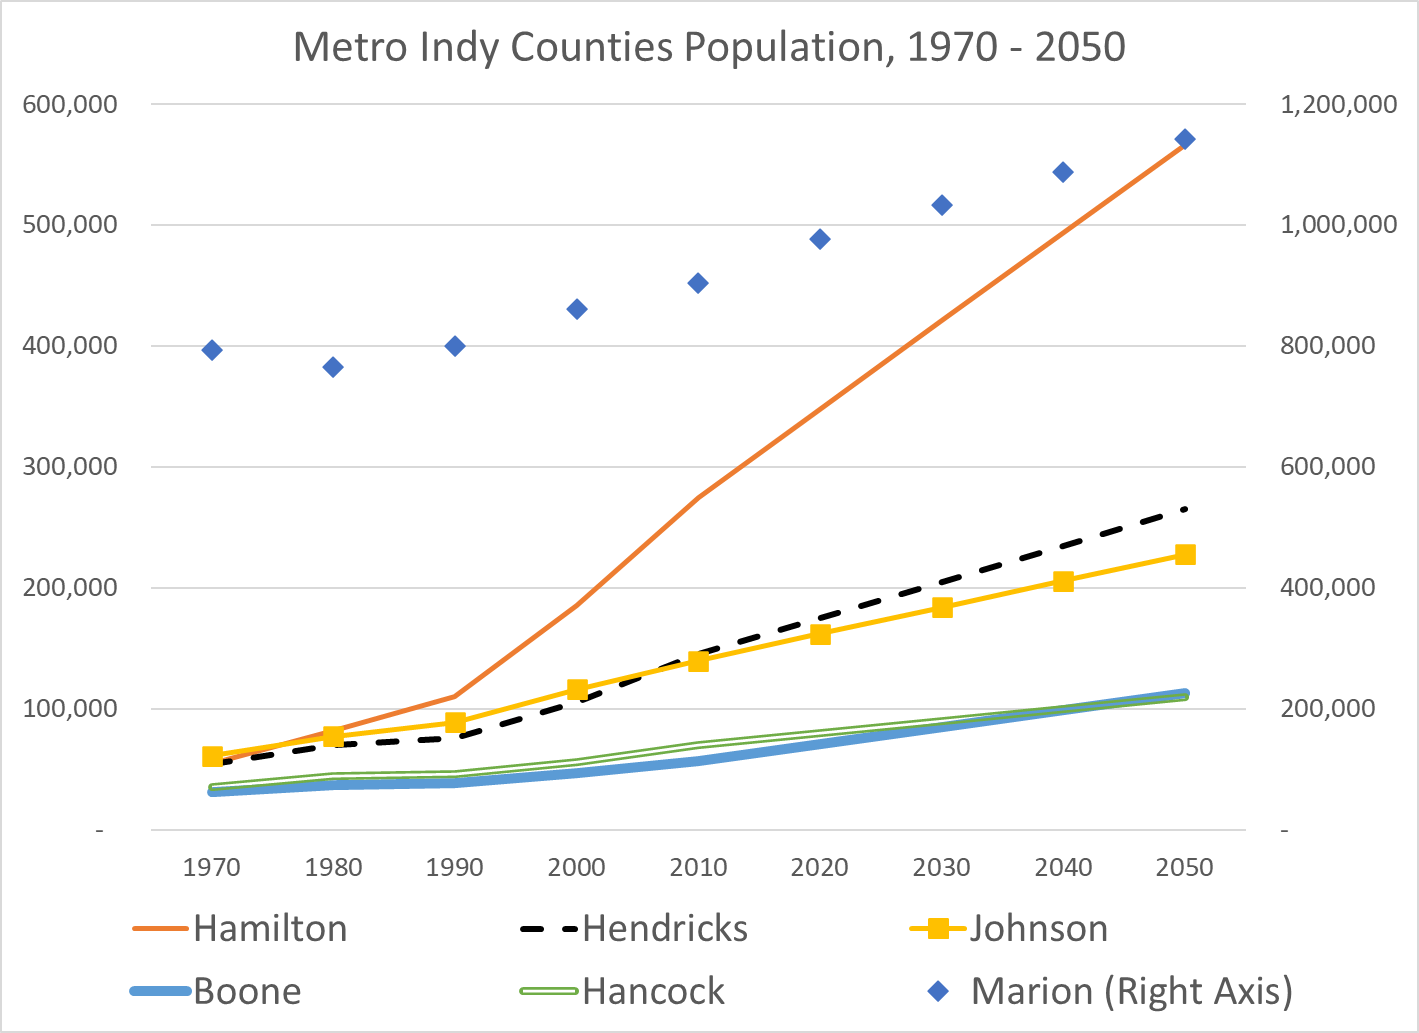
In 1970, Hamilton County had 55,000 citizens and ranked 21st of Indiana’s 92 counties. It doubled in size to 110,000 by 1990, ranking 11th largest and joining Madison, Delaware, Tippecanoe, Vigo and LaPorte as “major” counties. By 2000 Hamilton County contained 185,000 people and was ranked the 6th largest in Indiana. Hamilton continued to grow by 75,000 per decade, passing Elkhart and St. Joseph counties for 4th place by 2010. Based on these trends, Hamilton will pass Allen County by 2030 and Lake County by 2040 to become the second largest Indiana county, trailing only Marion County.
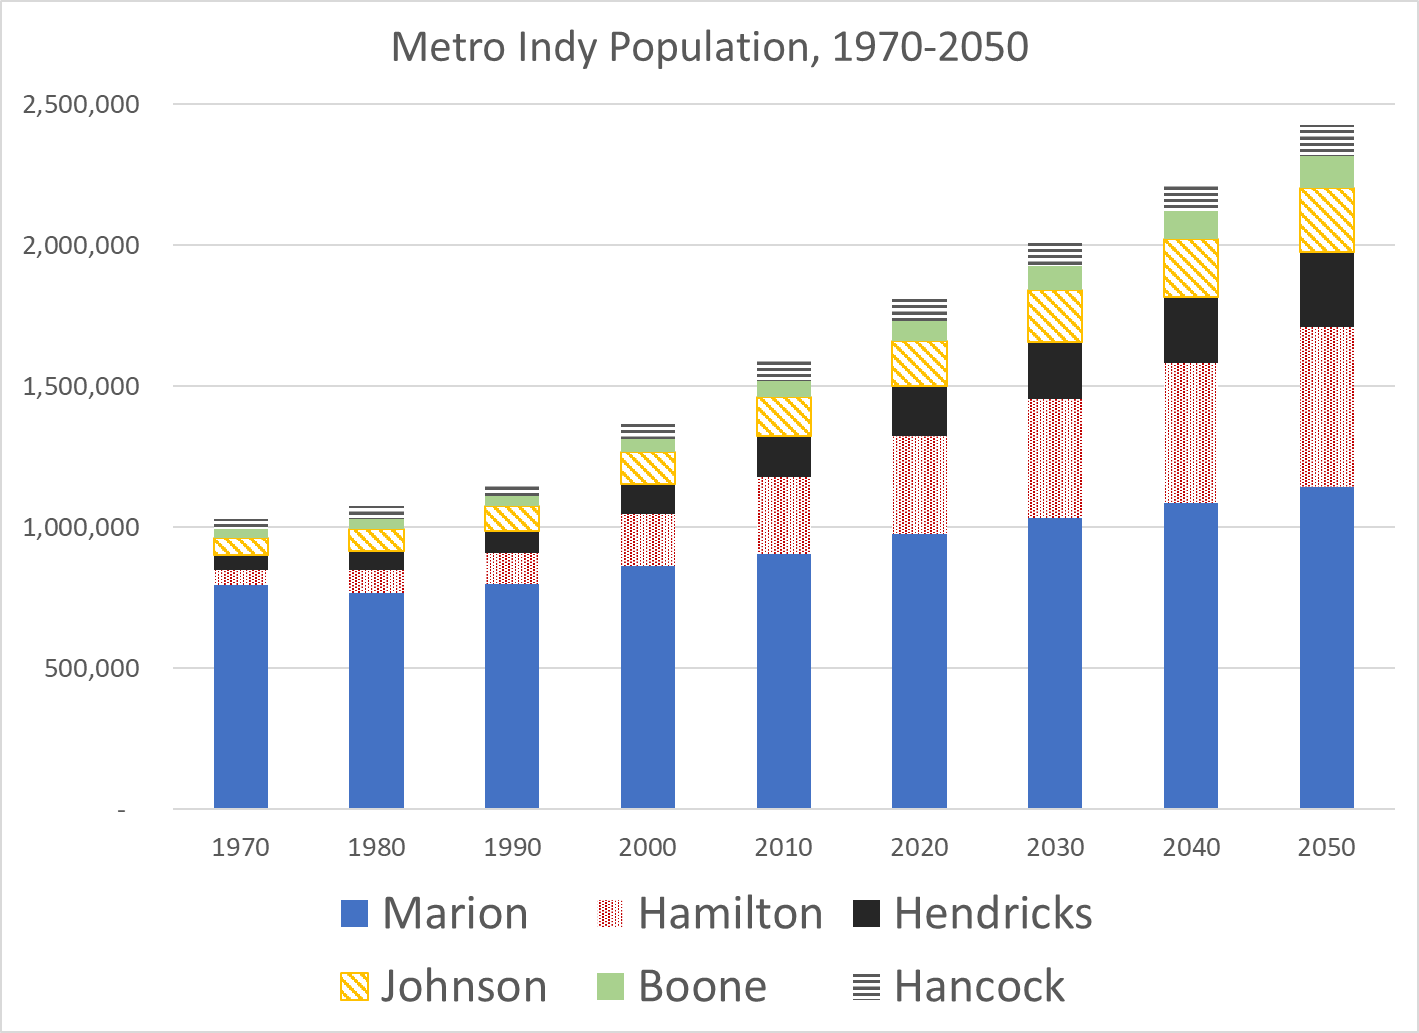
Hamilton County has grown as part of the Indy Metro area. Marion County has averaged growth of 60,000 people in the last 3 decades. Hamilton County is forecast to maintain its 73,000 per decade growth rate. The other four suburban counties are forecast to maintain their combined 80,000 per decade growth rate.
Summary
Hamilton County has enjoyed annual population growth of 7-8,000 for the last 30 years and can reasonably be forecast to continue such growth for the next 30 years. The growth of the Indy Metro area stands out versus slower growing areas in Indiana and the Midwest. Hamilton County’s four major cities continue to attract new residents and the county’s northern areas remain available for managed development within short commuting distances of the existing economic centers throughout the county. Economic growth has a tendency to be self-reinforcing. As Hamilton County approaches one-half million residents it will focus more on “managing” such growth.