Winning the Trifecta: Increased Single Party Control of Governors and State Legislatures

https://www.americasbestracing.net/gambling/2021-beginners-bet-the-week-the-trifecta

For most of the 20th century, states outside of the “Solid South” had a competitive two-party system and mixed party results for the three bodies of government. In President Obama’s first midterm election in 2010, Republicans added ten new state trifectas, managing all 3 elected branches of government. Democrats have fought back, increasing their count of trifectas in the last 5 years. Political analysts assert that this increased clustering of results at the state level is due to the increased polarization of the electorate and the “nationalization” of political issues at the state level. Proponents of a federalist delegation of powers to the state level hope that this will result in greater experimentation in state policy results and tests of the effectiveness of those partisan policies.

State level trifectas allow political parties to implement policies that they prefer, without regard to the opinions of the opposition. They also allow ruling parties to pass laws that signal their support for their constituents’ political preferences. They can deliver on their election promises. Many of these laws address partisan or “wedge” issues: abortion, gun control, marijuana, unions, wages, health care, education, the environment and infrastructure.

https://fivethirtyeight.com/videos/whats-the-deal-with-political-trifectas/

https://www.opb.org/article/2022/11/11/control-of-congress-matters-state-governors-power/

https://www.route-fifty.com/management/2022/12/democratic-control-trifectas-state-legislatures-2023-massachusetts-maryland-michigan-minnesota/381376/

https://www.washingtonpost.com/politics/2022/12/08/democrat-state-government-trifecta-americans/

https://www.washingtonpost.com/outlook/2021/05/12/2010-elections-politics-effects/

State legislatures also increasingly focus on the election process, voting access and drawing legislative districts to partisan advantage.

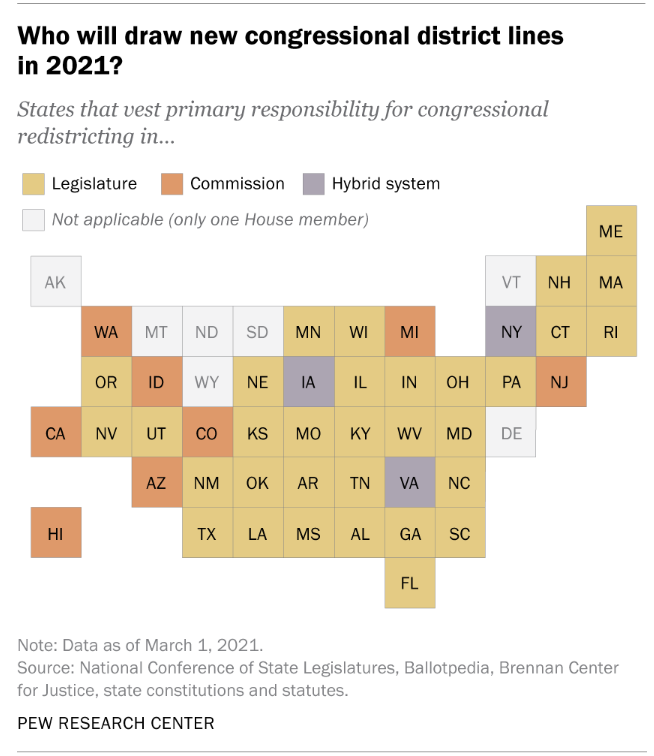
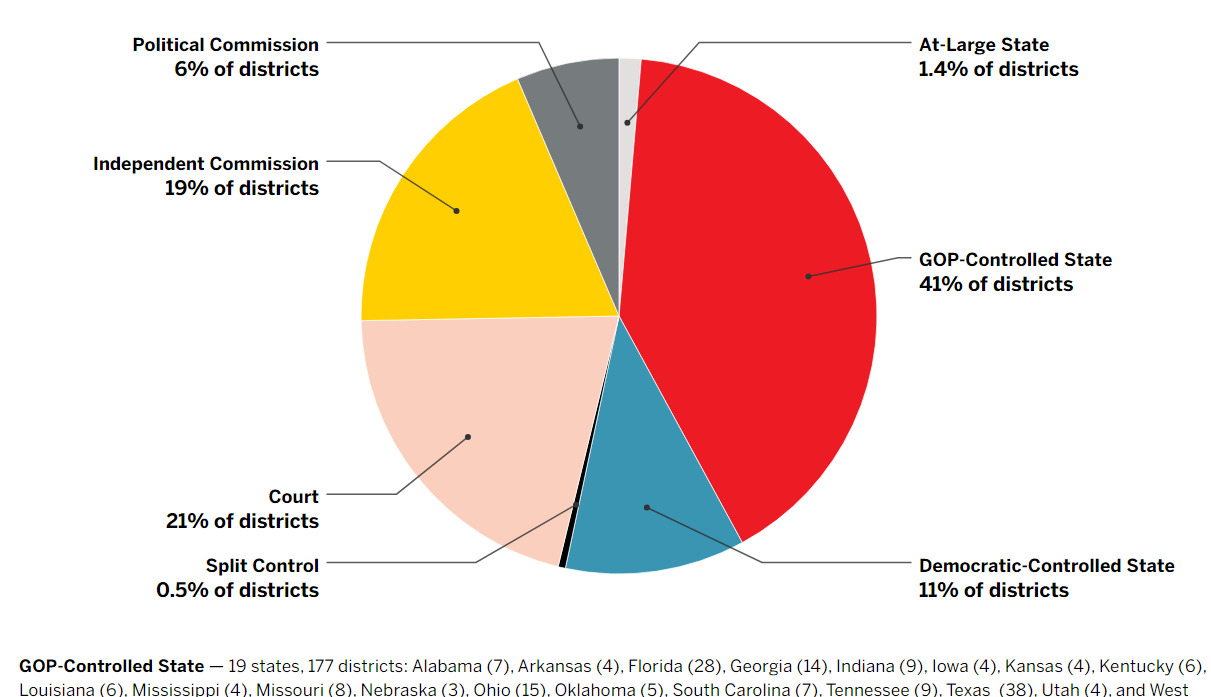
Redistricting is Shaped by Trifecta Governments

https://www.pewresearch.org/short-reads/2021/03/04/with-fewer-state-governments-divided-by-party-than-in-years-past-gop-has-edge-in-redistricting/

https://www.brennancenter.org/our-work/research-reports/who-controlled-redistricting-every-state

https://projects.fivethirtyeight.com/redistricting-2022-maps/

And … the 2020 redistricting is not yet complete for 6 states.

https://abcnews.go.com/Politics/redistricting-6-states-affect-controls-congress/story?id=101011397

Trifectas by State and Party in 2023

https://www.270towin.com/content/state-government-trifectas

22 Republican and 17 Democratic trifectas in 2023.

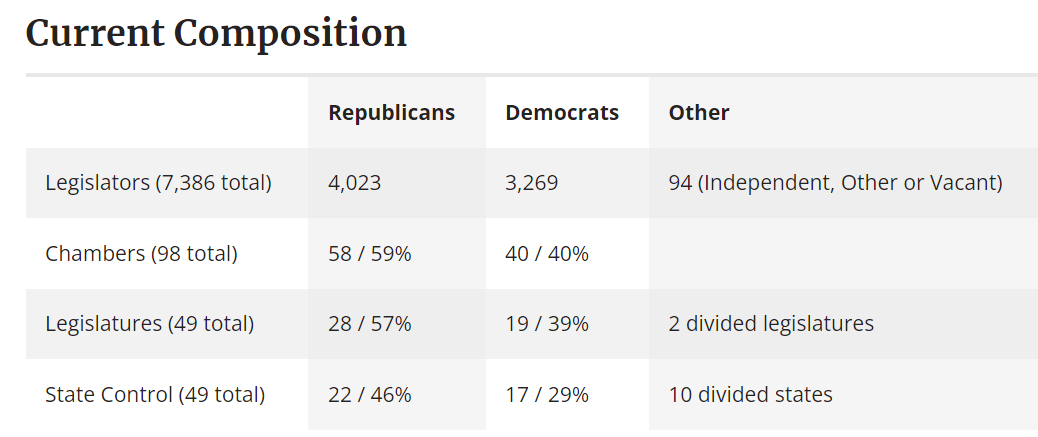
https://www.ncsl.org/about-state-legislatures/state-partisan-composition

Republicans lead in the counts.

https://ballotpedia.org/State_government_trifectas

https://www.washingtonpost.com/politics/2022/12/08/democrat-state-government-trifecta-americans/

Democrats have a small advantage in the number of people represented by trifecta governments.

2022 Election Helped Democrats

The 2022 election was better than expected for Democrats. They were especially pleased to achieve trifecta status in Maryland, Massachusetts, Michigan and Minnesota (what are the M odds?).

https://fivethirtyeight.com/videos/whats-the-deal-with-political-trifectas/

https://www.opb.org/article/2022/11/11/control-of-congress-matters-state-governors-power/

https://www.route-fifty.com/management/2022/12/democratic-control-trifectas-state-legislatures-2023-massachusetts-maryland-michigan-minnesota/381376/

Historical Trends in Trifectas by Party

https://www.washingtonpost.com/politics/2022/12/08/democrat-state-government-trifecta-americans/

https://ballotpedia.org/State_government_trifectas

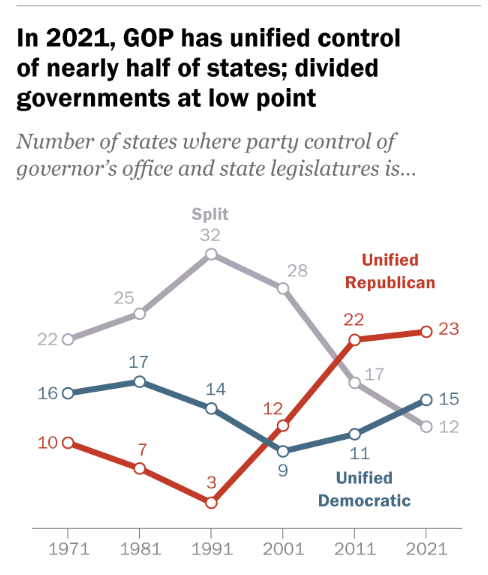
With fewer state governments divided by party than in years past, GOP has edge in redistricting

During the 1970’s and 1980’s, Democrats held 15 trifectas, mostly in the South, while Republicans held a little more than 5. In the 1994 midterm election during Bill Clinton’s first term, Republicans won handily at the national, state and local levels. Democrats lost 10 trifectas which they would not recover until 2008. Republicans added a dozen trifectas and led the Democrats by 16-8 for most of the next decade.

https://library.cqpress.com/cqalmanac/document.php?id=cqal94-1102765

In George Bush, Sr.’s second mid-term election in 2006, Democrats recovered most of their losses at the state level, gaining a 15-10 lead in trifectas.

https://www.washingtonpost.com/wp-dyn/content/article/2006/11/08/AR2006110800589.html

Republican Gains in 2010 Were Historic

The Republican gains during Obama’s first midterm election in 2010 were historic, creating a 23-11 Republican lead in trifectas and setting patterns of state control that have largely continued since. Analysts pointed to the economy, health care, the tea party, immigration, race, scandals and Republican election investments at the state level.

https://www.politico.com/story/2010/11/democrats-losses-ran-wide-deep-045160

https://en.wikipedia.org/wiki/2010_United_States_elections

https://www.washingtonpost.com/outlook/2021/05/12/2010-elections-politics-effects/

https://www.npr.org/2016/03/04/469052020/the-democratic-party-got-crushed-during-the-obama-presidency-heres-why

Ballotopedia provides year by year trifecta data which allows us to show how the Republican party has built and maintained its dominance in the last 25 years and how the Democratic party has shown signs of strength in the last 5 years.

Republican State Trifectas Maintained Since Year …

1995- Utah, Idaho, North Dakota and South Dakota

1999- Nebraska and Florida (except 2010)

2003-5 – South Carolina, Georgia and Texas (9 cumulative)

2009 – Arizona (except 2023)

2011-12 – Alabama, Indiana, Ohio, Oklahoma, Tennessee, Wyoming and Mississippi (17)

2015-19 – Arkansas, Iowa, Missouri and West Virginia (21)

2021 – Montana and New Hampshire (23)

Democratic State Trifectas Maintained Since Year …

2003 – Illinois (except 4 years)

2007-9 – Oregon and Delaware

2011-3 – California, Connecticut, Hawaii and Rhode Island (7 cumulative)

2018-19 – New Jersey, Washington, Colorado, Maine, New Mexico and New York (13)

2023 – Maryland, Massachusetts, Michigan and Minnesota (17)

https://ballotpedia.org/State_government_trifectas

The Republicans got started earlier and were more effective at “locking down” states, but the left versus right political alignment in the country has allowed Democrats to partially “catch up” recently.

The two parties have a similar number of states at risk of losing their trifecta status. Montana, New Hampshire and Arizona for the Republicans (3). Maryland, Massachusetts, Michigan and Minnesota for the Democrats (4). Based on history and trends, Democrats (2) hope to see Nevada and Vermont join their trifecta team. Republicans (5) have even more candidates in Kansas, Louisiana, Kentucky, Wisconsin and North Carolina.

Summary

39 of 50 state governments are controlled by a single party. This pattern is likely to continue. States are using this power to shape election rules and ensured continued local political party control and are making policy choices that make the differences between red and blue states more distinct.

Do You Believe in Magic? “No Labels” Proposes a Centrist Third Party

Joe Lieberman is back in the news again (remember him? or not?).

https://en.wikipedia.org/wiki/Joe_Lieberman

A “centrist” organization he supports is actively working to be on the presidential ballot in all 50 states in 2024. “No Labels” has defined “centrist” political positions. It says that Democrats and Republicans have abandoned the center. It considers the Democrats and Joe Biden as extremists. It also considers the Republicans and Donald Trump as extremists and claims that it will withdraw its candidates if polling indicates that it will lead to a Trump election in 2024. It has not chosen presidential and vice-presidential candidates. Rumored candidates include Joe Manchin, Jon Huntsman, Kyrsten Sinema, Larry Hagan and Mark Cuban.

https://en.wikipedia.org/wiki/No_Labels

The political parties ARE polarized.

Trump and Biden are considered unattractive candidates by many due to their age and baggage. 60% of Americans hope that Trump will not run again and 70% hope that Biden will not run again. Yet, they appear to lead their parties for the nomination. One might think that now is the best time for a 3rd party candidate.

The Democrats, centrists and political analysts are all coming out against the “No Labels” third party. The congressional “problem solvers caucus” is opposed. “No Labels” co-founder Bill Galston has removed his support. The “Third Way” has blasted the movement. The “Lincoln Project” is opposed. Democrats see this as a way to elect Trump.

https://www.thirdway.org/memo/the-no-labels-third-party-bid-a-plan-that-will-re-elect-trump

They argue that 3rd party candidates in the US have always failed to actually win any states since Wallace’s 1968 run. Even Ross Perot won no states. They mostly attract voters away from the incumbent party as in 68, 80, 92, 00 and 16.

Analysts (and Democrats) emphasize that true centrist, independents are less than 10% of the electorate. While self-identified “independents” are now more than 30% or the electorate, most strongly lean towards one party or the other. So-called moderates are 20-25% of the voting population. “No labels” has outlined an electoral college map in which a centrist candidate could be elected. Critics consider it wildly optimistic, with a centrist candidate winning Hawaii, Maryland, Massachusetts and Utah.

Democrats perceive this as a threat and are actively trying to undermine “No Labels” party registration.

538 argues that Democrats and Republicans are very comfortable with Biden and Trump as their candidates for 2024. Left and right leaning “independents” have similar views.

David Brooks welcomed “No Labels” in the NYTimes and then reversed his view.

https://www.sltrib.com/opinion/commentary/2022/09/03/david-brooks-is-america-ready/

The rest of the “mainstream media” has taken the same position.

https://nymag.com/intelligencer/2023/05/the-fallacy-behind-no-labels-independent-unity-ticket.html

https://www.latimes.com/opinion/story/2023-05-29/third-party-no-labels-2024-election-joe-biden-donald-trump

https://abcnews.go.com/Politics/unity-ticket-2024-presidential-race-democrats-objecting-3rd/story?id=99773854

https://www.cnn.com/2023/07/17/politics/third-parties-elections-what-matters/index.html

https://www.forbes.com/sites/saradorn/2023/07/18/what-to-know-about-no-labels-shadowy-political-group-raises-alarms-over-a-spoiler-2024-presidential-candidate/?sh=5c79a5a83c29

https://www.usnews.com/news/the-report/articles/2023-07-21/how-a-third-party-presidential-candidate-could-push-trump-to-victory

https://www.npr.org/2023/07/22/1189362839/no-labels-americans-elect-third-party

Summary

The US has run a two-party system for hundreds of years. Polarization has increased. The two parties have adopted divergent policy positions. Nonetheless, there is not a clear path for a newly formed centrist party to consolidate disaffected Democrats, Republicans and moderates to win a presidential election. It may require some sort of discontinuity (another coup attempt) to prompt Americans to consider a revolutionary party with a radically nonpartisan bent to revise our political structure, supporting the existing “checks and balances” structure, making elections fairer, reducing the influence of funding sources, helping political parties to force candidates to the center, and inserting filtering mechanisms to prevent extremist politicians.

Hard Rock N Roll: 1964-77

50 songs from the core era of “rock n roll” featuring the deeper sounds and lead guitar innovations. The Rolling Stones, Steppenwolf, Ted Nugent, Black Sabbath, Uriah Heep, Suzi Quatro, Jimi Hendrix, Deep Purple, Jethro Tull, and George Thorogood claim a majority of the spots. Enjoy.

https://www.youtube.com/watch?v=F-kVFfKezVo
https://www.youtube.com/watch?v=5wCUlPNlQuA

Good News: Labor Force Participation Recovers from the Pandemic

https://chicago.suntimes.com/2022/6/10/23162642/best-photos-of-the-week-chicago

Overall labor force participation rate dropped by 1.5% in the pandemic and has recovered by 1%, still 0.5% below the recent history. However, the prime age category and several market segments no meet or exceed their pre-pandemic levels. Many details to consider.

Hispanic participation is now 1% higher than the 2018-19 average before the pandemic.

The Asian participation rate is up 1%.

The Black participation rate is up 0.5%.

The White participation rate dropped by 1.5% and has recovered by half: 0.75% better but 0.75% below history.

The Women’s participation rate has essentially recovered to the 2018-19 average but is a half point lower than the peak levels seen just before the pandemic.

The male participation rate dropped by 1.5% but has only recovered by 0.5%, a major 1% below pre-pandemic times. Part of this is due to the long-term downward trend. Part of this is a “mix variance” driven by the very high number of “baby boomers” moving into normal retirement age or retiring early.

https://www.richmondfed.org/publications/research/econ_focus/2021/q1/district_digest

Black men are back to their pre-pandemic participation rate.

Black women are more active labor force participants.

Hispanic men remain 1% below their pre-pandemic labor force participation rate.

Latino women have recovered to their historically high 61% participation ratio.

The White male participation rate dropped by 2% and has not recovered. Again, part is due to the long-run downward trend. Part is the aging of baby boomers into retirement. The remainder appears to be a response to the pandemic experience. “I’m not working unless you make it worth my while.”

White women remain a little below their 2018-19 average and three-quarters of a point behind their pre-pandemic peak level.

Teenage work participation has increased by 1.5% as entry level wages have risen.

College grad age participation rate has mostly recovered but remains 1% below the pre-pandemic high.

The retirement age workforce reduced its participation rate by 1.5% and has stayed there after a brief pseudo-recovery.

https://www.whitehouse.gov/cea/written-materials/2023/04/17/the-labor-supply-rebound-from-the-pandemic/

The prime age work force is now above even the elevated pre-pandemic level and a full one percent above the 2018-19 average. This is very good news, reflecting a strong economy an labor market.

Prime aged men have returned to the workforce.

Prime aged women are the “rock stars”, increasing their participation by 2% from 2019.

Brookings has combined all of the race and age data. Major declines for white men in all 3 age groups and for white women aged 65+. Major improvements for prime age white, black and other women and for prime age black men.

Non- high school graduates have added 1% to their labor force participation as real wages have increased.

High school graduate participation dropped by three points before recovering by two points.

Individuals with some post-high school education, but not a bachelor’s degree, are in the middle range of US educational attainment. Their labor force participation rate had declined by almost 3 points in the 6 years before the pandemic, dropped by another 2 points during the pandemic and has not “recovered”.

Labor force participation by bachelor’s degree holders was stable before the pandemic, then dropped by 2 points and has since recovered by a little more than 1 point, remaining about one-half point below the prior average.

Individuals with a high school degree or higher have displayed drops of 10 points in labor force participation across the last 30 years. Most of this change is due to the “mix variance” of lower participation by an increasingly older and retired population, but some reflects other causes.

https://www.census.gov/library/stories/2021/06/why-did-labor-force-participation-rate-decline-when-economy-was-good.html

Foreign born members of the US labor force have fully “returned to work” after the pandemic.

https://www.whitehouse.gov/cea/written-materials/2023/04/17/the-labor-supply-rebound-from-the-pandemic/

This participation growth improvement has taken place as the foreign-born population has increased to its trend growth rate.

https://www.ers.usda.gov/topics/rural-economy-population/employment-education/rural-employment-and-unemployment/

https://www.ers.usda.gov/data-products/chart-gallery/gallery/chart-detail/?chartId=103862

In general, rural labor markets have grown more slowly in the last 15 years and shown greater reductions in labor force participation. Some of the increased labor force participation in the last 2 years may reflect a recovery from these declines.

https://www.bostonfed.org/publications/new-england-economic-conditions/2023/april.aspx

Most states show a similar pattern of labor force participation in the years before the pandemic, declining by 2-4% and afterwards recovering to their pre-pandemic level. California’s recovery has been slower. The New England states had an unusual increase in labor force participation before the pandemic and have not seen a major recovery after the pandemic.

Summary

Several sources decry the decline in the number of workers and the labor force participation rate, noting that it holds back the economic recovery and taints the 3.5% unemployment rate.

https://www.forbes.com/sites/qai/2023/01/25/unemployment-is-low-but-so-is-the-labor-force-participation-rate—whats-going-on-in-the-us-labor-market/?sh=72f0035b244e

https://www.gspublishing.com/content/research/en/reports/2021/11/12/4f72d573-c573-4c4b-8812-1d32ce3b973e.html

https://www.uschamber.com/workforce/understanding-americas-labor-shortage

Other sources point to the long-term downward trends in participation as the biggest factor, mostly driven by an aging workforce and recent higher than normal retirement rates. Pre-pandemic forecasts showed a one-half point decline in participation, matching the actual 2023 data. Detailed analysis shows that the age adjusted participation rate is a little higher. The core group, aged 25-54 population, also shows labor force participation recovery to relatively high pre-pandemic levels. So … there are demographic, racial, education, birth country, rural/urban, location and state differences in participation. There are opportunities for higher participation in a strong economy and labor market. However, the recovery from the pandemic is complete, reflecting this strong economy and labor market.

https://www.whitehouse.gov/cea/written-materials/2023/04/17/the-labor-supply-rebound-from-the-pandemic/

https://www.axios.com/2023/06/02/jobs-report-workers-prime-age-labor-force-participation

https://www.atlantafed.org/chcs/labor-force-participation-dynamics

One Page: Liberalism and Its Discontents – Fukuyama (2022)

Fukuyama defends “classical liberalism” as a political structure. Not US “liberals” or UK “liberal democrats” or neo-liberals. It was born in the 18th century, child of the enlightenment and religious wars, emphasizing the individual over the group, the equality of individuals, the human species rather than any subset, and practical political structures that provide reasonable results. Individual rights, rationality, human dignity, the rule of law, institutions, compromise and tolerance. Typically connected with objectivity, the scientific method and free trade versions of capitalism. The mixed economic and political systems that he celebrated in 1992 as the “end of history” when fascism and communism were defeated.

“Classical liberalism” is threatened from the right and the left. First, from the right with Reagan/Thatcher neoliberalism which elevates economic property rights as a super-value, undercutting other political and social values. Second, from populist, authoritarian leaders who are actively “illiberal”, campaigning against “free trade”, international bodies, immigration, elites and various “others”, discounting the value of institutions and the “rule of law”. Third, from the left as the progressive, new, radical left has adopted the postmodernist views that elevate “power” as the central political value/insight and claim that powerful elites always control society unless they are opposed by “marginalized” groups to lead a revolution against the dominant groups.

Fukuyama criticizes neoliberalism for being too extreme, opposing the role of government even where it is needed per elite opinion: some regulations, public investments, income redistribution, fiscal and monetary policy, international trade and development, public utilities, environmental externalities, etc. He challenges the notion that property rights are significantly more important than other “rights”. He agrees that the intellectual foundations for “classical liberalism” tend to result in a “thin” basis for morality and community, but argues that neoliberalism makes this even worse, ignoring the moral and community dimensions. He recommends that voters and politicians focus on improving the “quality” of necessary government services.

“Classical liberalism” was developed within a Christian religious and moral worldview, which provided the required moral and community dimension for their 18th century societies. However, Luther’s Protestant Reformation was radically individualistic, downplaying the church as an institution and elevating the individual’s reading of the Bible and personal relationship with God. Philosophers like Rousseau further elevated the role of the individual and criticized the potentially corrosive role of society. Philosophers like Kant developed frameworks that were independent of history and culture, using reason alone to develop morality. Fukuyama notes that a full-fledged individualistic society really grew after WWII, in the shadow of Darwin, Freud and Marx. He notes that John Rawls’ 1971 “Theory of Justice” provides an overly abstract approach to morality and politics, further eliminating the role of “community”. Fukuyama doesn’t have a simple solution to the individualistic imbalance in society.

Fukuyama invests two chapters outlining the development of the post-modernist philosophical and political worldview. 19th century philosophers like Nietzche declared that “God is dead” and that objectivity is dead. They tried to find a “subjective” basis for philosophy, rejecting the core tenants of “classical liberalism” and prior objective, idealistic models. Objectivity, causation and the scientific method were shaky foundations. Dynamic, organic, artistic, natural, revolutionary, evolving worldviews were proposed. After WWII this coalesced into the post-modernist approach. Post-modernism provided a new home for those who supported communism. The elites and power structure oppress the marginalized communities because “they can”. The intellectuals have the role of ensuring that the oppressed understand their abused role and work to overthrow the repressors. The parallel with Marxism is strong. Fukuyama admits that “power” is really important and that powerful people and institutions have used and sometimes abused their power. Yet, he points to the progress of “classical liberal” societies in providing economic success, making life better for poor and minority communities, expanding individual rights, providing a framework for progress, a forum for participation and safeguards against extreme policies or leaders, etc. Philosophically, he cannot support the singular emphasis on power or the subjective worldview. He claims that the “burden of proof” for overthrowing the “classical liberal” model remains on the critics.

Fukuyama leaves us with 10 principles: quality of government, inequality matters, federalism can help, freedom of speech is critical, privacy matters, the scientific method and rational problem-solving work, individual rights have a solid intellectual and historical basis, while group rights do not, the individual and group/morality both matter, civic participation matters and moderation is a virtue.

Good News: Franchising Opportunities

Today, 3,400 US franchisors support 800,000 franchisees with 9 million employees grossing $1.7 trillion of annual sales and 3% of US GDP.

https://www.franchisedirect.com/information/is-your-franchise-fit-for-the-us

Rationale

Franchising provides an opportunity for qualified individuals to own a business and earn equity-like rewards, without outstanding industry expertise, with lower business failure risk, requiring relatively modest equity investments and the opportunity for advantageous bank and small business loans.

Franchising provides the owner of a product or service concept with the opportunity to expand using “other people’s money”. It facilitates geographic and international expansion leveraging locally knowledgeable managers/investors. It allows differentiated products, services and systems to be replicated quickly and consistently. It provides legal agreements that ensure that the franchisor’s brand is enhanced and not damaged by the franchisee’s operations. It provides a system that strongly aligns the interests of local managers/owners with those of the central business.

History

Franchising has experienced several “boom and bust” periods, fraudulent deals and changing relations between franchisors and franchisees through time. Initial growth began in the 1850-1920 period together with the growth of the manufacturing and transportation industries. Automobiles, farm equipment, sewing machines, service stations, auto parts, pharmacies, soft drinks and train stop/car hop restaurants lead the way originally using the product franchising model. The depression interrupted the growth of franchising. Automobile dealers, service stations and soft drink distributors accounted for 80% of franchising before the depression.

Franchising accelerated again after WWII with fast-food restaurants leading the way, accompanied by a diverse set of laundry, hotel, rental car, real estate and convenience stores. These businesses were often still tied to products or patented equipment. However, McDonalds (1955) offered the first business format franchises which provided greater opportunities in a growing, travelling society.

Business format franchising “includes not only the product, service, and trademark, but the entire business format itself: a marketing strategy and plan, operating manuals and standards, quality control, and a continuing process of assistance and guidance.”

With rapid growth came accounting fraud by franchisors, one-sided contracts, overlapping deals, pyramid schemes and conflicts between franchisors and franchisees. The Energy Crisis of the 1970’s bankrupted a large share of service stations. State and federal regulations enacted in the 1970’s ensured that standard disclosure agreements were used, allowing potential franchise owners to work with their lawyers to ensure that they understood the deals they were making.

https://www.tasanet.com/Knowledge-Center/Articles/ArtMID/477/ArticleID/1251790/Where-It-All-Began-The-Evolution-of-Franchising

https://www.entrepreneur.com/franchises/entrepreneur-franchising-the-big-bang/66000

https://en.wikipedia.org/wiki/Franchising

Growth

Data on the franchising industry is not standardized. Two industry associations and the US Census Bureau provide somewhat inconsistent data. Nonetheless, the growth of franchising after the “bust” in the 1970’s is amazing. The number of establishments has grown from 375,000 (1973) to 420,000 (1988) to 530,000 (1990) to 775,000 (2021). Total employment has grown more slowly, from 7 million (1988) to almost 10 million (2017). Sales has grown much faster from $160 billion (1975) to $350 billion (1980) to $530 billion (1985) to $1 trillion (2004) to $1.3 trillion (2007) to $1.5 trillion (2012) to $1.7 trillion (2017).

https://www.latimes.com/archives/la-xpm-1990-09-27-fi-1859-story.html

https://www.entrepreneur.com/franchises/entrepreneur-franchising-the-big-bang/66000

https://www.census.gov/library/stories/2021/12/franchising-is-more-than-just-fast-food.html

Varied Opportunities

https://www.census.gov/library/stories/2021/12/franchising-is-more-than-just-fast-food.html

Leading sectors by annual earnings include senior care ($155K), real estate ($153K), personal services ($126K), business services ($122K) and pet services ($119K).

https://www.entrepreneur.com/franchises/the-highest-earning-franchise-categories-according-to/417572

Entrepreneur Magazine has been publishing its “Franchising 500” rankings since 1980.

https://www.entrepreneur.com/franchises/directory/franchise500-ranking

The fast-food restaurant industry remains the “killer app” for franchising.

https://www.statista.com/statistics/190330/employees-of-us-franchise-establishments-by-business-line-since-2007/

Franchisee Demographics

Strategic Emphasis in 2023

Sustainable resources; operations and marketing.

Nearer international and local supply chain sourcing.

Simpler operations and automation. Resilient, recession-proof.

Multiple brand retail locations.

Technology, digital operations.

Marketing/social media capabilities.

Home delivery services.

Personalized products and customer service.

Generation and minority group niche marketing and growth.

Fitness, health, and wellness services.

Home improvement services.

Food and restaurants recover.

Increasing role for multi-unit franchisees.

https://www.forbes.com/sites/forbesfinancecouncil/2023/01/04/franchising-trends-to-be-on-the-lookout-for-in-2023/?sh=969cf8949e91

https://www.franchising.com/guides/current_trends_in_franchising.html

https://www.linkedin.com/pulse/6-franchise-trends-watch-2023-teri-barber/

https://topfranchise.com/articles/trends-in-franchising-for-2023/

https://blog.gitnux.com/franchise-trends/

One Page: Why We’re Polarized – Klein (2020)

Trump’s 2016 election win was unremarkable statistically. He won the usual share of Republican voters in most demographic sectors and attracted extra non-college graduate white voters. Our political system has built an increasingly polarized electorate based on appeals to identity politics (red versus blue). We vote for our team or against the “other” team, setting aside our other concerns.

Both political parties contained liberals, conservatives and moderates in the 1950’s. The Civil Rights and Voting Rights Acts of the 1960’s broke the Democrats’ grip on the “solid South”. Regional, local, character, ideology and other factors mattered more to voters, politicians and parties through the 1990’s. By 2016 even self-identified independents were polarized, views of the “other” party dropped from 45 to 29 degrees and 43% of partisans saw their opponents as a “threat to the nation’s well-being”.

Voters and political parties are increasingly aligned by a single conservative to liberal dimension, with other dimensions of identity running in parallel: race, religion, region, urban/rural, and gender. This builds on the personality trait of openness, fluidity, and tolerance of threats.

Individuals are inherently attracted to group membership, like sports teams and easily oppose other teams and seek to win. As the two major political parties began to clearly sort on the “left versus right” dimension by the 1980’s wise political actors clarified the differences between the two parties in extreme terms. Political messaging is simpler, more extreme and more effective in this environment. Group identity and membership trumps facts, science, beliefs, thinking, policies, and detailed ideologies.

Rational individuals outsource politics to parties and politicians. Individuals adjust their views to match the views of the parties and politicians. More politically engaged individuals are more easily influenced. Higher knowledge and skilled individuals use their talents to challenge the opposition but not their own party’s views.

The decline of cultural and political power held by White Christians due to demographic changes has encouraged conservatives to emphasize traditional values and liberals to emphasize diversity. President Obama’s presidency punctured the “post-racial myth”, as the country became much more divided on racial issues. The cultural power of media, university and corporate elites and institutions threatens some conservatives while increasing Republican political power and actions threaten some liberals.

Modern journalists and media compete for attention. They are biased towards “loud, outrageous, colorful, inspirational and confrontational”. They reinforce the cycles of polarization, mostly leaving behind historical norms of objectivity and balance. More information and choices have not helped media consumers to better evaluate parties, politicians, messages or issues.

Polarized voters and media outlets have combined to make elections be based on national parties and wedge issues. Political candidates focus on these issues and raise more money from small donors, independent of the wishes and interests of political parties which tend to be more moderate, optimizing their chances of winning competitive districts. Gerrymandering, rural/urban political sorting, direct primaries and fundraising have undercut the power of political parties.

A polarized country, roughly evenly split politically, leads political actors to focus more than ever on “winning”, decreasing the role of norms, tradition, civility, pragmatism, patriotism and institutional preservation. The emphasis on national issues reduces the incentive and scope for transactional, local based politics, log-rolling, earmarks, and compromise. By 2012 the radicalization of the Republican Party was complete with Democrats not far behind. Klein uses former Attorney General William Barr’s words to highlight the increasingly expressed Republican view that they are fighting a war to preserve their culture from extinction by the secular elites of the other party. He doesn’t describe the coastal Democrats complementary view of a Trump-led nation.

Solutions

Agree to move some issues beyond politics: debt ceiling approval, longer-term budget program approval. Improve political system legitimacy: cut bias of electoral college overrepresenting rural voters through changes or the Popular Vote Compact. Use independent commissions to draw election districts. Eliminate the Senate filibuster. Award DC and Puerto Rico congressional representation. Consider a multi-party-political system and multiple seat districts and ranked choice voting. Increase the size of Supreme Court and make some appointments outside of politics. Reduce the Speaker of the House’s total control of the legislative agenda. Make everyone aware of their “political identity” and how media and politicians use this to persuade or control. Proactively choose, evaluate and challenge media sources. Invest time in politics, especially state and local politics.

Good News: Exceptionally Low Metro Area Unemployment Rates

The overall US unemployment rate at 3.6% remains at a 50-year low. The metropolitan area rate is a shade lower. I summarized metro area unemployment rates for those which have a city in the top 100 of population. Only 73 metro areas remain, since 27 cities are the second or smaller city in their metro areas. The average metro area unemployment rate for these top 100 areas is 3.4%. The median metro unemployment rate is 3.3%.

Democratic mayors led the main cities in two-thirds of the largest metro areas. Republicans, independents, nonpartisans or split results led in the remaining one-third (24/73).

Democratic mayor lead metro areas have median and average unemployment rates at 3.2%, significantly below the national 3.5-3.6% rate. The Republican+Other metro areas show 3.4% median and 3.9% average unemployment rates, just slightly higher.

The claim that Democrats are “bad” for the economy is not supported by this data.

Republicans and independents/nonpartisans/split mayors lead 8 metro areas with unemployment in the historically unheard of 2% range:

Denver, Colorado Springs, Omaha, Tulsa and Oklahoma City in the prairie states. Miami, Virginia Beach and Honolulu complete the set.

Non-Democratic mayors also lead 8 southwestern cities with higher-than-average unemployment (4%+): Reno, Las Vegas, Laredo, Corpus Christi, Riverside, Stockton, Fresno and Bakersfield.

Only 5 Democratic lead cities, versus 8 Republican/Other cities, had 4%+ unemployment rates in May, 2023: New York and Los Angeles, Houston, El Paso and New Orleans.

31Democratic mayor lead metro areas had strong 3% unemployment. 13 boasted amazing 2% unemployment rates: Boise, Lincoln, Nashville; Madison, Minneapolis-St Paul; Jacksonville, Tampa, Orlando; Richmond, DC, Boston, Baltimore.

Summary

Metro area unemployment is even lower than the 50-year low national average.

Democratic led metro areas have slightly lower unemployment rates.

We have 6 large metro areas with 2.5% or lower unemployment: Lincoln, Madison, Omaha, Boston, Baltimore and Miami.

Our very worst metro areas (of 100) are El Paso, Corpus Christi and Laredo at 4.5% and Las Vegas (5.6%), Stockton (5.9%), Fresno (7.5%) and Bakersfield (8.6%).

The American economy is delivering truly amazing results.

https://www.bls.gov/web/metro/laummtrk.htm

https://ballotpedia.org/List_of_current_mayors_of_the_top_100_cities_in_the_United_States

Are We Heading Towards 2% Inflation?

The overall CPI index increased smoothly during the last 30 years until the pandemic. The Great Recession created a small blip up and down. Prices have recently increased by a very large 15% in less than 3 years versus the usual 5% in that time.

From June, 2020 through September, 2021 annual inflation jumped up to 5%. In the 9 months from October, 2021 through June, 2022, annual inflation spiked up to 10%.! This was mainly driven by durable goods prices as the unexpected rapid recovery from the pandemic encouraged consumers to buy “stuff” since they could not buy services. Since July, 2022 annual inflation is CLEARLY much lower, just 3% to 4% depending on the exact months chosen. Inflation appears to be decelerating as the May, November and May indices are 291, 299 and 303. The last 6 months’ inflation is just two-thirds of the prior 6 months.

Unfortunately, the core inflation measure, excluding food and energy, remains near 5%.

Energy prices have fallen quickly from their peak in June, 2022.

Auto gas prices are volatile, determined by the global oil market. The spike from $2/gallon to $4.50/gallon impacted American consumers. The return to $3.50/gallon is welcome, but prices are still 50% higher than the 2015-20 period.

In 25 years, durable goods prices had dropped by 25% due to globalization. In 2 years, they spiked up by 25% as global manufacturers were unprepared for the rapid recovery in demand. Manufacturers, wholesalers and retailers have NOT given back any of that 25% increase in prices, but durable goods inflation has returned to zero.

Nondurable goods followed a similar pattern with a 19% increase followed by flat prices.

The services sector experienced mild inflation during the first 18 months of the pandemic, but has increased to a 6% annual rate as businesses re-established their business models and labor supplies. This sector has slowed to 5%, but remains the greatest concern for reducing the overall inflation rate.

Medical care inflation remains at its 20-year level of 10% or more per year. As medical care has grown significantly as a share of the economy, it’s inflationary disease further infects the economy. Labor shortages play a minor role in this industry. The lack of competition or other incentives for real productivity improvements (Baumol’s disease) drive massive inflation even as US health results such as lifespans decline.

Transportation includes both durable goods and energy prices. A 25% price increase before it flattened off.

The used car and truck market experienced 50% price increases when the new car and truck pipeline was disrupted. Once again, prices have flattened, but not declined significantly to return to the pre-pandemic level.

Housing inflation jumped up from 2% to 7% as the pandemic and subsequent Federal Reserve Bank mortgage interest rate increase disrupted the housing construction market. While housing inflation has declined from its peak, the long-term imbalance between supply and demand predicts some future inflation.

The 40% spike in home values was even higher than that shown for durable and nondurable goods. Flat prices make sense for the next year or two.

The jump in imports was driven by the increased demand for durable goods.

Producer prices were flat for 10 years, then up by 30%. No inflation remains, but some deflation is possible.

From 2015-20 historically high demand for labor drove a 7% increase in real wages as unemployment reached a 30 year low of 3.5%. For the last 3 years wages have trailed inflation. No wage-price spiral.

https://bipartisanpolicy.org/report/deficit-tracker/

Until February, the federal government budget deficit had returned to the pre-pandemic 2019 pattern. In the last 3 months spending has accelerated, adding to aggregate demand and causing the economy to expand faster, perhaps beyond its limits, supporting greater price inflation.

The government response to the pandemic threat generated much greater savings and subsequent spending/aggregate demand than any recent recession situation. The benefits have now mostly run out. Consumer demand has remained high but will likely decline.

The unprecedented expansion of the money supply by the Federal Reserve Bank in 2020 is difficult to explain or analyze. The Fed responded to the clear risk of a banking system collapse by providing “loose money” access to all entities. This monetary expansion did not result in immediate consumer inflation, but it did help to inflate asset prices: investments and housing. The Fed has begun to reduce its holdings of assets as it tries to increase interest rates.

The Fed has more than doubled interest rates. This has slowed down the housing, stock and acquisition markets.

Corporate profits tripled from $500 billion in 2000 to $1.5 trillion in 2007. Profits slowly grew up to $2.0 trillion by 2019. Profits spiked by another 40% in response to the pandemic opportunities.

The drivers and components of inflation mostly point towards lower inflation in 2023 and 2024. The Fed is going to increase interest rates again this year which will reduce housing starts and corporate capital and inventory investments. The economy has so far resisted the higher interest rates, but the cumulative impact of tighter credit and lower savings will eventually offset the optimism of a historically positive labor market.

Summary

The pandemic caused producers to initially reduce their productive capacities. The unexpected rapid recovery of demand prompted by loose monetary and fiscal policies caused demand to greatly exceed supply. Inflation peaked at 7% and then began to drift back down. Corporations took advantage of the disruption to sharply increase prices, which have now flattened but not declined. Excessive fiscal policy (budget deficits) and high consumer spending driven by extremely tight labor markets driven by historically high corporate profits have maintained aggregate demand and prices.

There is a “tipping point” situation in this economy. The Fed is increasing interest rates. This is slowing consumer borrowing and housing demand in the face of demographic factors that normally promote new household formation and the economic benefits that typically accompany this investment. Consumers are using their pandemic driven savings to consume but are now running out of savings. The stock market very quickly recovered from the pandemic, but then declined and has since partially recovered based on a narrow set of AI based tech companies. The banking and credit sector is at risk, with several high-profile bankruptcies, but no clear evidence of a panic. Corporations are earning record profits, benefitting from prior low-cost debt, but struggling to hire employees. Overall, I think that prices will fall back to the 2% level by the middle of 2024.