

The relationships between firm size, age, growth, survival, death, locations and job creation and retention are many, complex and politicized. However, the core relationships expressed in my 2 recent posts are well supported by data and theory. I’d like to share more background information.

The 10-year job survival rate for startups is roughly 80% and has improved in the last 10 years. However, the FIRM survival rate is much lower. The surviving firms, through economic natural selection, grow rapidly from a low (4 average employees) initial base.

This study of 2011-14 highlights the initial start-up job surge, followed by 10 years of net job attrition and then modest net job growth by mature firms when low firm death rates (5%) are exceeded by decent levels of net jobs added.
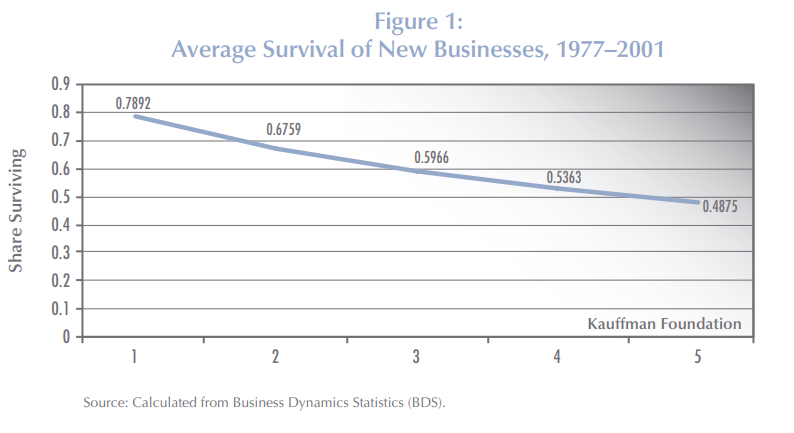
The Small Business Administration (SBA) reports the average firm survival rates for 1994-2019 as roughly two-thirds for 2 years, one-half for 5 years, one-third for 10 years and one-fourth for 15 years.
My review of the 10-year data confirmed the 33% rate for most of the period, with an increase to 36% for firms that began after the Great Recession in 2010-12.

https://www.chicagobooth.edu/review/surprising-numbers-behind-start-survival-rates
This post-recession improvement was widespread, across most industries.
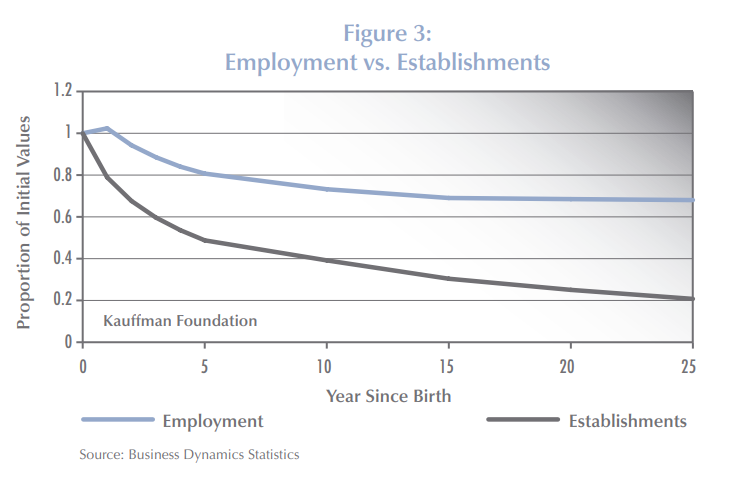
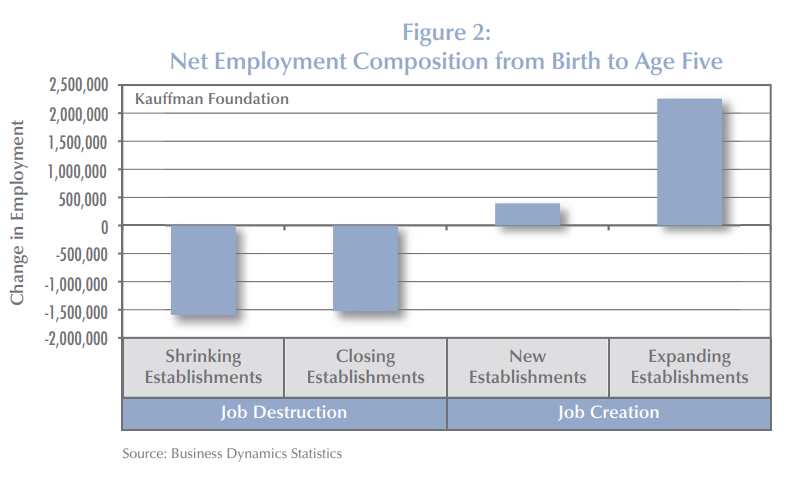
In 2010, Kauffman Foundation researchers summarized the detailed Business Dynamics Statistics (BDS) data, showing the relatively slow decline in net added employment from 100% initially to 80% at 5 years to 70% at 15 years and the rapid decline in the surviving firms rate to one-half at 5 years, 40% at 10 years and just 20% at 25 years.


Another Kauffman report from 2010 shared similar results. The universe of firms is dominated by young firms because the cumulative attrition makes “mature” firms quite rare.
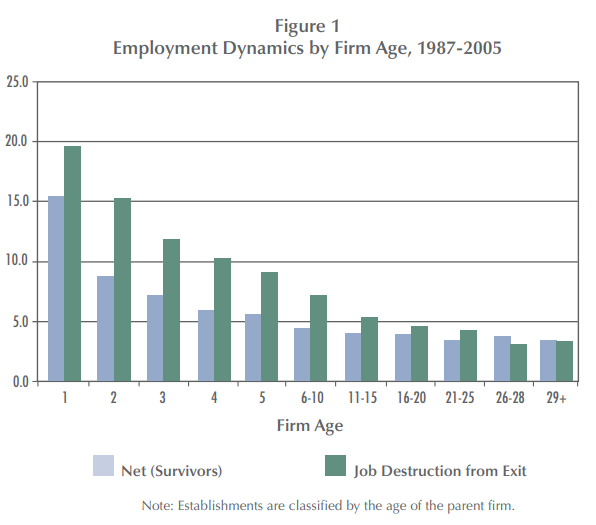
Another Kauffman report in 2009 summarizes this competition between dying firms killing jobs and surviving firms adding jobs. In the first 5 years, the firm failure rate is so high that it overwhelms the high job growth rate of those successful startups. In years 6-10, the death rate is still winning, but the total net job destruction is much smaller. For this 18-year data set, firm deaths exceed added jobs at every age, although 29+ year-old firms basically break-even. This is a critical insight when thinking about the claim that all or nearly jobs are added by startups. It is “true” due to the firm survival and jobs added rates at different ages. It is possible to have quite different results, with existing firms accounting for relatively more jobs, but that would require either the firm/establishment death rates to fall or the job creation rates of surviving firms to increase significantly. It looks like there has been some of that change after the Great Recession. This chart also helps to show that the “net, net” addition of jobs from start-ups, when considered as the sum of their first 5 years is in the 75-80% range, because the net jobs lost in those early years is only 5% per year, despite the more rapid loss of firms.
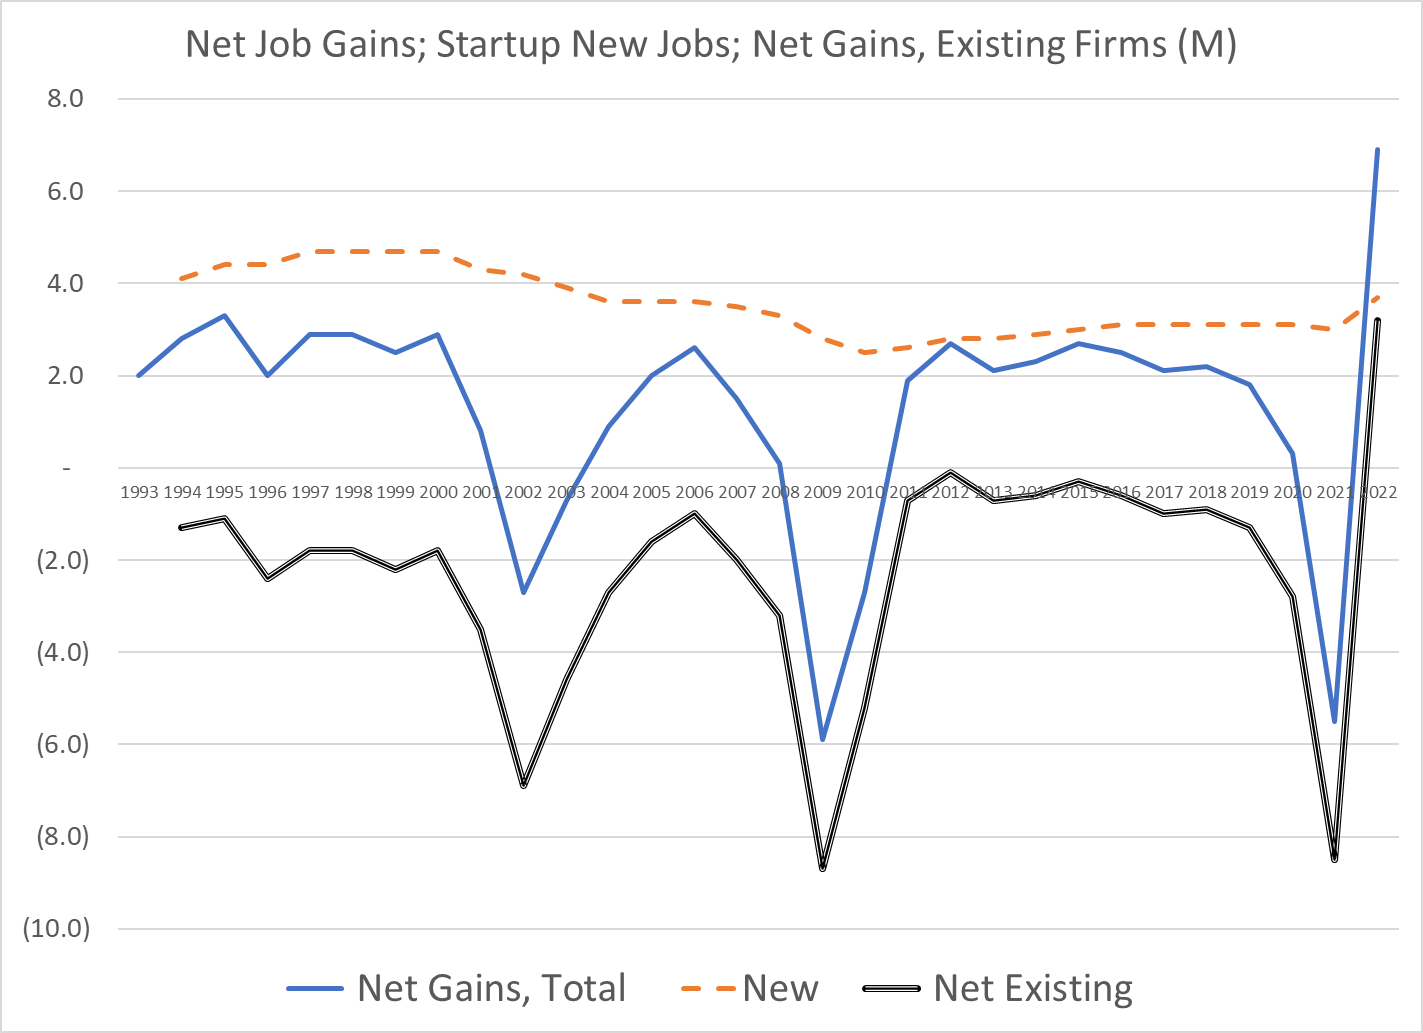
My summary of the last 30 years of data shows that startup firms do account for “all” new job growth. As others note, in a way this is almost “by definition”, because this is the only age group that only has “adds”, but no “losses”. It always must be positive. As we’ve seen in the details on job departures/hires, jobs created/lost, firms created/lost and establishments created/lost the positive and negative flows tend to be “roughly equal”. Hence, even a single year which is not burdened with an offset will stand out as the “big winner”. So, on the one hand we can discount the critical, essential, vital role of startup job creation, but we can’t ignore it. It is a necessary part of the life cycle of firms that delivers a growing economy.

The 2010 Kauffman study combined the initial jobs created with the jobs lost in the next years to emphasize the vital role of startups, using 2007 data. Mature firms also made a small contribution to jobs added.

Click to access size_age_paper_R&R_Aug_16_2011.pdf
A follow-up report in 2011 by Dr. Haltiwanger summarized the data slightly differently but tells the same story. New firms, nearly all “small”, account for almost all job growth. Other small firms destroy jobs in their first 10 years at a high rate and as mature firms at a modestly high rate. Middle-aged firms lose jobs while successful firms grow to more than 500 employees and become large firms! Young large firms add a few net jobs. Old large firms lose a small percentage of jobs for this time period (1992-2005).
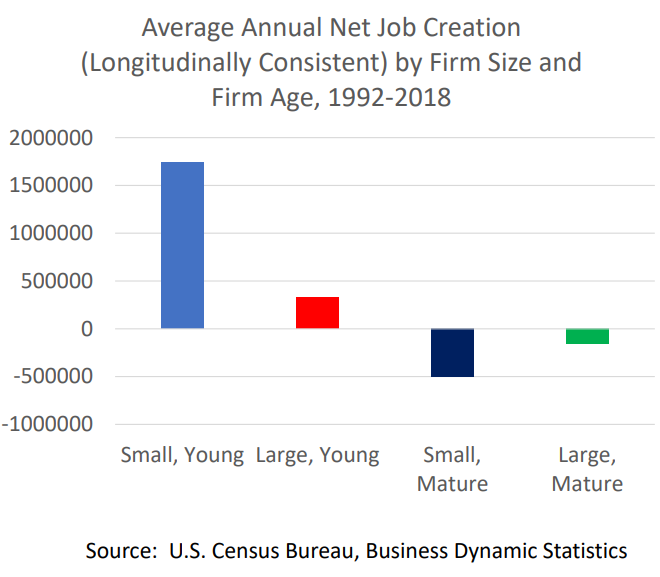
The same author updated the calculation with more recent data and found the same basic results.

The central takeaway remains valid with more recent data across industries. The initial growth of jobs is not offset by the net losses in the next 5 years. Firms more than 6 years old do not add jobs overall.

A different set of data indicates that about one-half of net jobs added come from firms with 250 or more employees.
Another analysis indicated that nearly all added jobs were at “middle market” firms rather than startups.
I don’t know how to reconcile these competing claims but expect that the time periods chosen, and firm sizes chosen, are keys to understanding the significantly different claims.

https://www.bls.gov/spotlight/2022/business-employment-dynamics-by-age-and-size/home.htm
The most recent BLS report shows that startups and large mature firms add jobs.


Click to access size_age_paper_R&R_Aug_16_2011.pdf

Kauffman also created a complete theoretical model of job changes through time based on the key parameters and demonstrated that the model was a good match with the observed relative consistency of the parameters and the net output of jobs created. In a prior life, we called this the “layer cake” graph, using it to explain the composition of revenues or profits in a business based upon the year of customer contracts signed or new products introduced. At any point in time, there is a history of additions of various ages. Employment tends to decline over time based upon the combination of firm deaths, establishment gains/losses and internal job growth. Each year a new group of firms is added, all with job gains in the first year. This group too follows the pattern of job erosion in the first 5 years, smaller erosion in the next 5 years, close to break-even by age 20 and small net job creation for the mature surviving firms. Again, the parameters could be different, and the results would be different. But this framework provides economists and statisticians with the tools to analyze the components.
Another author created a dynamic model which illustrates how this process works through time.
https://www.cbpp.org/blog/startups-fuel-job-growth-animated

The Small Business Administration promotes the view that small businesses (less than 500 employees) are essential to the US economy and create a majority of all jobs. As noted above, startups are the key. Size is a byproduct.


https://bipartisanpolicy.org/blog/trends-in-new-business-creation/
In my earlier post I discounted the importance of the decline in the share of new to total firmsbecause the corresponding decline in failure rates and improved job creation by mature firms was still delivering solid annual job creation. However, this warning signal is worth monitoring together with the other measures. The Brookings Institution provides some other “warning signals” about the health of the new firm/job creating capacity of the economy in light of reduced measurable competition in many industries (a topic for another day).

Startup rates are down in most industries.
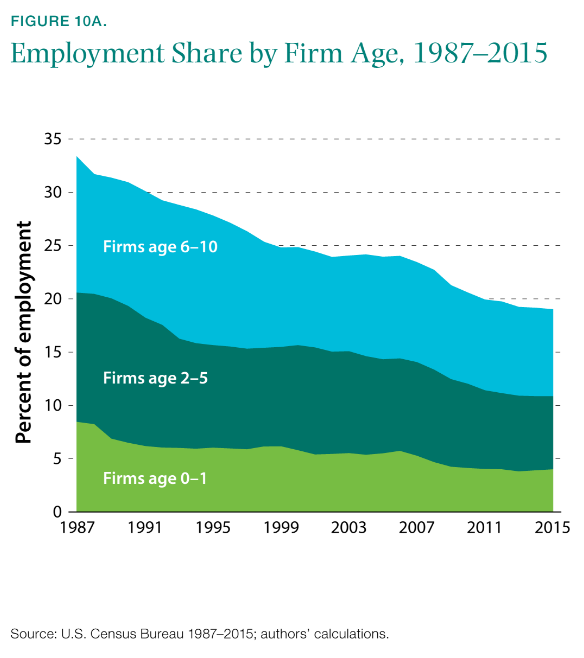
New firms account for a smaller share of total employment.

Business formation takes longer. Recent Kauffman reports shows that this trend has continued.

The entrepreneurship rate of college educated Americans has fallen most significantly.
One professor analyzed this and concluded that it was the result of American firms taking advantage of the low cost of capital and paying the higher salaries and incentives needed to attract and retain high potential employees. He says that job creation is happening more in existing firms and less in startups with no negative overall effect. He says that “marginal” (low return) entrepreneurs have been removed with little negative impact on the economy as a whole.
The slowdown in the new firm/job creation rate after the Great Recession attracted much attention from the media and politicians. Two representative articles are listed below, mostly bemoaning the decline of startups/small firms and the relative growth of large firms.
With the renewed emphasis on small firms and public policy to support them, others have responded by emphasizing the benefits of large firm growth and questioning the need to support/subsidize small firm growth.
https://thereader.mitpress.mit.edu/small-business-job-creation-myth/
https://hbr.org/2016/06/do-startups-really-create-lots-of-good-jobs

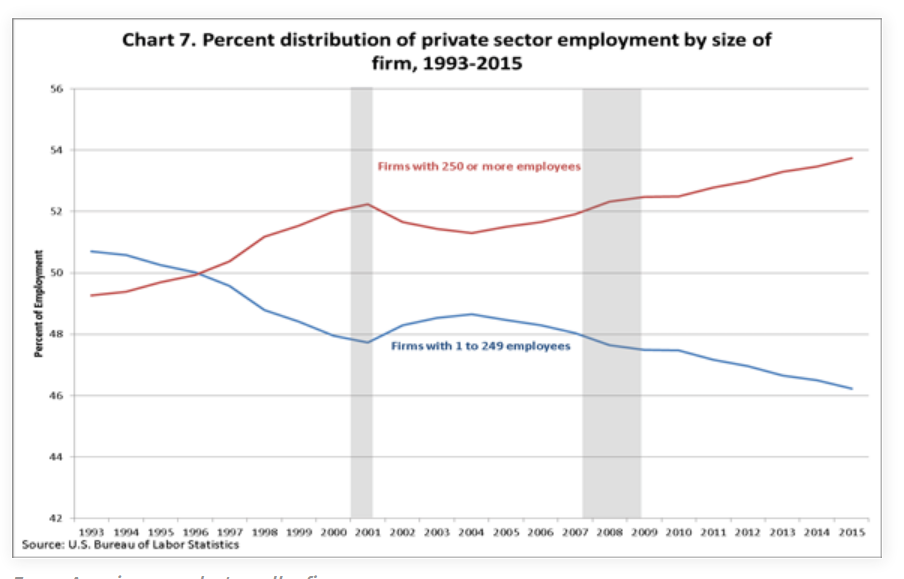
Using less than 250 employees to define “small business”, this article shows a 4% decline in small business share and 4% increase in large business share.

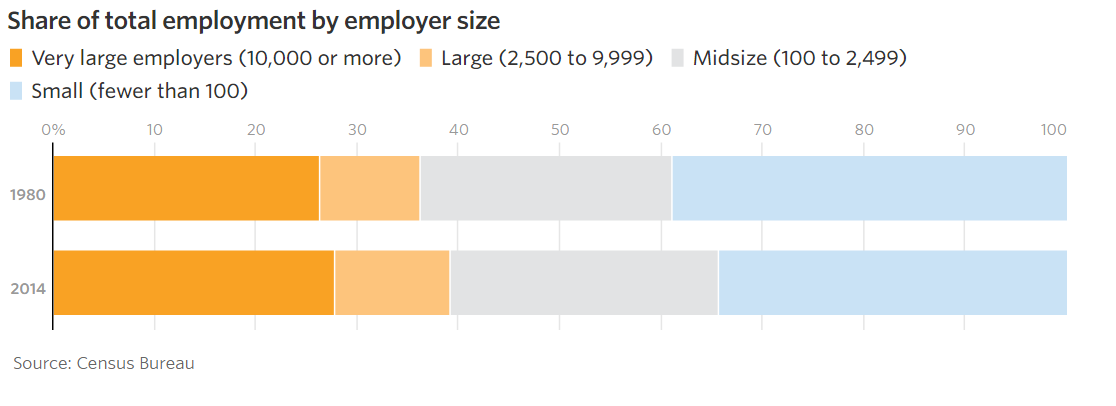
https://www.wsj.com/graphics/big-companies-get-bigger/
The Wall Street Journal reports that there are now more employees at very large (2,500+) versus small (<100) firms.
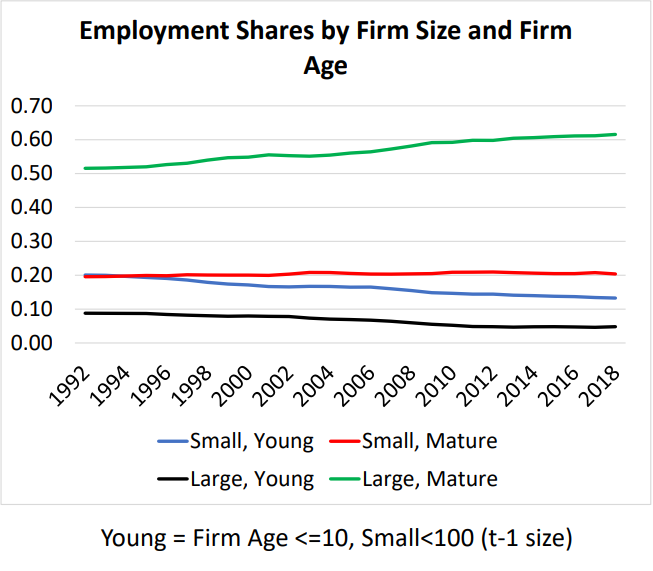
Professor Haltiwanger reports that large, mature firms have increased their share of total employees from 50% to 60% between 1992 and 2018. Both large and small young firms have lost offsetting market share.

A recent Census Bureau article documents the increased employment share of older firms (6 years+) in many key industries.
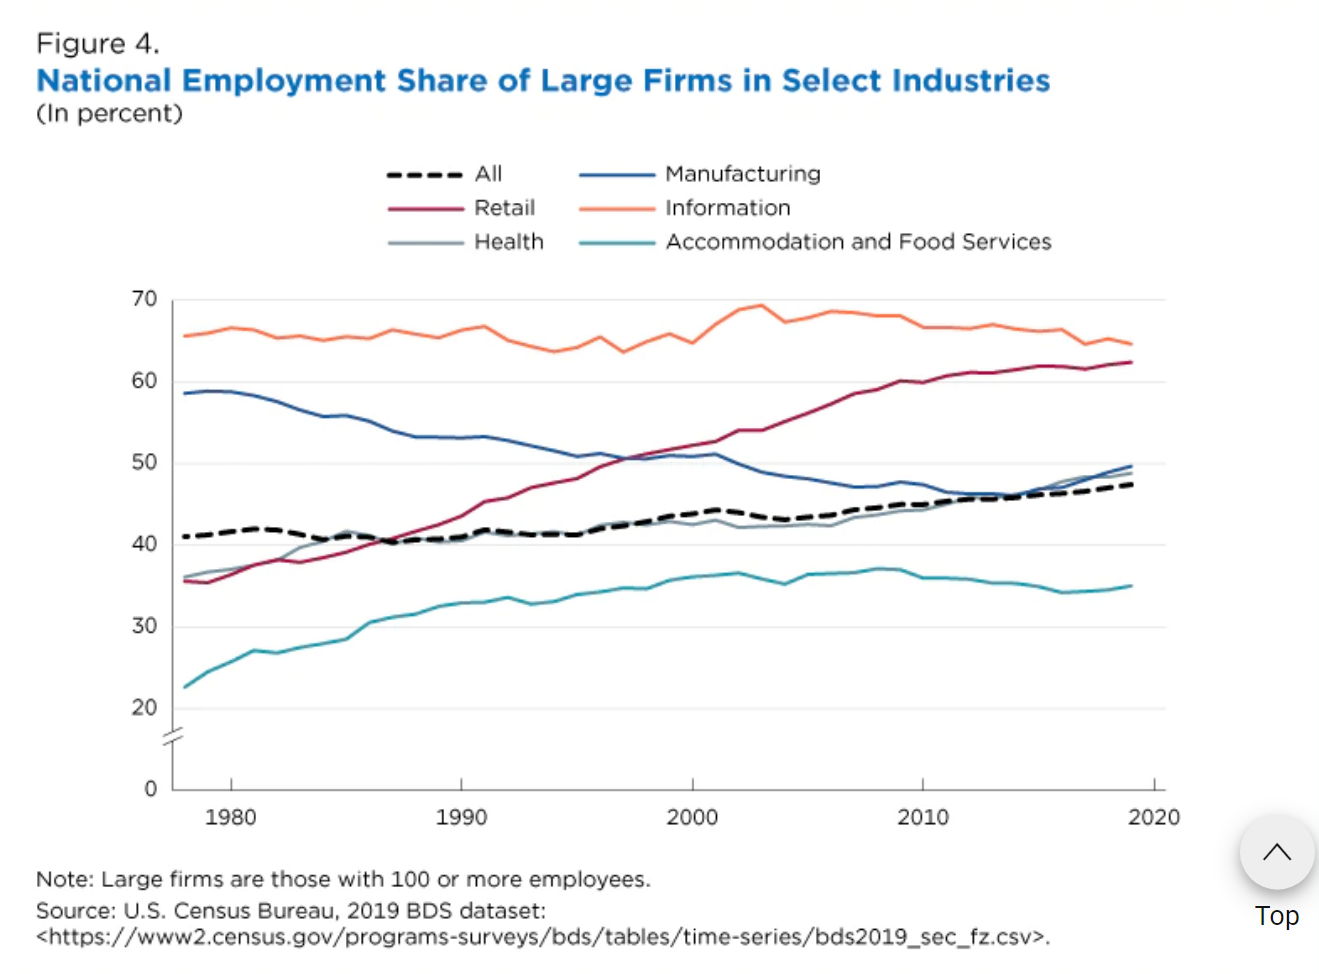
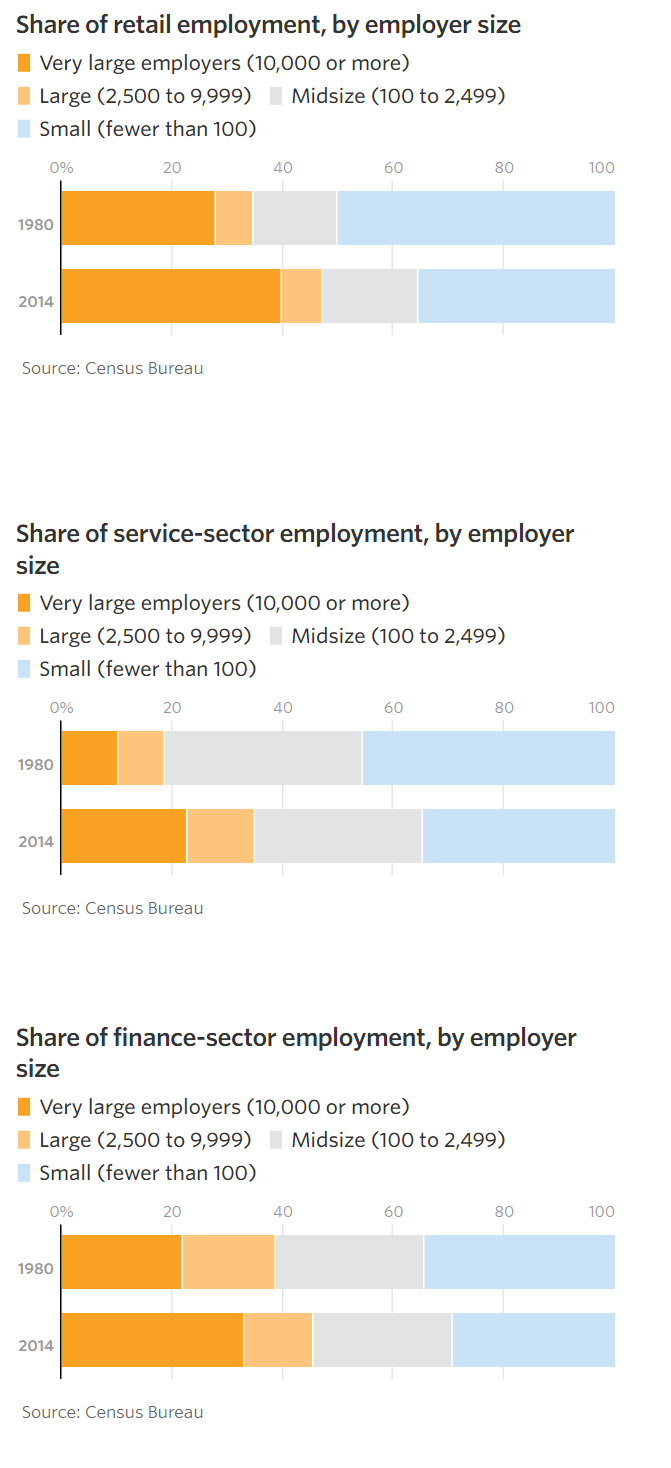
It also highlights the increased concentration of workers in large firms in the retail, health care, accommodation and food services sectors.
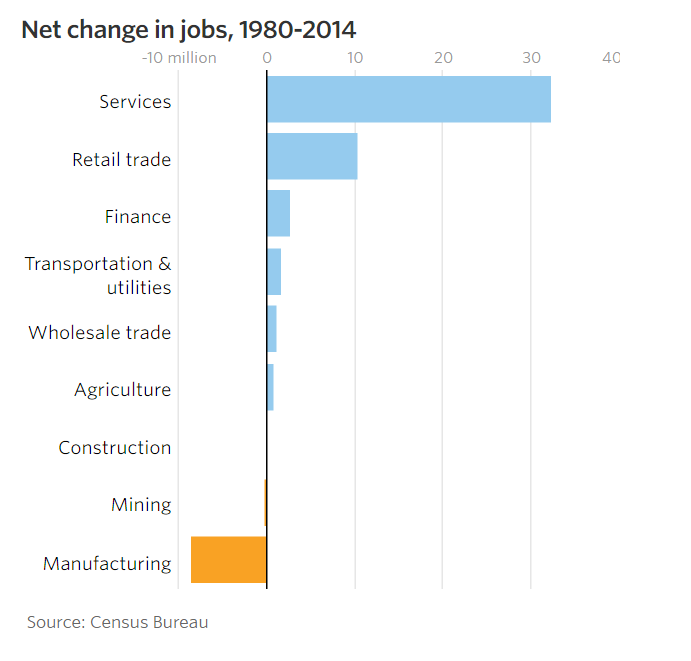
The WSJ articles itemizes the increased concentration of employment in large firms in the retail, services and finance sectors and documents that these are the growing segments of the economy.
Summary (It’s Complicated)
The Business Dynamics Statistics database provides researchers with the consistently defined and reported data since 1977 to document the key role of startup firms in adding net new jobs to the US economy. Startup firms are one part of an ecosystem of firm, establishment and job creation and destruction that plays out through time in relatively predictable ways. The death rates of young, middle age and mature firms play a similarly important role. The growth and decline of new establishments in existing firms matters. The internal job growth rates of young, middle age and mature firms matter. The relatively small size of startups compared to mature firms has an impact on job growth. Historical parameters are generally similar and change slowly, causing the layers of employment by firm age to be similar in this 50-year period. The model and framework for measuring firms, establishments and jobs is solid. Startup firms are essential, but they are not the only driver of success.
“Jobs created by firm size” is similarly shaped by all of these factors which describe the typical firm life cycle. Small firms are not superior job creators. New firms are job creators, and they happen to have small individual employment levels (4 on average), so small firms have higher measured rates of job creation.
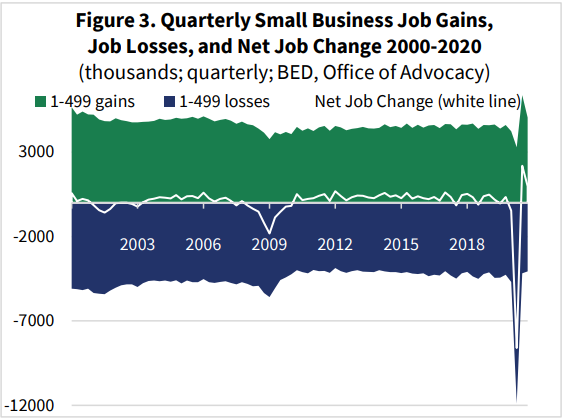
In the last 10-20 years there has been a significant decline in the rate of new firm creation as a share of total firms. New firms created have not lost as many jobs due to firm deaths in their first 5-10 years. Mature firms continued to shed a disproportionate number of jobs during recessions, but after the Great Recession began to add more net jobs due to internal growth than they had in the prior 40 years. The overall number of jobs created has remained in the 2-4 million per year range across the 50 years.
The conservative SBA, Kauffman Foundation, WSJ and Republicans promote policies to ensure a thriving entrepreneurial environment for new and small businesses. The more liberal Brookings Institute, college professors and Democrats have an instinctive distrust of big business and concentrated economic power, so also lend support to some pro-small business policies. If job creation falters during periods of economic prosperity, this may be a rare place where bipartisan agreements could be reached to promote new firm and job creation.

[…] Exceptionally Low Metro Area Unemployment Rates Are We Heading Towards 2% Inflation? Firms and Jobs 3: It’s Complicated Good News: Firms and Jobs Good News: US Startups Still Create Many Jobs (!!!) Good […]