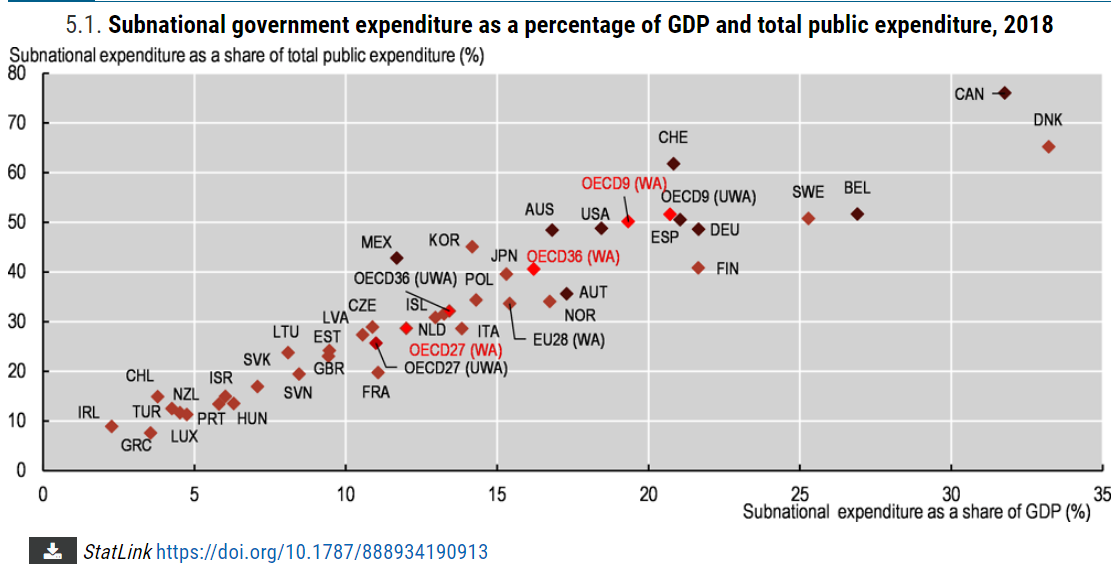
One-half of US government spending is managed at the state and local level. Only 3 OECD (developed economy) countries have a higher share at the local level. The median level is one-third of the total and some countries limit local spending to just 10-20% of the total. The US federal government model ensures that a significant share of government is managed closer to “the people”, which is even more important today with 330 million people than it was 200 years ago.
State and local expenditures as a percentage of GDP is 19% for the US, on the high side compared with other OECD nations as expected based on the 50/50 local/national split.
Government employment is even more concentrated at the more responsive state and local government level. State and local government employees comprise three-fourths of total government employment. This total increased from 21 to 23 million across 20 years while total US employment grew from 132 to 152 million. The share of government to total employment eased down from 16% to 15%. Note that this is much lower than the 38% government share of GDP.
The share of total government spending to GDP is the most important ratio to track. Since the 1960’s the federal government has moved spending responsibilities to the state for many programs. Spending drifted up to 25% of a growing post-war GDP by 1966. The Vietnam War and the Great Society programs pushed this up to 29% in 1975. The oil crisis, Japanese competition, inflation and recession pushed it up to 32% in 1976. Spending was still 33% of GDP 30 years later in 2007. The Great Recession drove spending up to 40% of GDP and then it declined back to 34% in 2014. State and local government spending has been relatively constant since 1976.
States and local governments routinely deliver solid budget surpluses in normal years and greatly exceeding the deficits encountered in recessionary years. State and local governments rely more on property and sales taxes which do not vary as much as income taxes. States have proactively reduced spending budgets whenever they have encountered recessions.
States have built up a nearly 3 month cushion of reserves to buffer recessionary periods. States and local governments did much better during the pandemic recession than anyone expected. They reacted quickly to ensure fiscal stability and found ways to put the federal government transfers to good use. Some states have provided rebates to their taxpayers.
State and local governments have continued to accumulate valuable assets, especially in the last 10 years.
States have generally improved their credit ratings since 2006, before the Great Recession. At that time, 9 states had the very highest AAA rating. 39 held very strong AA ratings. Just 2, Louisiana and California held “upper medium” A ratings. Recent data shows 7 more states, for a total of 16, at AAA ratings. 29 have strong AA ratings. 3 are at single A: Pennsylvania, Connecticut and Kentucky. 2 have fallen a step lower to BBB: Illinois and New Jersey. The median rating has improved from AA to AA+.
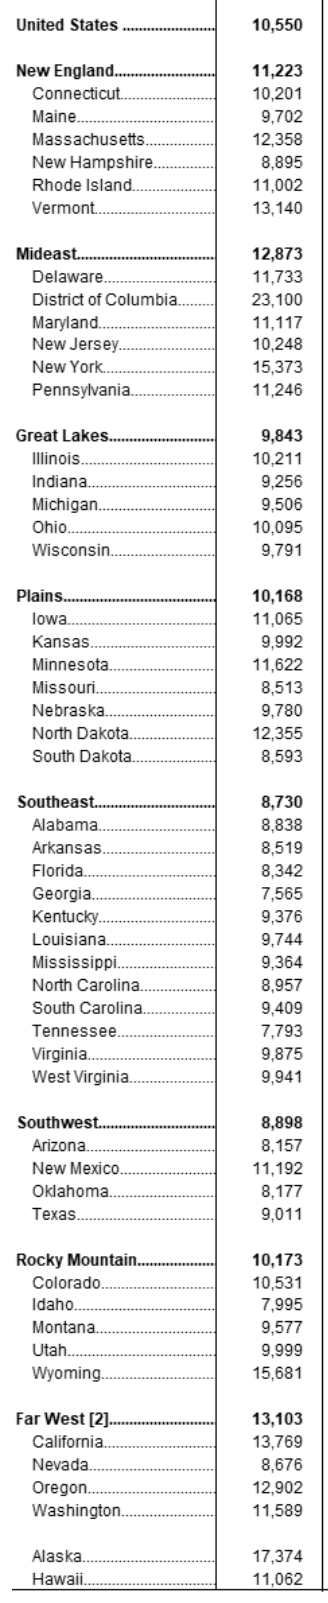
State and local government spending per capita varies widely, reflecting local preferences. The mideast and far west are 15% above the national average while the southeast and southwest are 10% below the national average.
State spending varies even more widely. The national average is $6,900 per capita. California is 12th highest at $9,000 but neighbor Washington is much lower at $7,000 (26th). Massachusetts is also at $9,000 but its neighbor New Hampshire is at a very low $5,000 (46th). New York is lower than might be expected at $8,600 (15th). Nearby New Jersey, Pennsylvania and Virginia spend $7,200-7,500, a bit above the national average. Michigan, Ohio and Illinois spend less than the national average at $6,100-6,300, but nearby Indiana ($5,500), Kentucky ($8,500) and West Virginia ($10,300) have much different priorities. Georgia ($5,700), Alabama ($6,300) and Mississippi ($6,700) spend less than the national average. Texas spends only $4,700 per capita (48th) while its neighbor Arkansas spends $9,200 (10th). Florida is the lowest spending state at just $4,000 per person, an amazing 42% less than the national average.
Another way to look at these differences is to compare the spending of 5 states. Rhode Island $10,400 (6th), Kentucky $8,500 (16th), Washington $7,000 (26th), Colorado $6,200 (36th) and New Hampshire $5,000 (46th). Rhode Island spends twice as much on state government than New Hampshire, a few miles away. This is the range in the US, reflecting vastly different local priorities.
Summary
In our federal system, state and local governments are called upon to manage one-half of total government spending. They routinely deliver budget surpluses and adapt during recessions, even the pandemic driven recession. They have accumulated significant real and financial assets to buffer difficult times. They have managed pension liabilities appropriately and improved their bond ratings and ability to borrow. They have taxed and spent to match local preferences. In aggregate, their spending has remained at the same percentage of GDP for many years.
Florida governor and presidential aspirant Ron DeSantis decided that my alma mater, 700 student New College in Sarasota, Florida needs a makeover. He appointed 6 new trustees and expressed his desire for the publicly funded liberal arts college to be overhauled to better provide for the public good and to eliminate “woke” policies, practices and culture.
New College was founded in 1964 as an alternative private college with an innovative program of study emphasizing personal responsibility for learning using all available resources without the usual bureaucratic constraints. Private New College was folded into the University of South Florida in 1975 and eventually set up as New College of Florida, branded as “the honors college” of the Florida state university system. New College’s very low student faculty ratio (7-1 to 10-1) has made it an inherently costly investment. In 2021 Florida politicians introduced bills to fold it into some other state university. A new president was hired in 2021 to help the small college re-evaluate its academic, financial and political strategies in order to re-establish its long-term viability.
The college has continued to attract very high potential students, its graduates have a truly enviable record of graduate and professional study and fellowships, but its 5-year graduation rate is low versus comparable schools and its graduates disproportionately pursue academic, not-for-profit, small business and other non-traditional career paths so that the average measured financial success of graduates is not competitive with schools which produce students who pursue more conventional professional careers.
I hope that the 6 new trustees will invest some time to analyze the “current state” before seeking to overhaul, makeover or revolutionize the curriculum, culture, faculty and leadership. I believe that there is a large overlap between what really matters at New College historically and today and what conservative leaning Florida politicians, citizens and voters value.
The Individual Matters
New College curriculum and culture emphasize the central role of the individual in making life choices.
Personal responsibility for the student’s program of study is at the heart of the curriculum.
Freedom of thought is honored. Left, Right or Center. Various shades of left.
Humility. Great thinkers among classmates, professors and writers. Chances are good that your views are not “simply the best”. In a post-Freudian world we only “know” so much. Many have a “piece of the truth”. Pride is risky.
Authenticity. Consistency. Self-awareness. Embracing feedback and interaction.
Ideals Matter
Ideals matter. The unexamined life is not worth living. Politics, community, philosophy, religion and spirituality matter. Dead serious. It’s important to proactively explore options and make choices. Evaluate choices versus experience, data and new frameworks, paradigms and world views. Individuals are responsible for developing personal philosophies.
Growth and Learning Matter
College provides an opportunity for tremendous learning in many dimensions. So much to learn. Consider all possibilities. Personal quest. No limits to growth. The journey matters. There is no end to growth and learning, so develop those skills. “Still there’s more”. Embrace feedback and interaction, even when it hurts.
Community Matters
Community of learners and seekers of knowledge, wisdom, truth, beauty and meaning. Small scale community where “everybody knows your name”. Forced to interact and be authentic. Academic discipline and profession matter. Generation matters. Groups matter. Politics matters. Service matters.
Character Matters
Classical philosophy focused on “living a good life”. Authenticity. Humility. Respect for others. Openness. Personal responsibility. Tolerance/acceptance of differences. Dead serious. Excellence. Merit.
Competency Matters
Demonstrated learning. The Western Canon. Mastery. Results. Achievement. Research. Critical thinking. Written expression. Debate. Progress. Examination.
Creativity Matters
“Both/and” perspective. Multiple intelligences. Multiple perspectives. Interdisciplinary views. Paradigms. Two cultures. Theory and practice. Local and global.
Founded in 1964
The post-war economic expansion was followed by a culturally conservative 1950’s and then concerns about the role of the individual in a world where big business and big government dominated. World War I and World War II shattered simplistic modern expectations of “progress”. Romanticism and utopian socialism were in decline. Cultural critics worried about the sameness of suburbia, the organization man, the man in the grey flannel suit and “the lonely crowd”. Existentialist philosophy was very influential at the time. I think that New College’s curriculum and culture were shaped by this founding period. Existentialism focused on the individual in a different way than Ayn Rand, but clearly on the individual. The key insight was that “in spite of” the challenges provided by modern knowledge and society, an individual could move forward (maybe).
The relation between the individual and various communities was a clear focus. The contrast between existential “existence” and the historical emphasis on “essence” by philosophers and religions alike was unavoidable. The “solution” was to study, learn and grow, while accepting that final, deterministic answers were very unlikely. The best a person could do was to work through life considering the conflicting viewpoints and holding on to whatever he or she thought was best. This is a fundamentally “liberal” view, even if many/most of the implications greatly support historical conservative views that aim to preserve individual character and institutions.
Unavoidable Conflicts Between New College and Modern Conservatism (The Rub)
Rejection of civil and religious authorities. Belief that the individual must choose (and live with the consequences).
Inherently a “relativistic” perspective. There are many ways to frame situations, decisions, politics, religion, etc. No one view, perspective or paradigm is clearly correct. Individuals may embrace fixed perspectives but should accept that others might make different choices.
The classic western canon of received literature and science continues to evolve. There is value in having “everyone” share in the study of “the classics” but diverse perspectives also have an important role to play.
Individuals belong to many “communities of limited liability”. The nation or church does not automatically take dominant priority.
The global community and priorities may be as important as the national and commercial perspectives.
No one deterministic religious perspective is fully adequate.
Individual “rights” compete with the community’s rights and interests.
There is an intolerance of “intolerance” by left-leaning institutions like New College and its students, faculty and leadership.
Summary
New College was founded in the early 1960’s within a culture that raised up the individual in contrast to the conformist social norms of the state, community and businesses. Yet, it was a child of the US which embraced individualism even as it promoted patriotism. The New College curriculum and culture which I experienced in the 1970’s and which largely continues today supports this individual centered model of learning and personal growth. Most of the curriculum and culture is compatible with classic conservative views. Some of the beliefs are incompatible with more fundamentalist conservative views. New College has recently become a pawn in the national “culture wars”. I hope that the trustees will see the very positive role which New College can play in helping a small share of students to wrestle with the difficult questions posed today and contribute mightily to society.
The relationships between firm size, age, growth, survival, death, locations and job creation and retention are many, complex and politicized. However, the core relationships expressed in my 2 recent posts are well supported by data and theory. I’d like to share more background information.
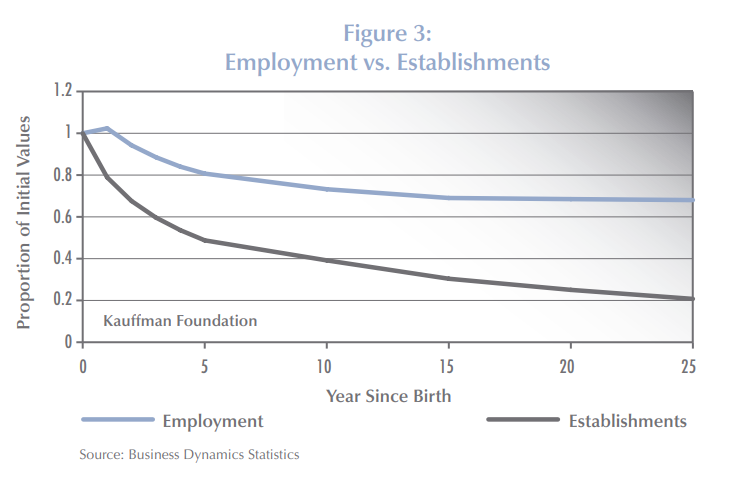
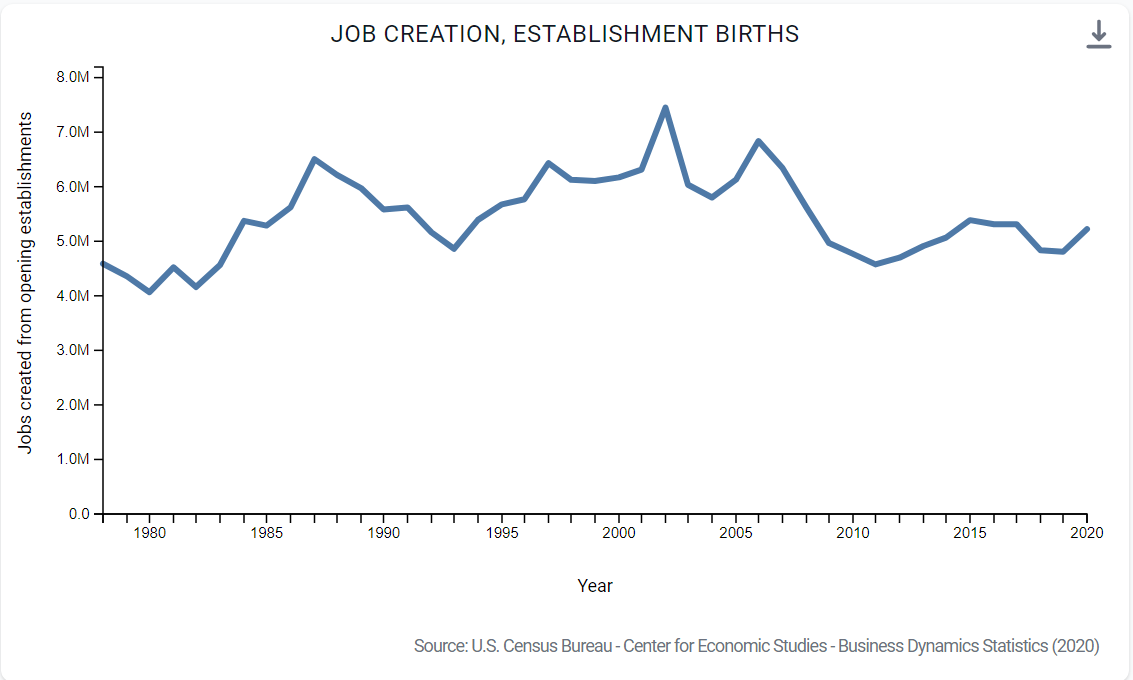
The 10-year job survival rate for startups is roughly 80% and has improved in the last 10 years. However, the FIRM survival rate is much lower. The surviving firms, through economic natural selection, grow rapidly from a low (4 average employees) initial base.
This study of 2011-14 highlights the initial start-up job surge, followed by 10 years of net job attrition and then modest net job growth by mature firms when low firm death rates (5%) are exceeded by decent levels of net jobs added.
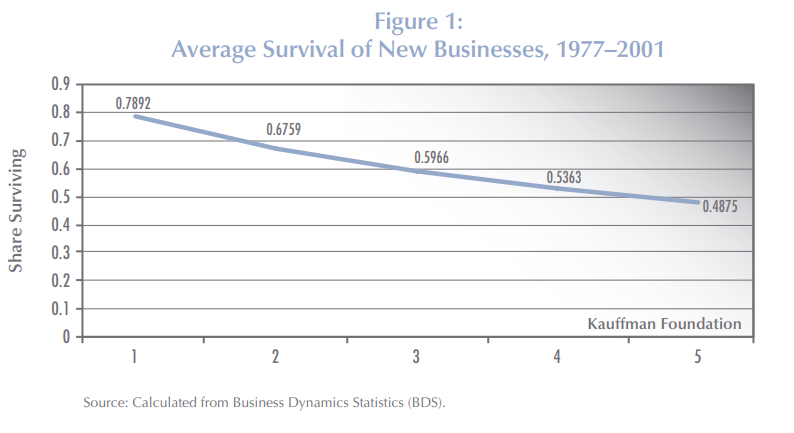
The Small Business Administration (SBA) reports the average firm survival rates for 1994-2019 as roughly two-thirds for 2 years, one-half for 5 years, one-third for 10 years and one-fourth for 15 years.
My review of the 10-year data confirmed the 33% rate for most of the period, with an increase to 36% for firms that began after the Great Recession in 2010-12.
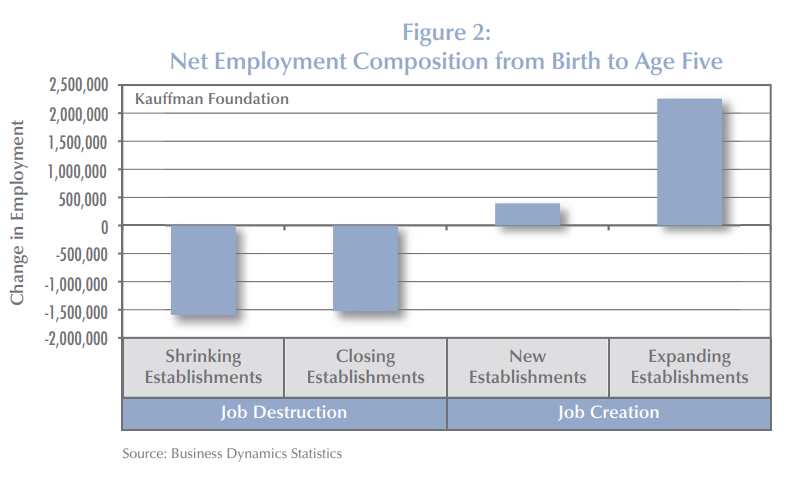
In 2010, Kauffman Foundation researchers summarized the detailed Business Dynamics Statistics (BDS) data, showing the relatively slow decline in net added employment from 100% initially to 80% at 5 years to 70% at 15 years and the rapid decline in the surviving firms rate to one-half at 5 years, 40% at 10 years and just 20% at 25 years.
Another Kauffman report from 2010 shared similar results. The universe of firms is dominated by young firms because the cumulative attrition makes “mature” firms quite rare.
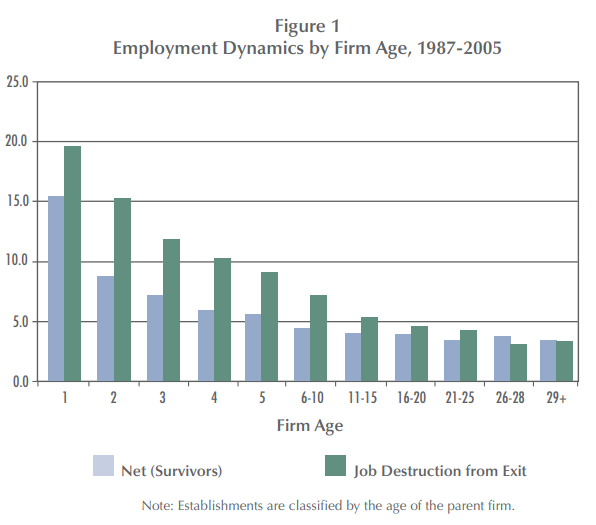
Another Kauffman report in 2009 summarizes this competition between dying firms killing jobs and surviving firms adding jobs. In the first 5 years, the firm failure rate is so high that it overwhelms the high job growth rate of those successful startups. In years 6-10, the death rate is still winning, but the total net job destruction is much smaller. For this 18-year data set, firm deaths exceed added jobs at every age, although 29+ year-old firms basically break-even. This is a critical insight when thinking about the claim that all or nearly jobs are added by startups. It is “true” due to the firm survival and jobs added rates at different ages. It is possible to have quite different results, with existing firms accounting for relatively more jobs, but that would require either the firm/establishment death rates to fall or the job creation rates of surviving firms to increase significantly. It looks like there has been some of that change after the Great Recession. This chart also helps to show that the “net, net” addition of jobs from start-ups, when considered as the sum of their first 5 years is in the 75-80% range, because the net jobs lost in those early years is only 5% per year, despite the more rapid loss of firms.
My summary of the last 30 years of data shows that startup firms do account for “all” new job growth. As others note, in a way this is almost “by definition”, because this is the only age group that only has “adds”, but no “losses”. It always must be positive. As we’ve seen in the details on job departures/hires, jobs created/lost, firms created/lost and establishments created/lost the positive and negative flows tend to be “roughly equal”. Hence, even a single year which is not burdened with an offset will stand out as the “big winner”. So, on the one hand we can discount the critical, essential, vital role of startup job creation, but we can’t ignore it. It is a necessary part of the life cycle of firms that delivers a growing economy.
The 2010 Kauffman study combined the initial jobs created with the jobs lost in the next years to emphasize the vital role of startups, using 2007 data. Mature firms also made a small contribution to jobs added.
A follow-up report in 2011 by Dr. Haltiwanger summarized the data slightly differently but tells the same story. New firms, nearly all “small”, account for almost all job growth. Other small firms destroy jobs in their first 10 years at a high rate and as mature firms at a modestly high rate. Middle-aged firms lose jobs while successful firms grow to more than 500 employees and become large firms! Young large firms add a few net jobs. Old large firms lose a small percentage of jobs for this time period (1992-2005).
The central takeaway remains valid with more recent data across industries. The initial growth of jobs is not offset by the net losses in the next 5 years. Firms more than 6 years old do not add jobs overall.
I don’t know how to reconcile these competing claims but expect that the time periods chosen, and firm sizes chosen, are keys to understanding the significantly different claims.
In the early papers the Kauffman Foundation explains that it is new firms that drive new jobs. There is an overlap between new firms and small size that makes an analysis based on size alone appear to say that “small firms create most new jobs”; but the “newness” logically comes first. Existing small employment firms tend to shed jobs through firm death or internal job reduction.
A simple model focuses on just the first 5 years of a firm’s life after the initial startup year and defines four buckets of job growth and loss due to adding new establishments or experiencing deaths versus internal job growth (up or down) at the survivors. All four buckets matter. New establishments are infrequent for startup firms. Deaths are a major job killer. Job creating firms outweigh job losing firms. But the net gains from internal job growth is less than the drag from firm deaths.
Kauffman also created a complete theoretical model of job changes through time based on the key parameters and demonstrated that the model was a good match with the observed relative consistency of the parameters and the net output of jobs created. In a prior life, we called this the “layer cake” graph, using it to explain the composition of revenues or profits in a business based upon the year of customer contracts signed or new products introduced. At any point in time, there is a history of additions of various ages. Employment tends to decline over time based upon the combination of firm deaths, establishment gains/losses and internal job growth. Each year a new group of firms is added, all with job gains in the first year. This group too follows the pattern of job erosion in the first 5 years, smaller erosion in the next 5 years, close to break-even by age 20 and small net job creation for the mature surviving firms. Again, the parameters could be different, and the results would be different. But this framework provides economists and statisticians with the tools to analyze the components.
Another author created a dynamic model which illustrates how this process works through time.
The Small Business Administration promotes the view that small businesses (less than 500 employees) are essential to the US economy and create a majority of all jobs. As noted above, startups are the key. Size is a byproduct.
In my earlier post I discounted the importance of the decline in the share of new to total firmsbecause the corresponding decline in failure rates and improved job creation by mature firms was still delivering solid annual job creation. However, this warning signal is worth monitoring together with the other measures. The Brookings Institution provides some other “warning signals” about the health of the new firm/job creating capacity of the economy in light of reduced measurable competition in many industries (a topic for another day).
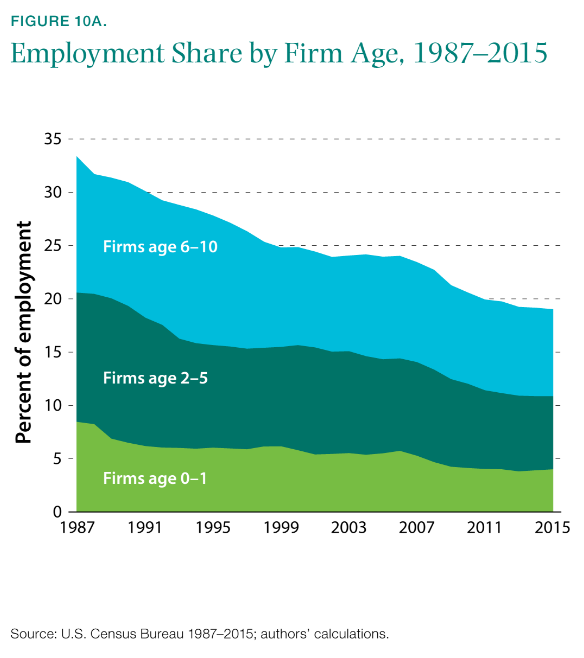
New firms account for a smaller share of total employment.
Business formation takes longer. Recent Kauffman reports shows that this trend has continued.
The entrepreneurship rate of college educated Americans has fallen most significantly.
One professor analyzed this and concluded that it was the result of American firms taking advantage of the low cost of capital and paying the higher salaries and incentives needed to attract and retain high potential employees. He says that job creation is happening more in existing firms and less in startups with no negative overall effect. He says that “marginal” (low return) entrepreneurs have been removed with little negative impact on the economy as a whole.
The slowdown in the new firm/job creation rate after the Great Recession attracted much attention from the media and politicians. Two representative articles are listed below, mostly bemoaning the decline of startups/small firms and the relative growth of large firms.
With the renewed emphasis on small firms and public policy to support them, others have responded by emphasizing the benefits of large firm growth and questioning the need to support/subsidize small firm growth.
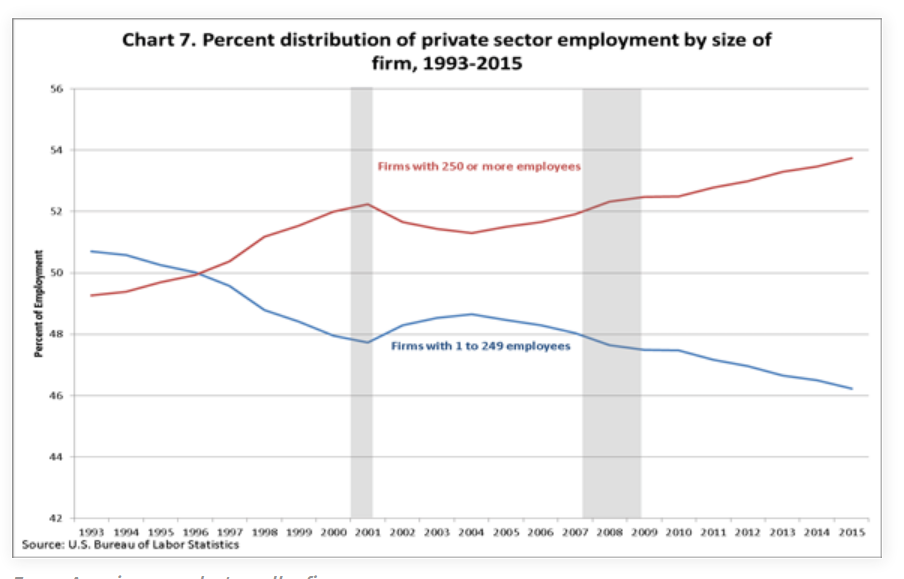
Using less than 250 employees to define “small business”, this article shows a 4% decline in small business share and 4% increase in large business share.
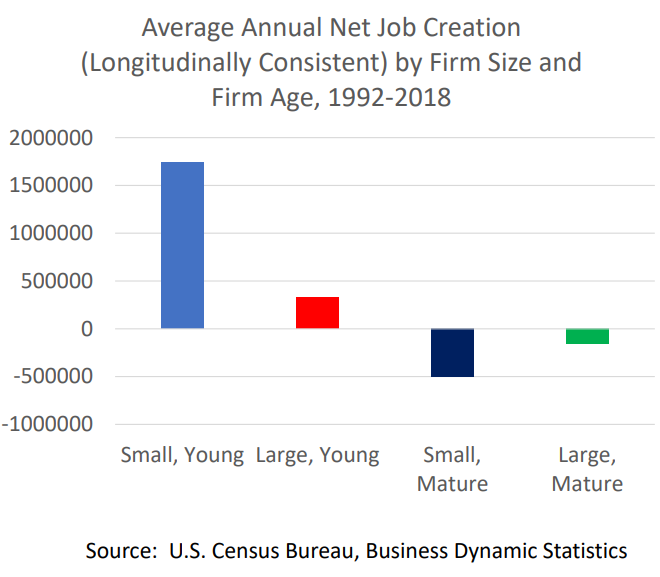
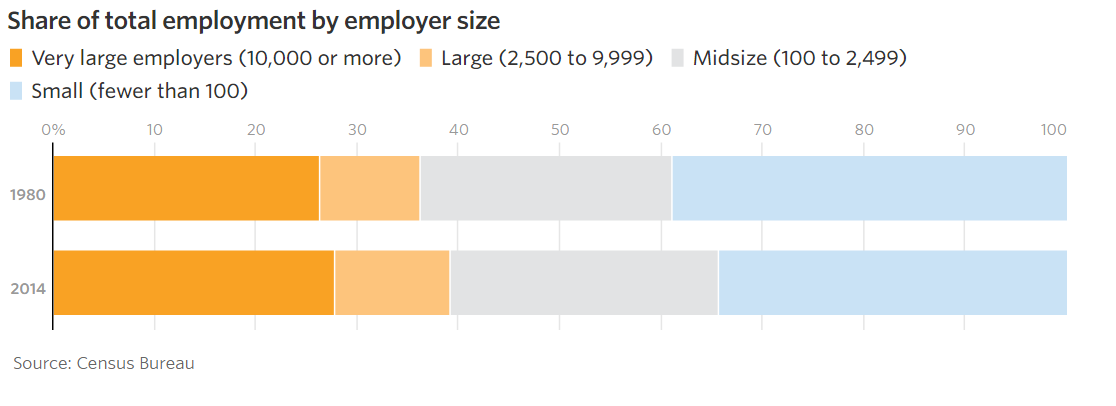
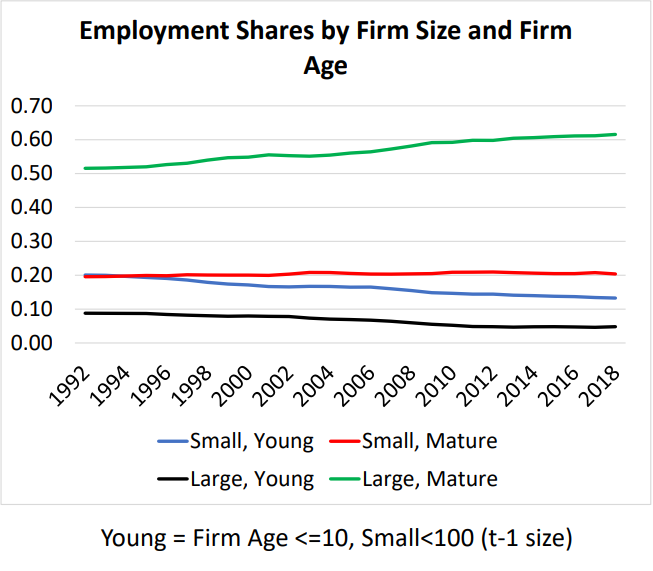
Professor Haltiwanger reports that large, mature firms have increased their share of total employees from 50% to 60% between 1992 and 2018. Both large and small young firms have lost offsetting market share.
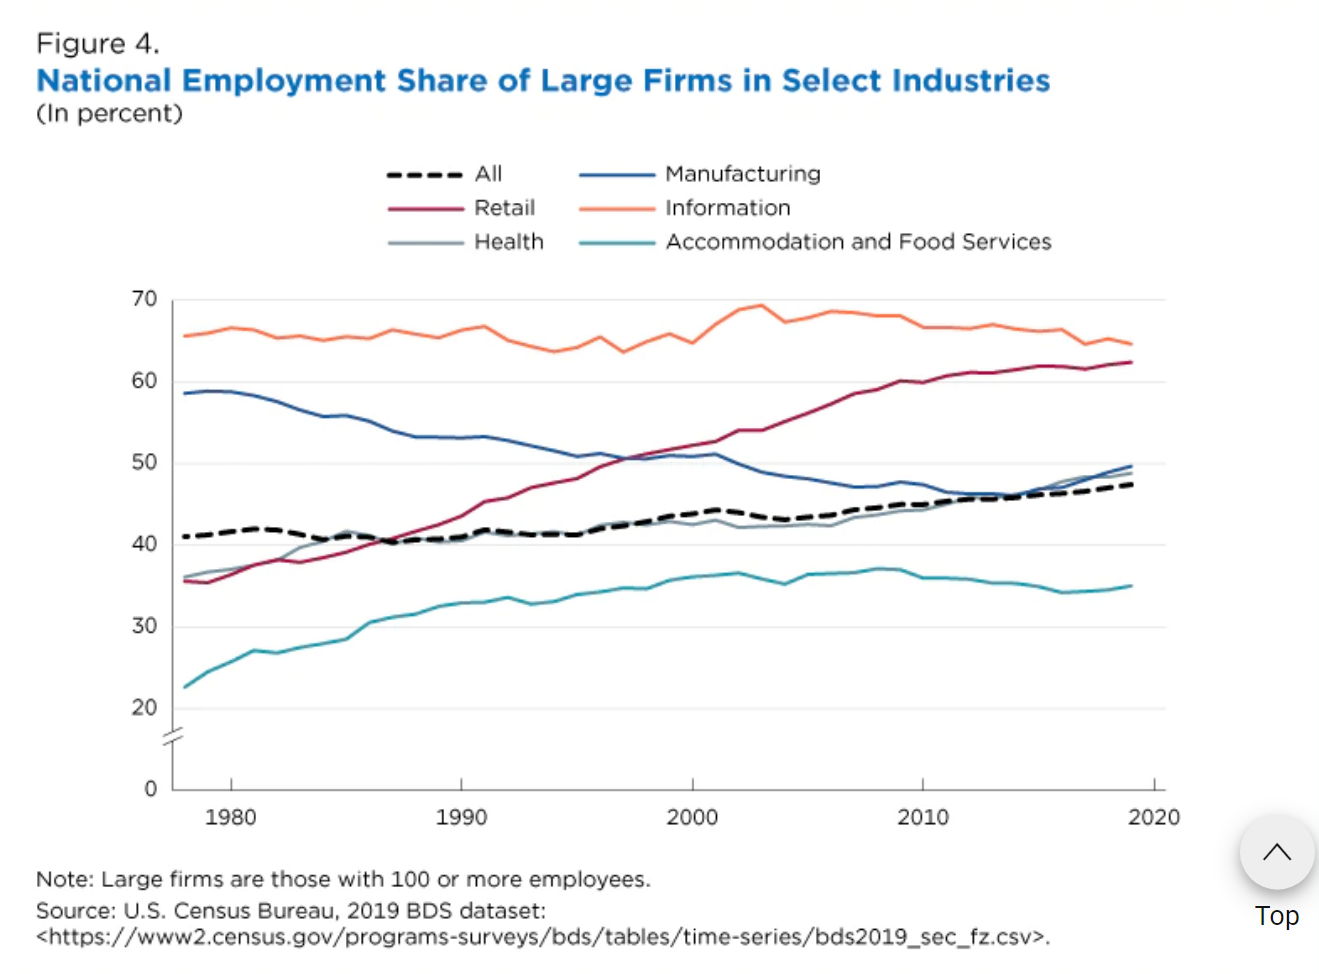
A recent Census Bureau article documents the increased employment share of older firms (6 years+) in many key industries.
It also highlights the increased concentration of workers in large firms in the retail, health care, accommodation and food services sectors.
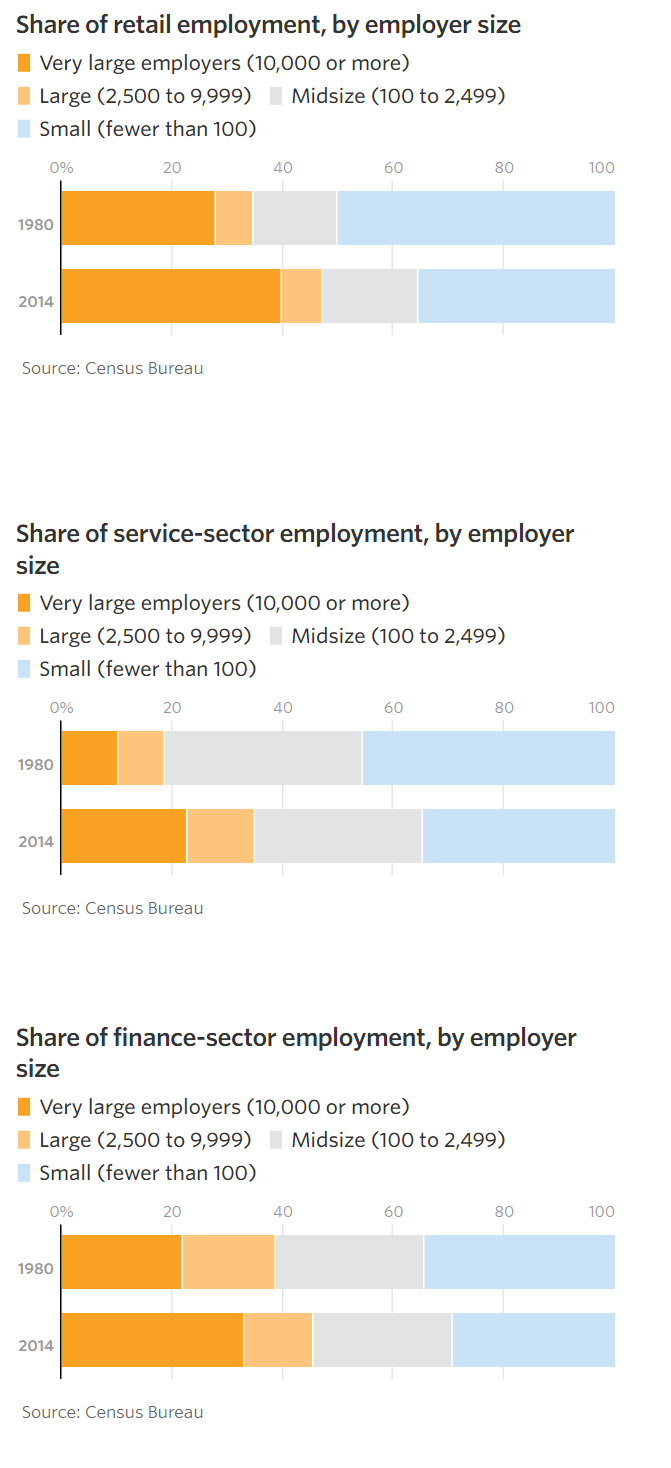
The WSJ articles itemizes the increased concentration of employment in large firms in the retail, services and finance sectors and documents that these are the growing segments of the economy.
Summary (It’s Complicated)
The Business Dynamics Statistics database provides researchers with the consistently defined and reported data since 1977 to document the key role of startup firms in adding net new jobs to the US economy. Startup firms are one part of an ecosystem of firm, establishment and job creation and destruction that plays out through time in relatively predictable ways. The death rates of young, middle age and mature firms play a similarly important role. The growth and decline of new establishments in existing firms matters. The internal job growth rates of young, middle age and mature firms matter. The relatively small size of startups compared to mature firms has an impact on job growth. Historical parameters are generally similar and change slowly, causing the layers of employment by firm age to be similar in this 50-year period. The model and framework for measuring firms, establishments and jobs is solid. Startup firms are essential, but they are not the only driver of success.
“Jobs created by firm size” is similarly shaped by all of these factors which describe the typical firm life cycle. Small firms are not superior job creators. New firms are job creators, and they happen to have small individual employment levels (4 on average), so small firms have higher measured rates of job creation.
In the last 10-20 years there has been a significant decline in the rate of new firm creation as a share of total firms. New firms created have not lost as many jobs due to firm deaths in their first 5-10 years. Mature firms continued to shed a disproportionate number of jobs during recessions, but after the Great Recession began to add more net jobs due to internal growth than they had in the prior 40 years. The overall number of jobs created has remained in the 2-4 million per year range across the 50 years.
The conservative SBA, Kauffman Foundation, WSJ and Republicans promote policies to ensure a thriving entrepreneurial environment for new and small businesses. The more liberal Brookings Institute, college professors and Democrats have an instinctive distrust of big business and concentrated economic power, so also lend support to some pro-small business policies. If job creation falters during periods of economic prosperity, this may be a rare place where bipartisan agreements could be reached to promote new firm and job creation.
Many people complain that the US economy does not create enough new jobs or soon won’t create enough jobs or won’t create enough good jobs or … People worry about employment. Writers and politicians cater to that worry. Fortunately for us, the US economy creates jobs year after year after year, only briefly interrupted by increasingly less frequent and brief periods of economic recession. I’ll share the core numbers on healthy firms and new jobs and provide some context and history which indicates that this is inherent in the modern US economy. The economy is not relying upon any major political change or special insight to continue adding jobs. It just happens.
For 9 straight years, from 2011-2020, across 3 presidential terms and 5 congresses, the US economy added 2 million new jobs each year. In the 1980’s, it added 2-4M per year. In the 1990’s it added 3M per year. In the “oughts”, it added 2M per year. 30 years of expansion, 7 lesser years that averaged more than zero. 4 strong years for every 1 weak year..
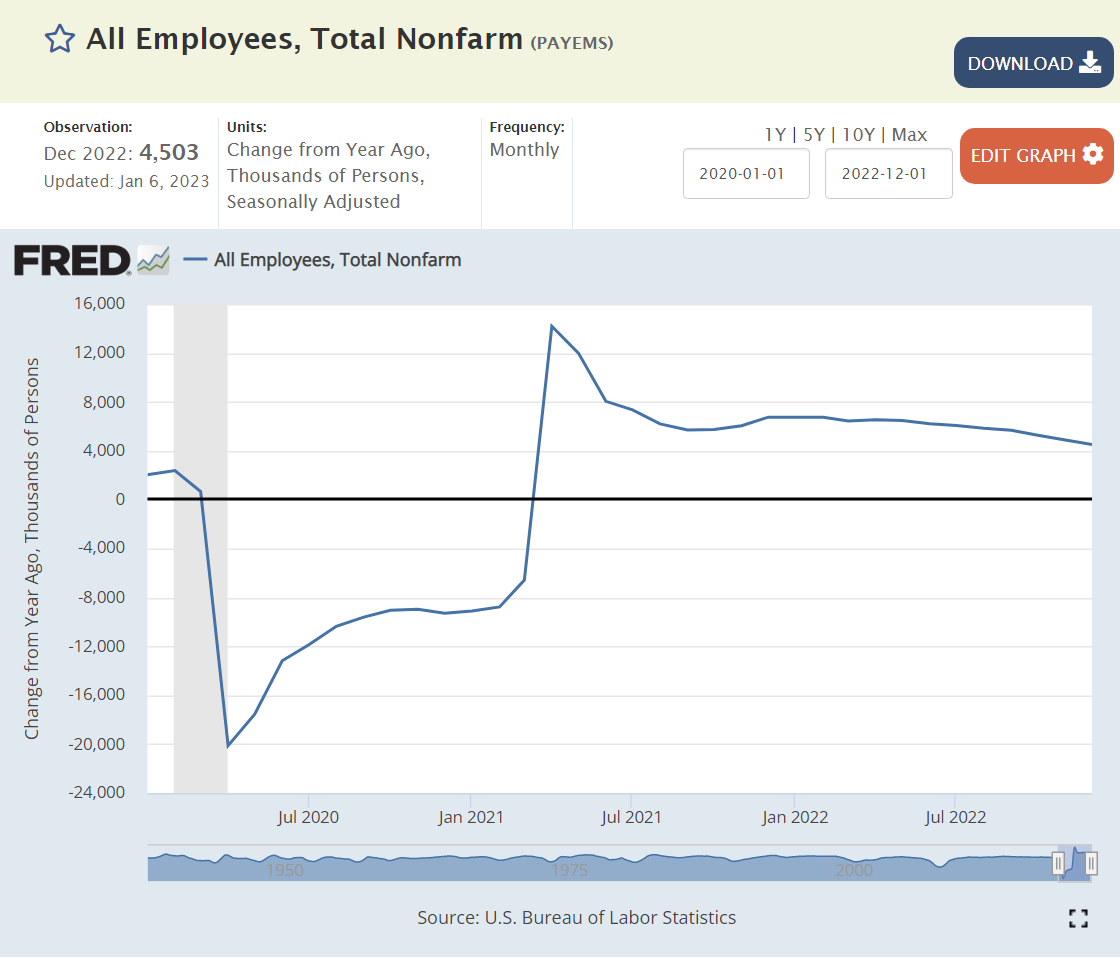
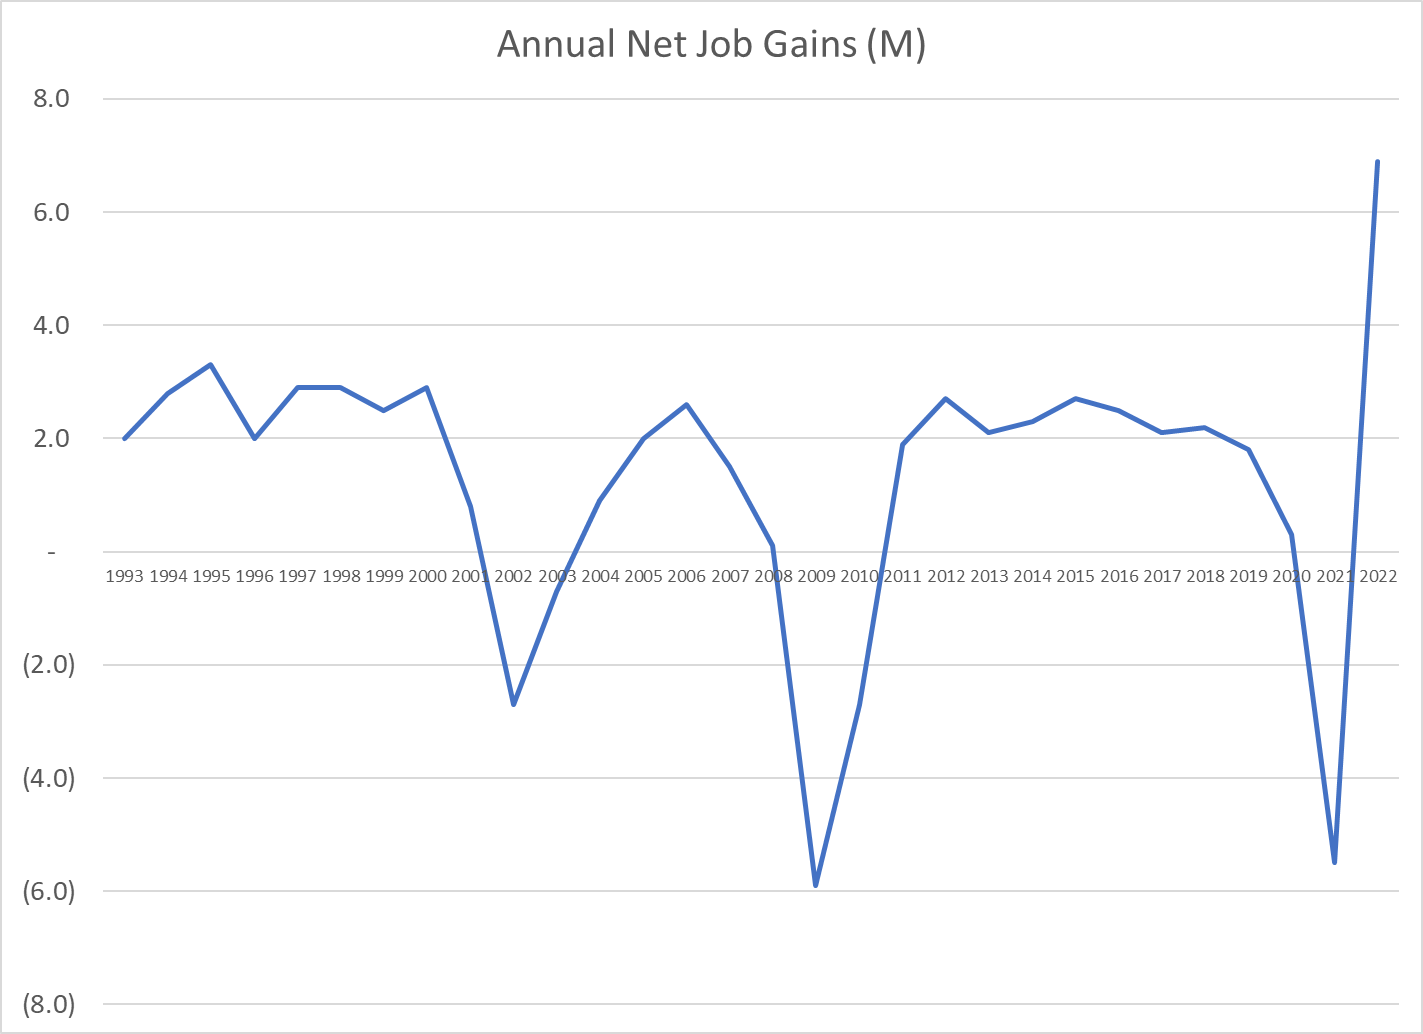
The recovery since the pandemic has been even stronger, starting at 8M new jobs per year in 2021 before sliding to 6M per year and most recently 4.5M per year.
The total number of firms in the US grew slowly in the last 40 years, from 3.5 million to 5 million. The growth rate was much faster prior to the Great Recession (2007-9). Much of this growth was accounted for by single employee firms. Despite this tame 1% growth per year, the economy was able to add more than 2 million jobs per year.
The US economy requires some growth in the number of firms or establishments each year to drive job growth. Fortunately, it does not require heroic growth rates.
The number of new establishments added per year is remarkably consistent, averaging about 700,000 per year on a base of 5-7M. Of course, this means that the RATE of new establishments is shrinking, from 14% to less than 10%.
Establishment exits have increased from 500K to 600K to 700K before returning back to 600K per year. Big picture, 700K new establishments and 600K lost establishments each year across 4 decades.
Firm deaths have also been consistent at 450,000 per year.
Data calculated from BDS data. Direct graph not available.
Firm births have also averaged about 450,000 per year but present a different pattern. Firm births were much lower in the troubled time around 1980. Births ranged from 450-500,000 per year in the next 25 years. The Great Depression destroyed businesses, access to capital, personal net worth and aggregate demand. Hence, new firm creation dropped back to the 400,000 level. It recovered back to the 450,000 per year rate by 2015. As with firm deaths, the rate has fallen from 14%+ to less than 10%. Most importantly, the birth and death rates have been relatively consistent and have both been relatively flat, leading to a slow increase in the number of US firms.
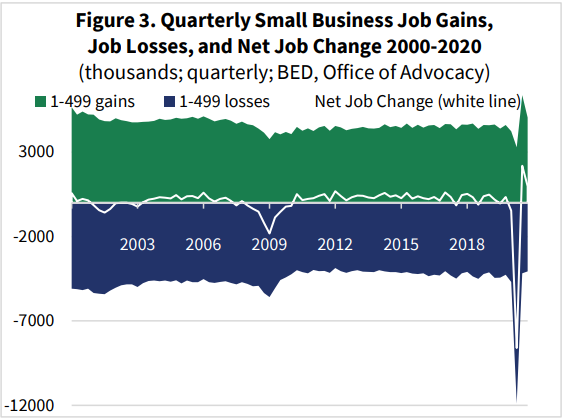
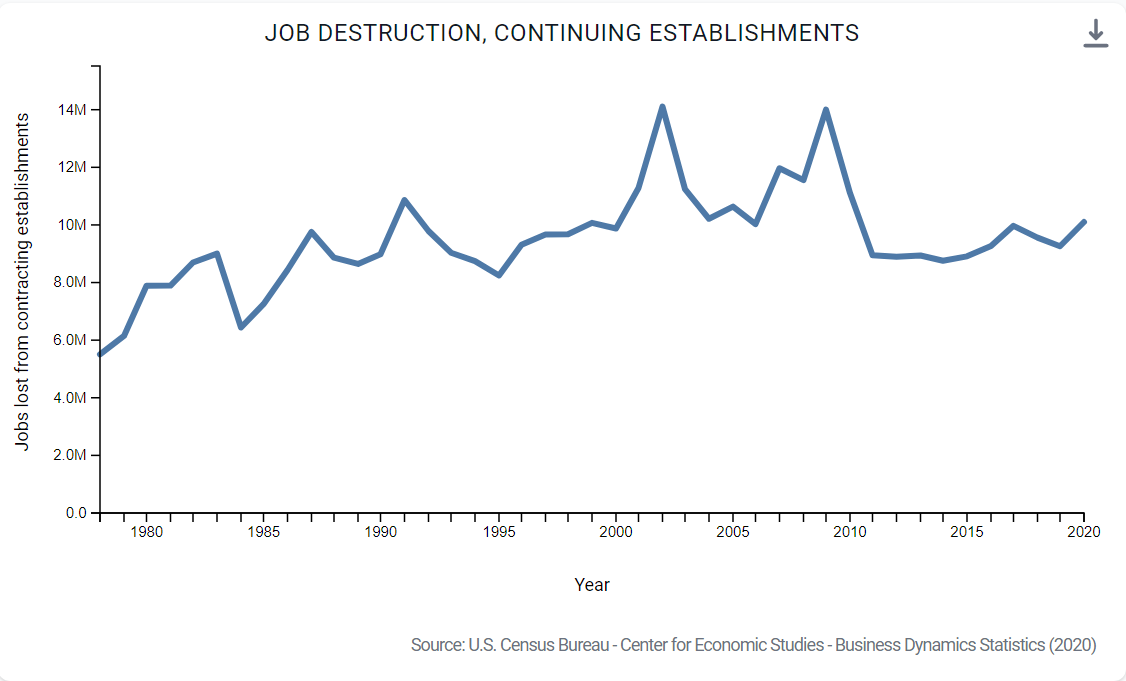
The BDS database shows that job gains and job losses generally move together, but that in a recession job gains fall and job losses increase. This is a very important result. Without active government or policy intervention, the economy creates 12-14M jobs each year and destroys 11-13M jobs each year. There is no guarantee that net jobs will be created in any given year, but overall that is the normal result.
Writers who wish to emphasize the decline of entrepreneurship focus on firms instead of establishments because of the slower growth rate. They emphasize the growth rate rather than the growth numbers because this is less positive. They don’t compare the growth and death rates or numbers, which move together. They focus on the aftermath of the Great Recession which did greatly slow firm creation, resulting in slower than historical numbers and rates of job creation from new firms. Nevertheless, the economy created 2M new jobs per year for 9 years. During that period, existing firms captured a larger than usual share of the job growth required to provide demanded goods and services.
New establishments have driven 5-6M new jobs each year. The late nineties to early “oughts” reported the higher 6M per year figure.
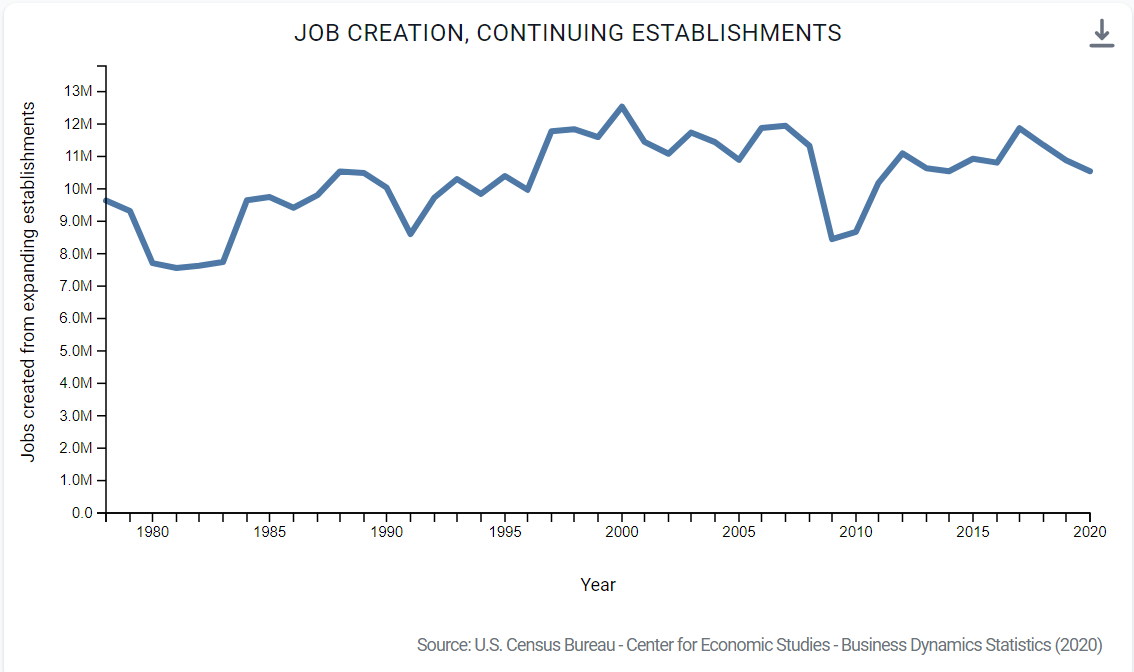
Existing (continuing) establishments have added 10-12M gross new jobs each year.
Establishment deaths (including firm deaths) resulted in 4-5M jobs lost each year.
Continuing establishments trimmed 8-9M jobs each year, and many more during recessionary times. Although there are many moving parts, continuing firms eliminate more jobs than they create, especially during recessionary periods when they are adapting to lower demand. Firms die and they close locations, removing 4M jobs each year. New firms and new establishments add the new jobs required to fill the 2M net new jobs each year. This does not happen automatically or precisely, but overall, through time, the pattern is clear.
The US job market has grown from 90-150M positions during the last 40 years.
Firms hire 75M people each year. The typical job tenure is just 2 years.
Separations and hires generally move together. The net 2M jobs added annually is a small fraction of employment, hires, separations, gross job adds and gross job losses.
Establishment births exceed establishment deaths except during deep recessions.
New firms have high failure rates. Fortunately, firms that survive their first year have high percentage rates of new hires. They start with a small number of employees (4) and grow rapidly. The survival rate improves with the age of the firm and the employment growth rate of surviving firms tends to decline as they grow. The combined effect is that 80% of the new employees added by startup firms remain after 10 years. This employment survival rate has been improving in the last 15 years, partially offsetting the reduced number of start-up businesses.
The share of “new employer businesses” dropped after the Great Recession and has not fully recovered.
The number of application for new business tax ids increased significantly after the Great Recession and jumped by 50% after the pandemic.
The Census Bureau also tracks a subset of the total new business applications based upon industry classification that is a better predictor of actual businesses eventually started. This measure shows modest growth after the Great Recession and a 30% spike after the pandemic.
About 10% of new business applications become new businesses. Hence, the rate of new business formation to be reported for 2022 is expected to be very high.
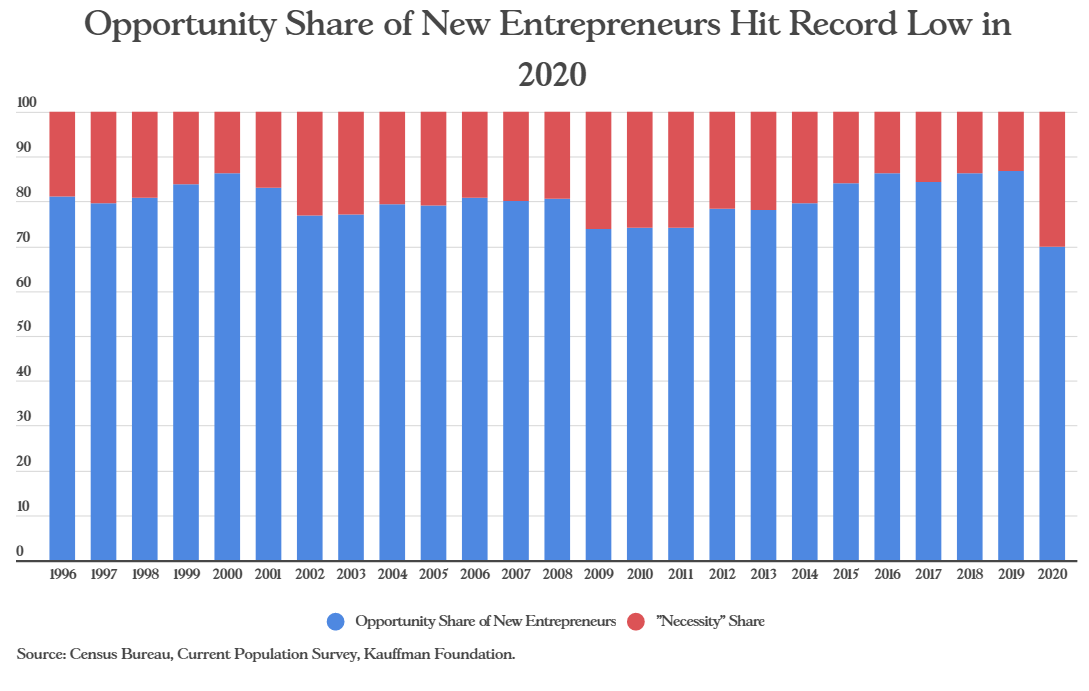
About 80% of new businesses are formed based on opportunity and 20% based on necessity. Kauffman estimates that 2020 business formation was 30% based on necessity.
Summary
The US economy continues to generate 2 million new jobs in each non-recession year, even more in boom periods like the last 2 years. Firms and establishments are born, grow and die. The net employment growth rate for established firms is less than zero in their first 5-10 years and then slightly positive. The annual death rate of existing firms and establishments is relatively low, but on a 150M employee base it is 4M per year. The new jobs added by startup firms and new establishments allow the total number of employees to grow in normal years.
There is no “iron law of employment” that requires new firms or establishments to be created in numbers greater than the job losses. There is no law that requires surviving young firms to nearly offset job losses by young firms that die at a high rate. There is no law that requires mature firms (10 years old+) to add new employees or to die at slow rates. But these results have been consistent or improving for the last 40 years. I look forward to continued success.
I’ve always been a sceptic about the many claims that entrepreneurs, startup firms and venture capital are the “most” important drivers of improved quality of life in the US in my lifetime. I remain a sceptic. I believe that large firms deliver even more added value (driven by self-interest). I believe that the government and not-for-profit sectors play an equally important role. I believe that the government’s definition of the “rules of the game” and our culture’s influence on how people live their everyday lives are also very important. I’ll come back to the role of small firms in a separate blog post. I’ll try to tie together all of the strands of our amazing US labor market in another blog post.
But today, I want to tip my hat to the truly amazing role that startup firms play in driving the US economy and labor market.
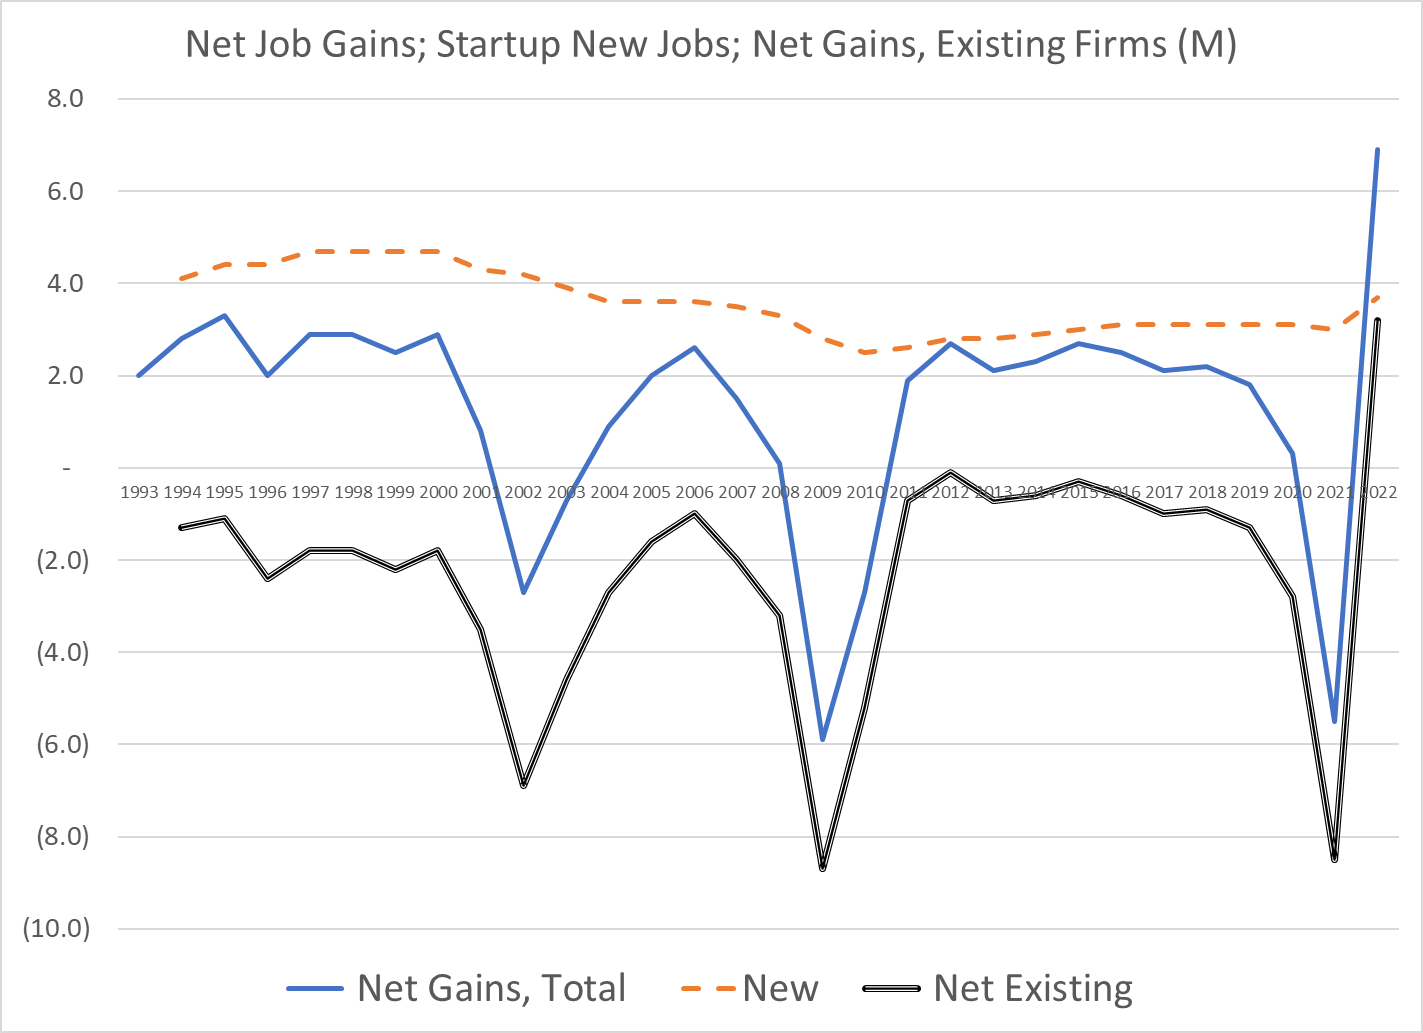
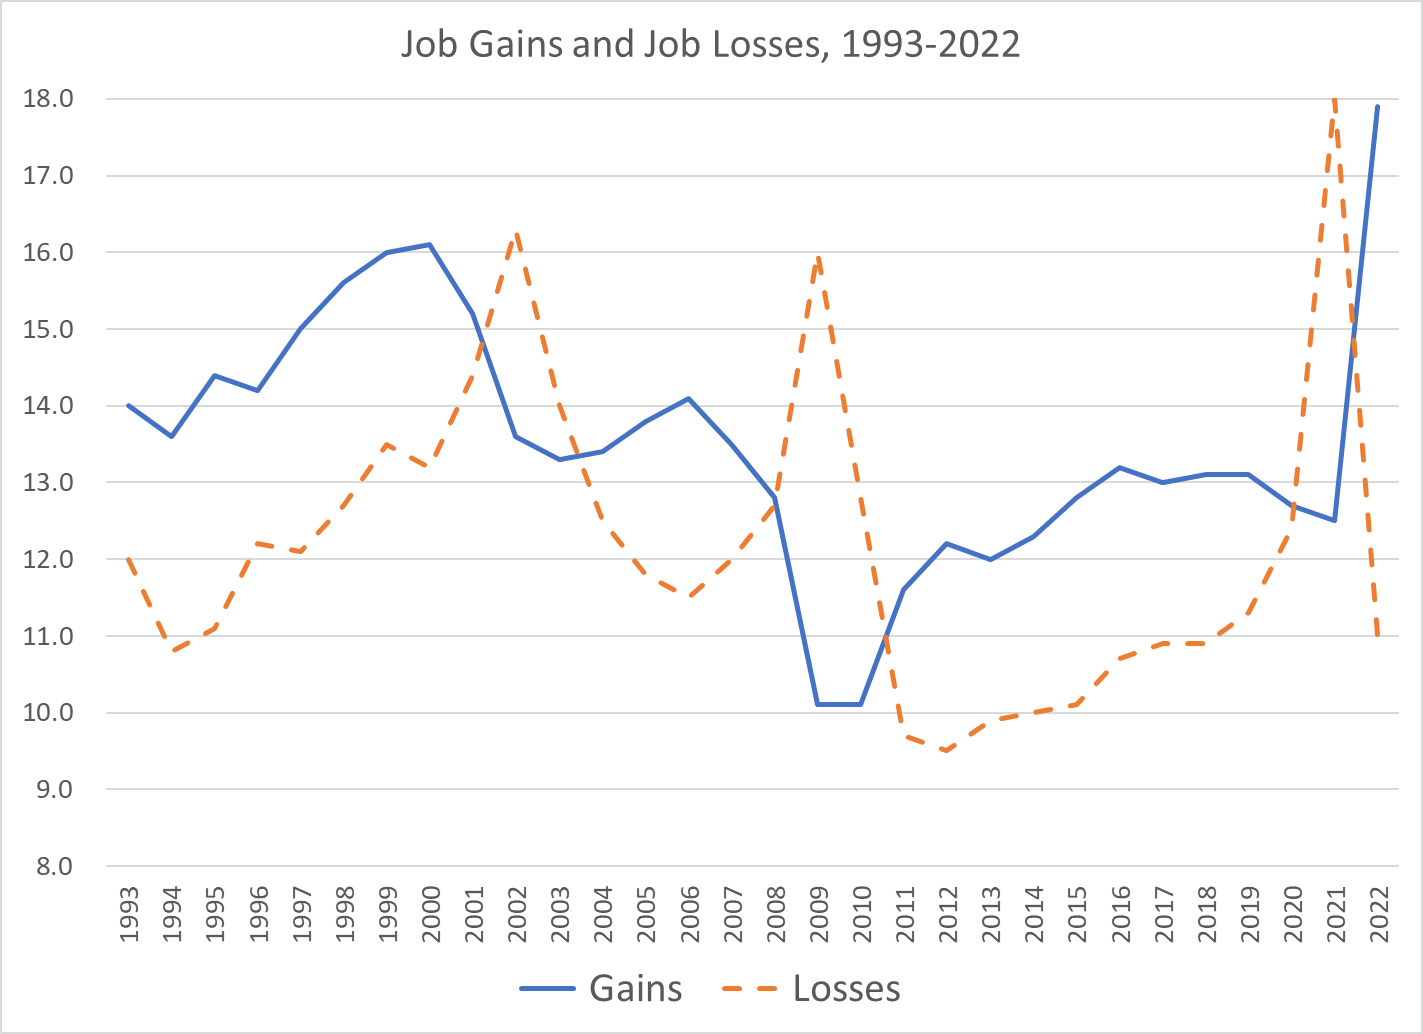
The US Bureau of Labor Statistics (BLS) tracks new jobs added (gains) and jobs lost (losses) each year in detail by firm and establishment (branch), including links to the year the firm was first created. At the total country level, we see that job creation and destruction follows the business cycle. The Great Recession, subsequent expansion and pandemic periods are obvious above. In the Clinton years, job gains averaged a great 15 million per year. The Bush, Jr. years showed still solid 13-14 million annual new jobs added. The Obama recovery increased new jobs from 10 to 13 million per year and Trump maintained this positive level at the end of a very long period of economic growth.
Job losses generally followed the pattern of job growth. Job losses are even more volatile. They peaked in the recessions of 2002, 2009 and 2021.
In the last 3 decades, the US economy added 2 million new jobs each year during periods of expansion.
Many economists, journalists and politicians claim that startups account for ALL new job growth. This is an “amazing” claim that deserves deeper analysis, investigation and description. I’ll chase this separately. The claim is “largely true”.
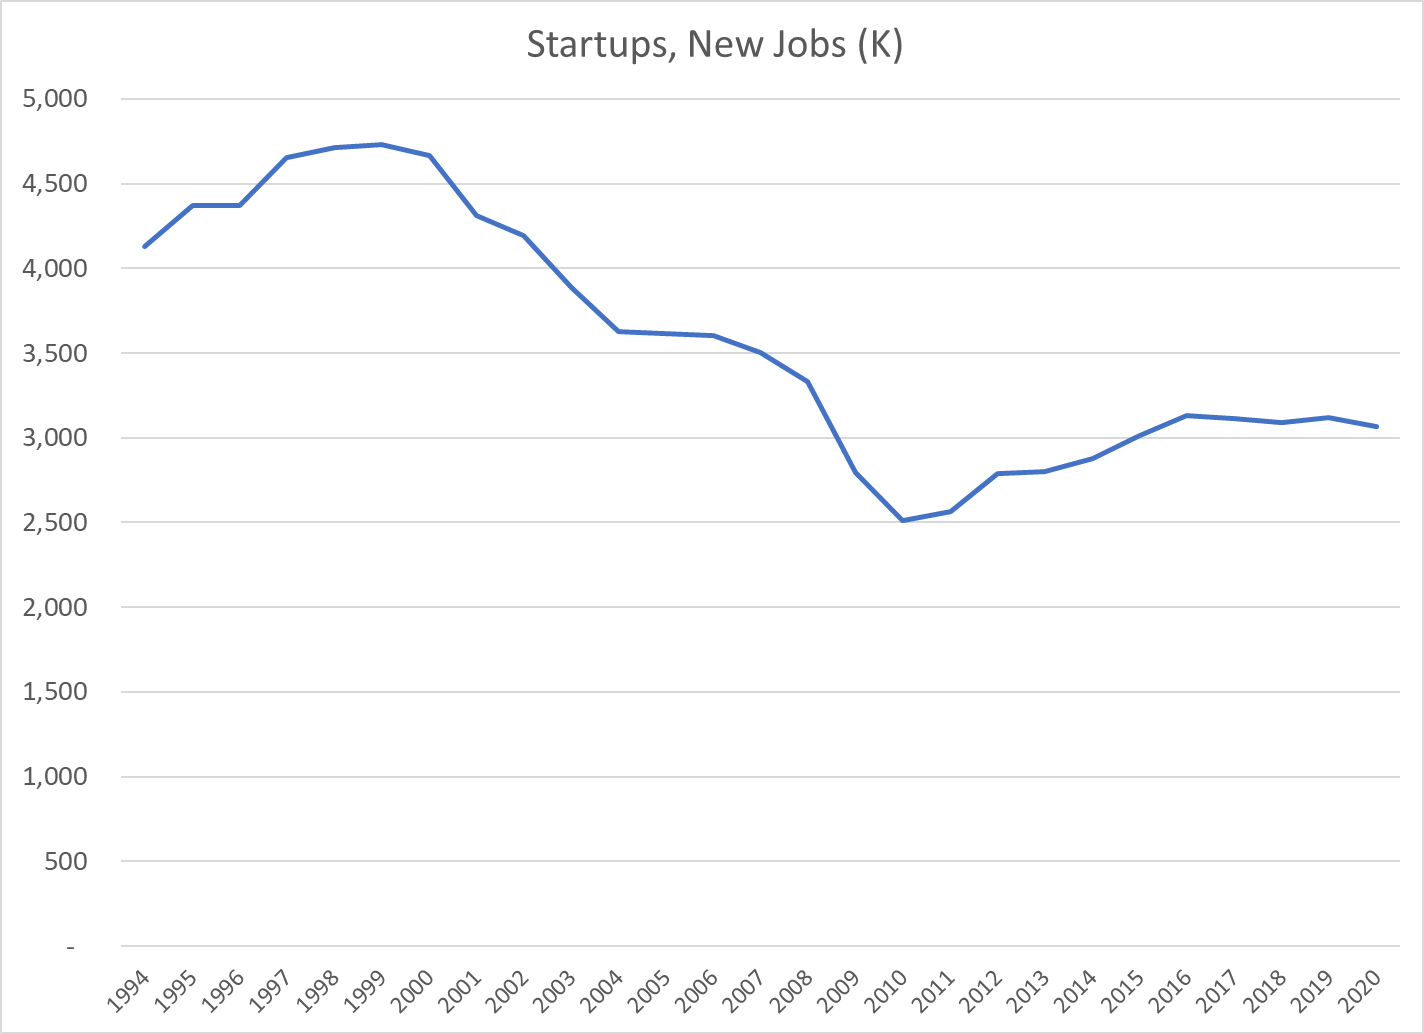
Startup firms delivered 4-5 million new jobs each year in the 1990’s. This declined to 2.5 million jobs during the “oughts”. It increased back to 3 million new jobs per year in the teens. In non-recessionary periods during the nineties and “oughts”, existing firms destroyed 2 million jobs each year. In the teens, the job destruction rates were much lower, roughly 1 million jobs per year. The startup jobs minus existing firm jobs number was typically 2 million net new jobs per year in positive economic years.
The BLS separates job gains from job losses and categorizes them by the firm’s first year of existence. Job gains at existing firms were roughly flat at 10 million per year. Startup firm new jobs declined from 4.5M in the nineties to 2.5 M in the “oughts”, recovering to 3M per year afterwards. Startup job creation declined from 45% to 31% of existing firm job creation, a one-third reduction.
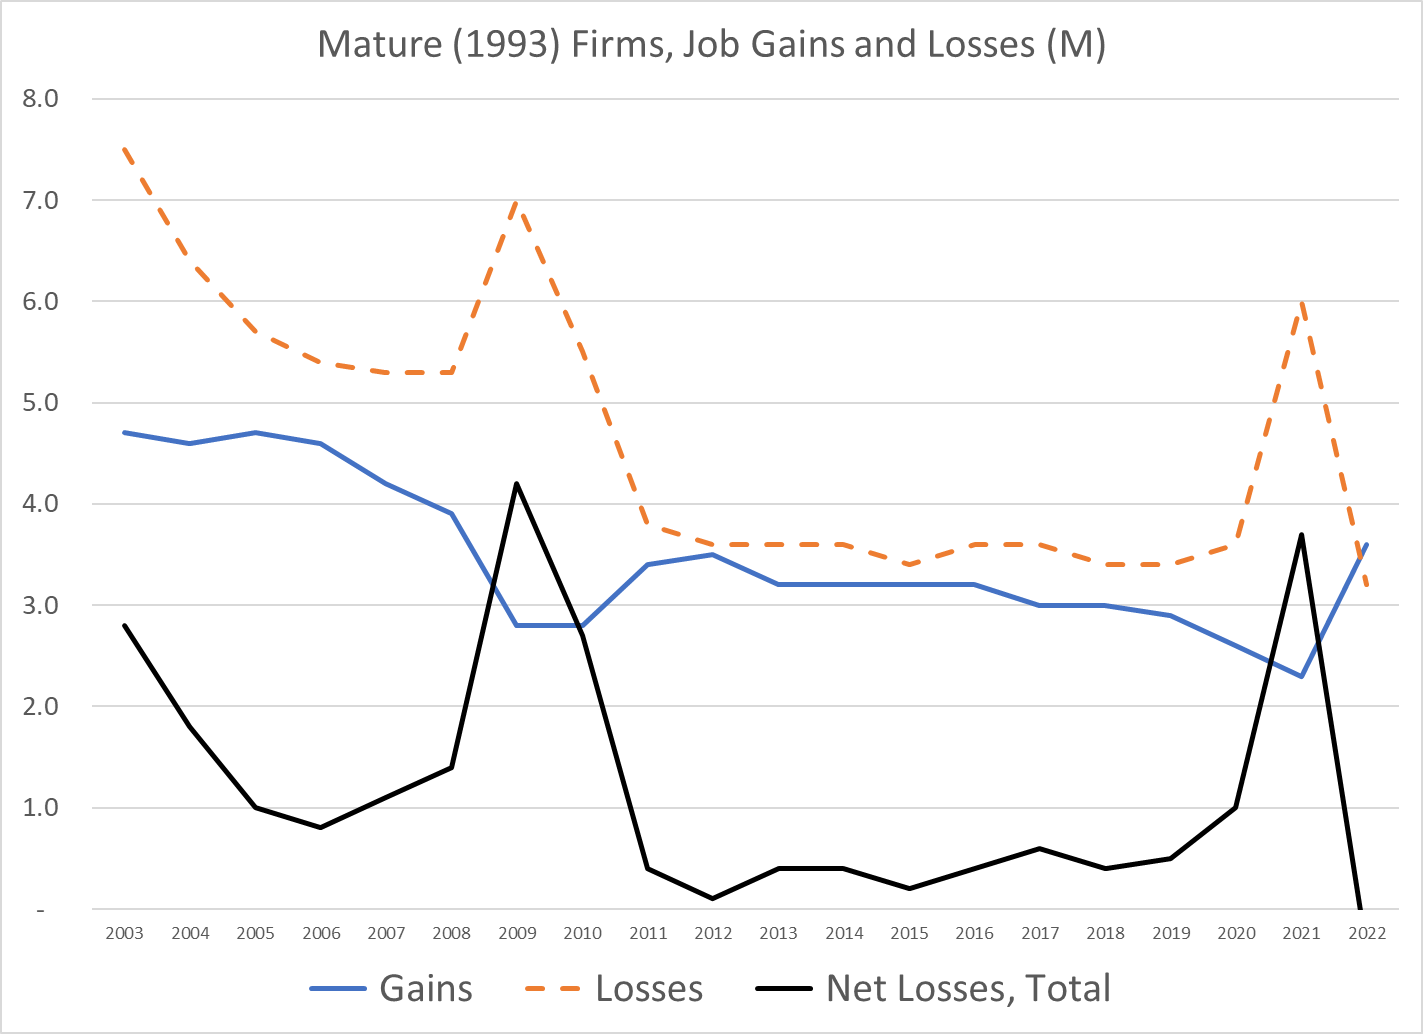
The BLS provides data on the subtotal of all firms founded before 1993. These “mature” firms display a similar pattern. Annual job gains fell a bit from 4.5M in the “oughts” to 3M in the teens. Annual job losses fell even faster, from 6M in the “oughts” to 3.5M in the teens. Net job losses averaged 1.5M annually in the “oughts”, but just 0.5M in the teens.
The number of new jobs created by startups declined by one-third during this period, from 4.5 to 3 million per year.
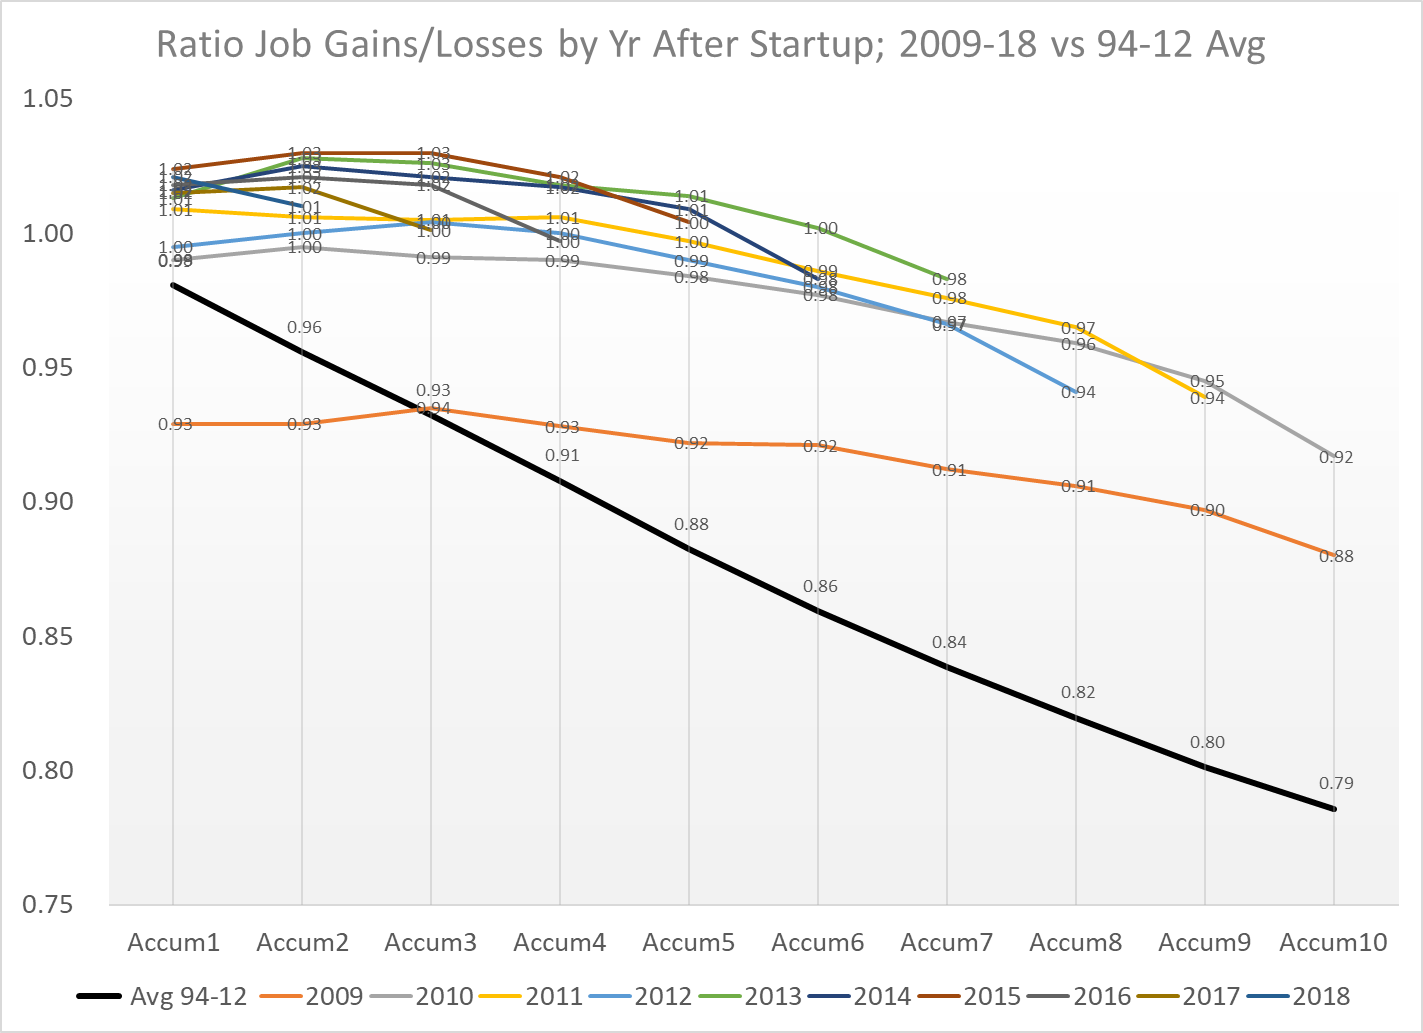
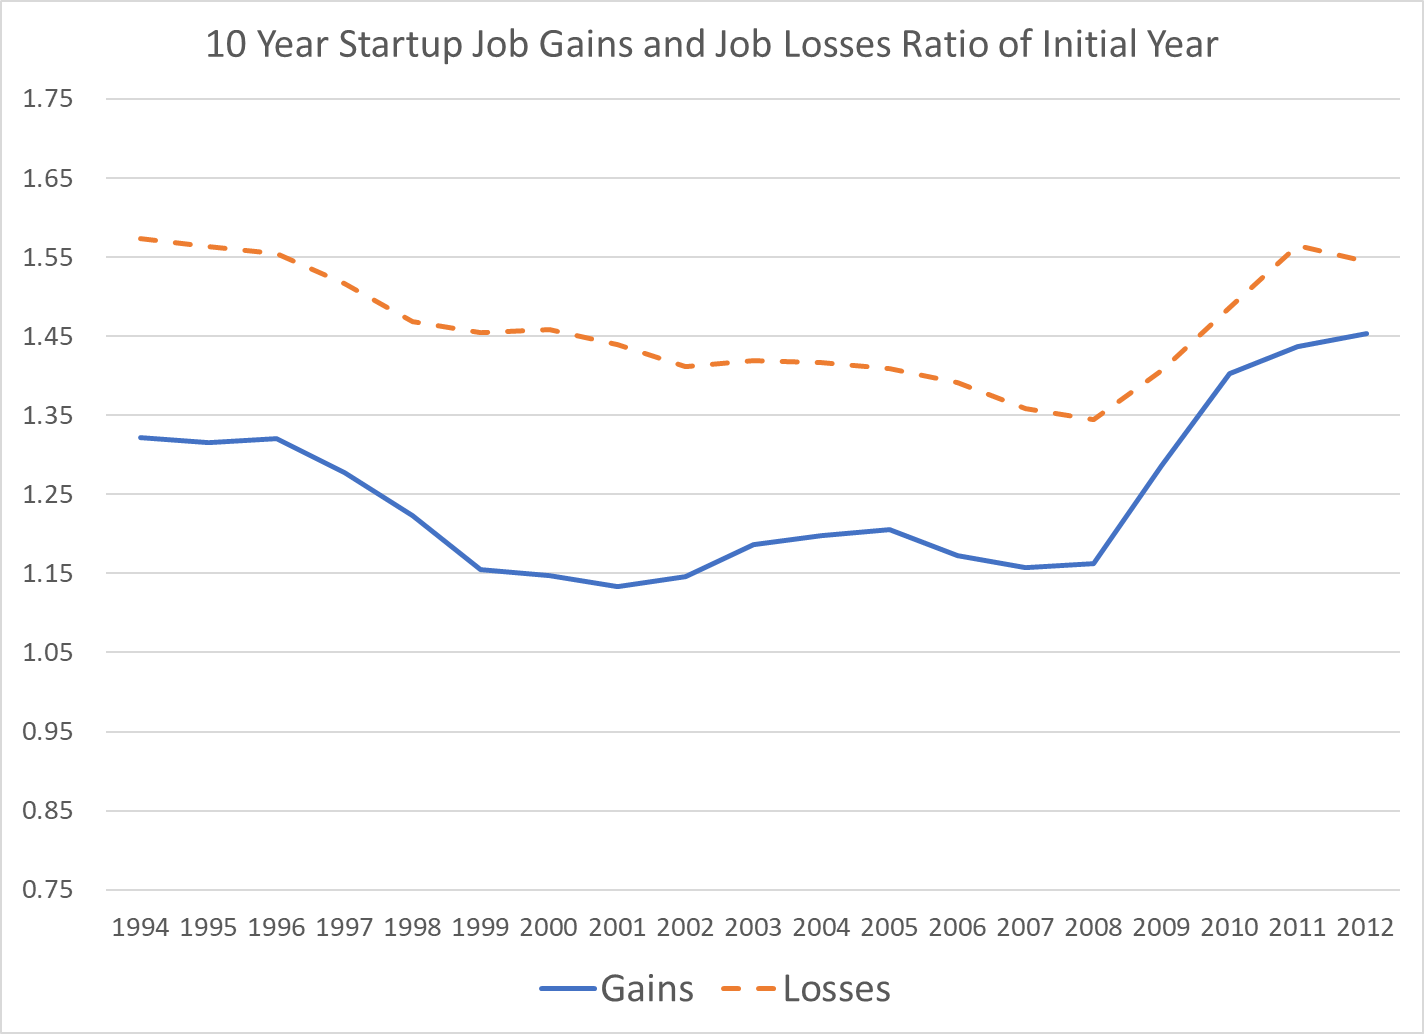
The BLS data allows us to track the gains, losses and net jobs added by first year of existence for firms. First year startup jobs declined from 4.5M to 2.5M. The cumulative jobs created measured 10 years after startup is more positive. Cumulative new jobs, measured 10 years after startup, increased from 3M to 3.5M then dropped back to 3M in 2001. The startup classes of 2009-12, despite the Great Recession, report 2.5M net jobs added each year, as measured after 10 years.
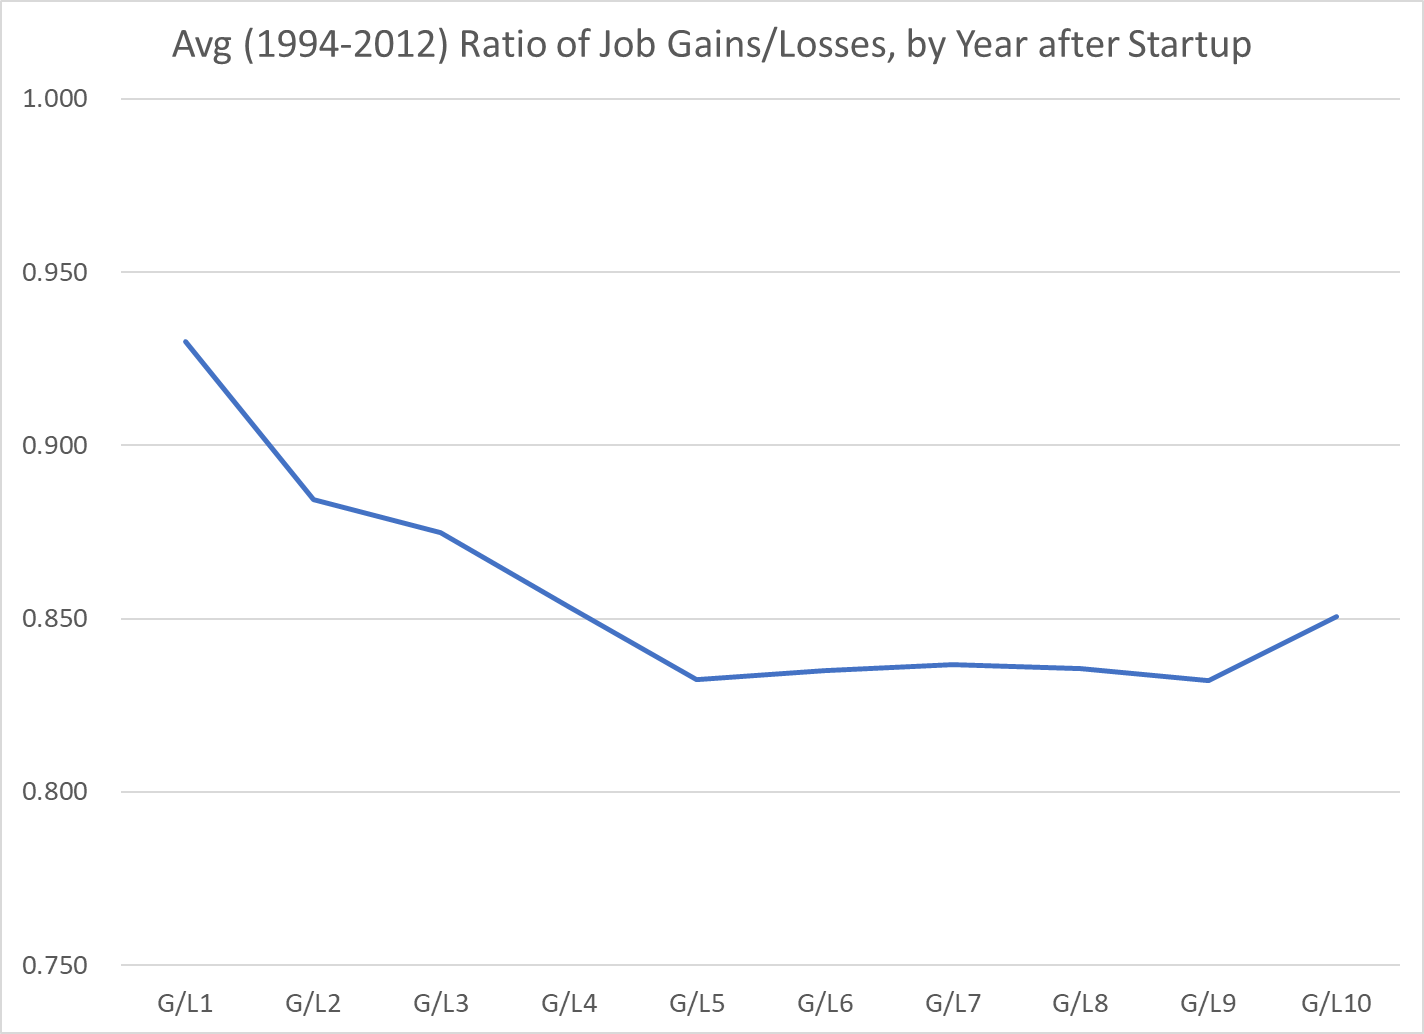
Job losses have fallen much faster than job gains in the last 20 years, measured by a full decade of performance. The ratio of job gains to job losses has improved markedly. This ratio averaged 83% in the nineties, indicating that 1/6 new jobs was destroyed within a decade. This ratio has greatly recovered to the mid-90’s. indicating that new startups, in total, essentially maintain their initial jobs count a decade later. Other data shows that one-third of startups don’t exist after 10 years. Hence, this means that the successful remaining one-third have roughly tripled their employment in their first decade.
Firms die much faster than employment. There are many studies that claim that one-half, three-quarters, fourth-fifths or nine-tenths of employees at startup firms are eliminated in 10-20-30 years. These are mostly exaggerations.
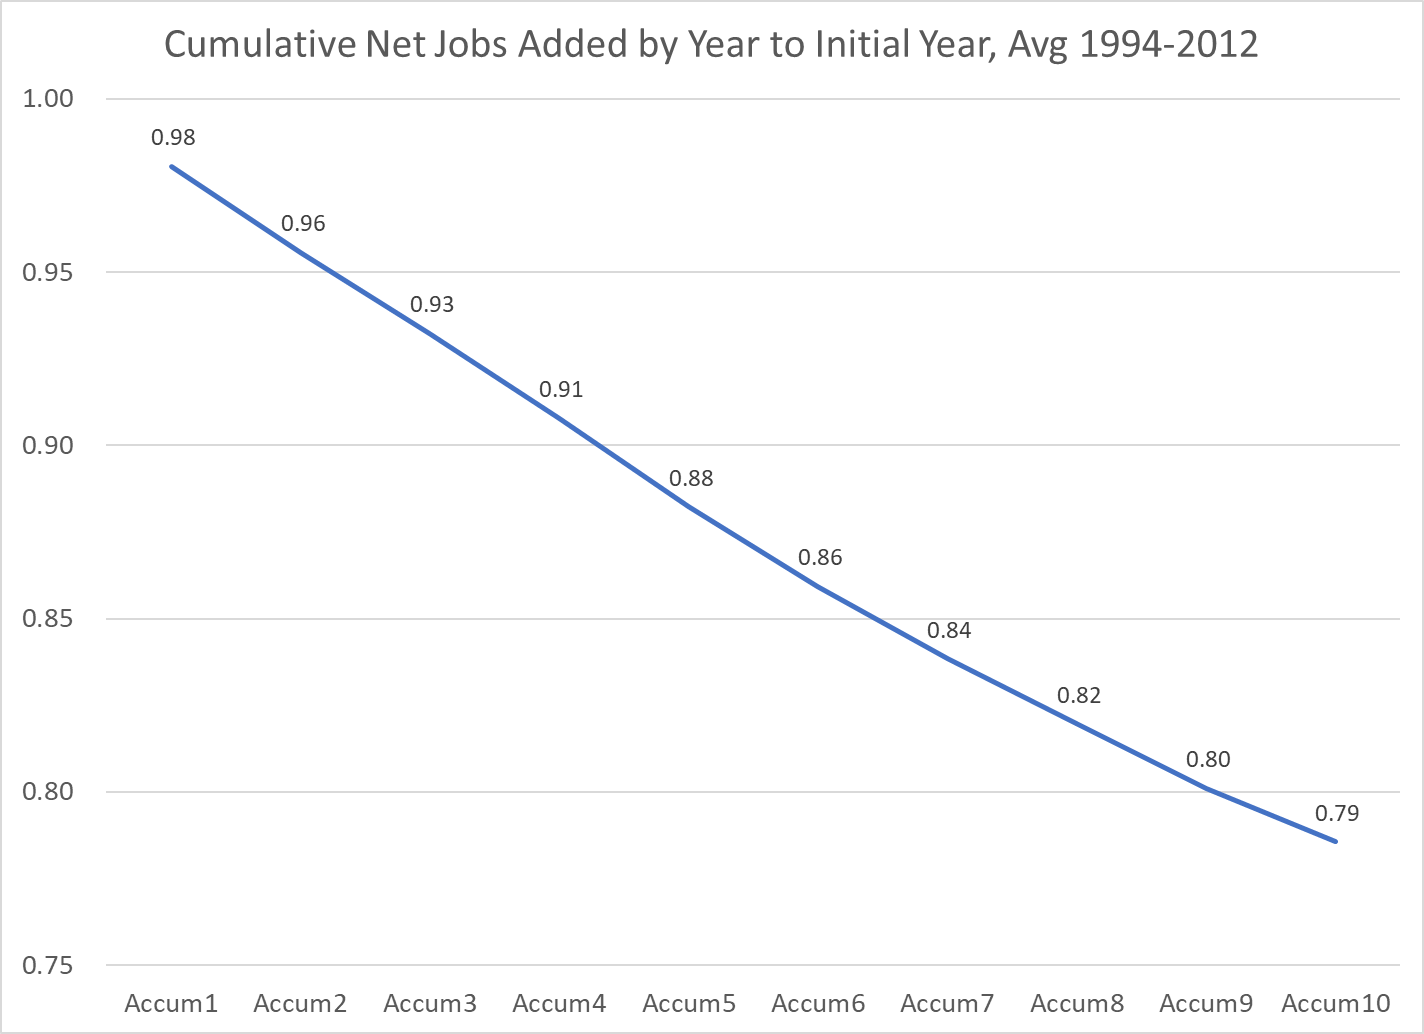
Ten years after their founding, startups still employ 80-90-95% of their initial year hires. Job losses fell during the teens. Job gains grew rapidly after the Great Recession.
For the 18-year period where we have ten years of data on startup firms, we have a clear pattern of net employment decline at the end of the decade, on average. The ten-year retained employment level at almost 80% of the initial level is far higher than the 50% claimed by some commentators.
The years since 2009 show a clear pattern of startups maintaining 90-95% of their initial employment levels after 10 years.
Summary
The US economy typically added 2M net new jobs each year during periods of economic expansion. Historically, startups added 4M jobs annually to offset the 2M jobs eliminated by existing firms. The job destruction rate of existing firms has slowed. The jobs retention rate of startups has improved. Net, net, the US economy still generates 3M+ new jobs each year which essentially still remain a decade later. One-third of the firms are gone, but the winners employ 3 times as many as when they started.
Allison V-1710-7 (V-1710-C4) V-12 engine (A19600125000) engine. One-half left front view.
New hires remain above 6 million at the end of 2022! The high in 2002-7 was 5.5 million. The economy barely reached 6 million during the historic 10-year expansion from 2009-2020. New hires in 2021 were above trend, but 2022 remains on the positive track. We’ve been in a “negative” economic climate for 18 months, but the economy has just slowed a bit.
The “distribution” business is doing very well. People are embracing the Amazon model of home delivery. This requires more staff here and less in retail and wholesale trade. 1.1M new hires prior to the Great Recession. Drop to 0.8M afterwards, recovering back to 1.1M for 2015-19. Growing to 1.3M after the pandemic!
The “leisure” industry continues to grow as a share of the US economy, from 900K new hires to 1.2M new hires. There is some slowdown in the second half of 2022.
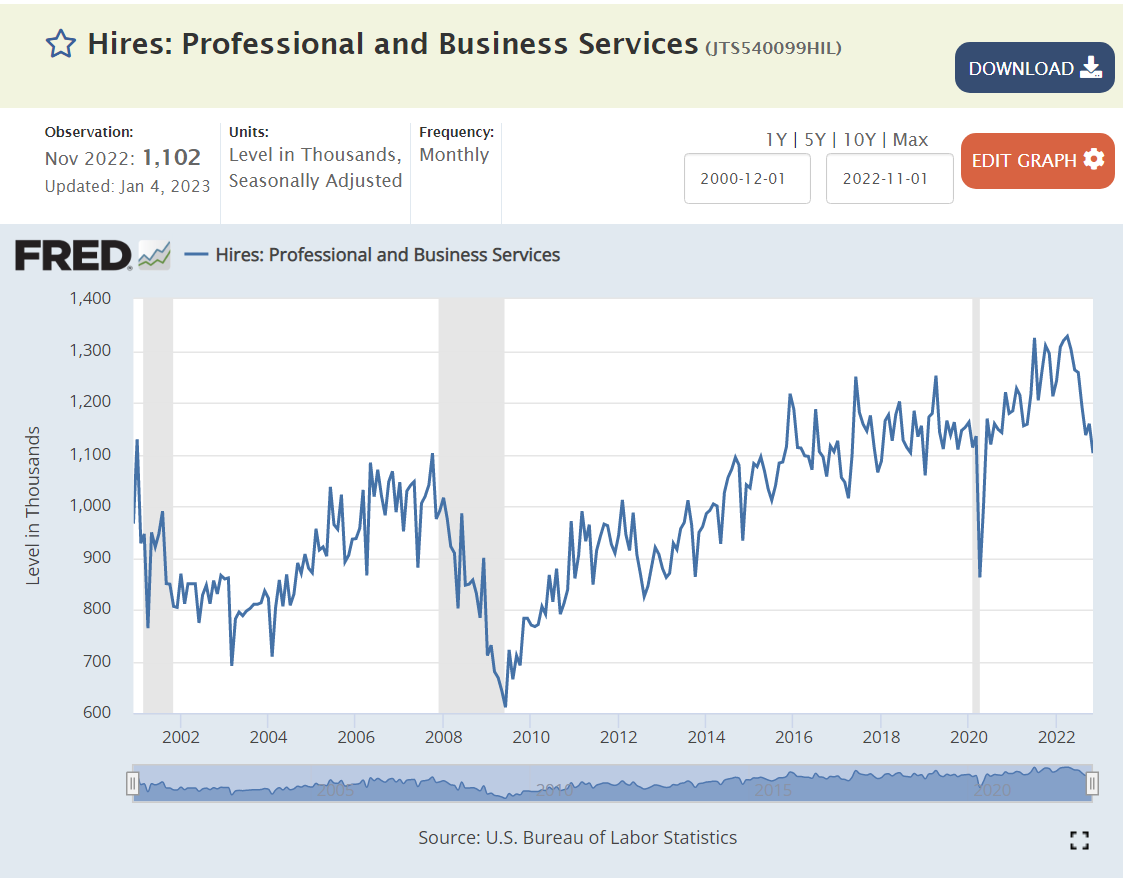
The broadly defined business and professional services industry continues to grow as a share of the US economy, from 800K new hires in 2004 to 900K by 2011 and 1.1M in 2016. This industry continues to grow, although it has clearly backtracked a bit at the end of 2022.
The retail trade sector has generally been weak for the last 2 decades, with new hires plummeting from 800K to 550K after the Great Recession before recovering to 750K from 2015-19. Retail hiring actually increased after the pandemic before falling back to its historical level of 750K hires.
Health Care continues its forward march to consume all of the US economy. 😦
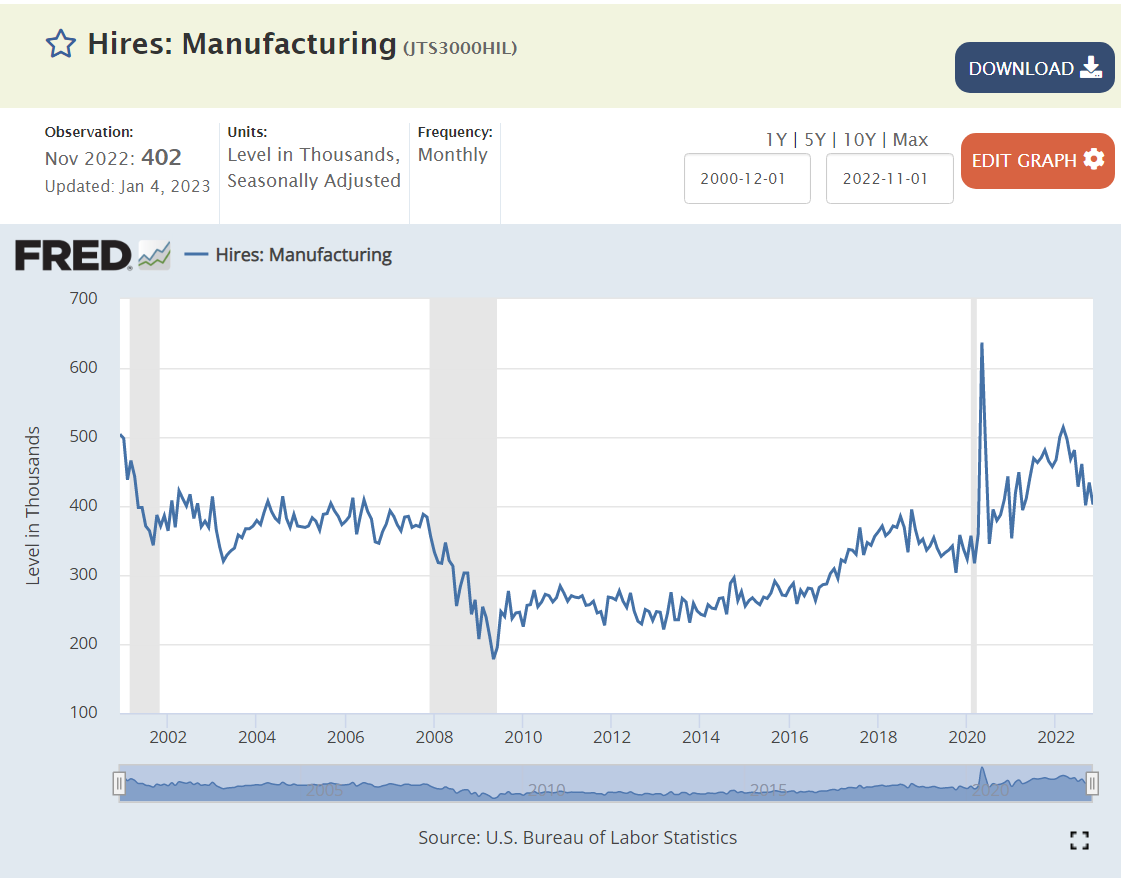
Manufacturing new hires dropped by one-third after the Great Recession, but very surprisingly recovered from 250K to 350K new hires by 2018-19. Manufacturing new hires grew even faster, above 400K after the pandemic.
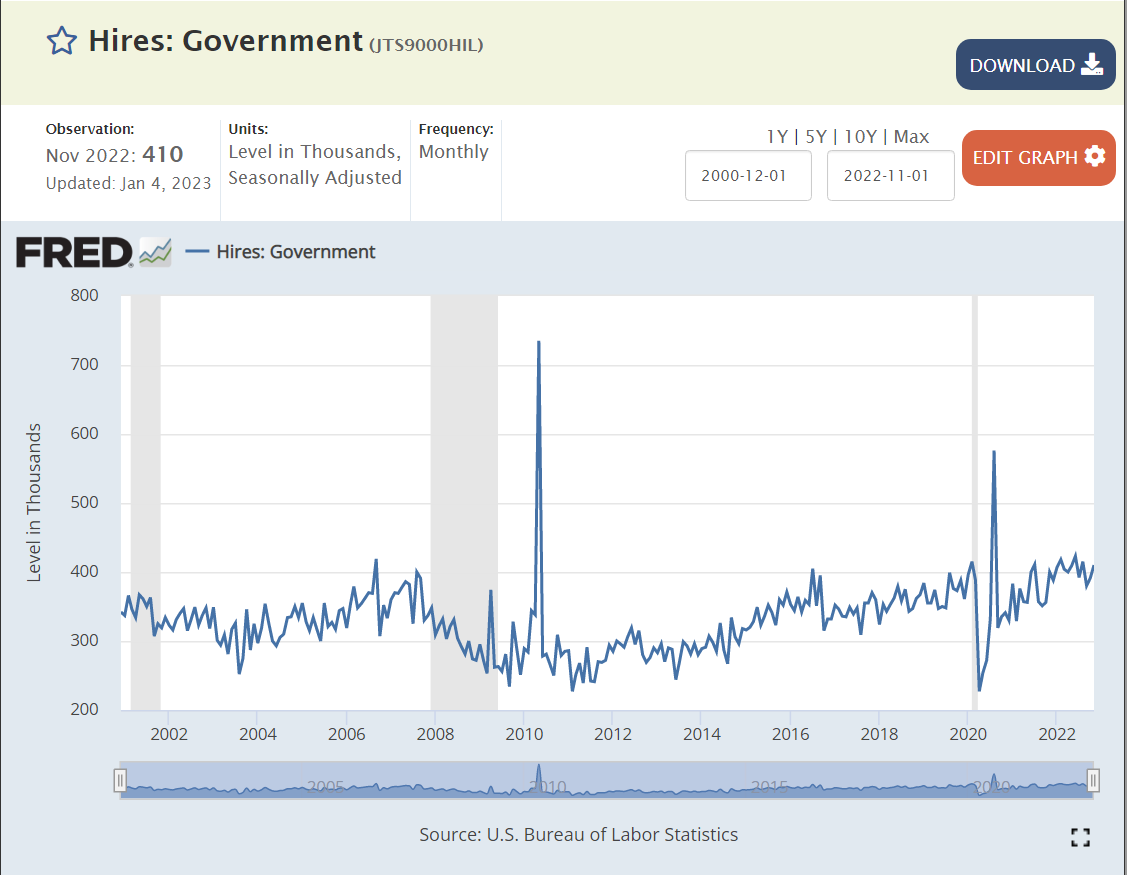
The government sector has less variability. New hires have increased to 400K after the pandemic.
New hires in the Construction industry peaked before the pandemic and have drifted downwards ever since.
Hiring in the Financial Services industry dropped by one-third due to the Great Recession, but has slowly recovered to almost the 240K level.
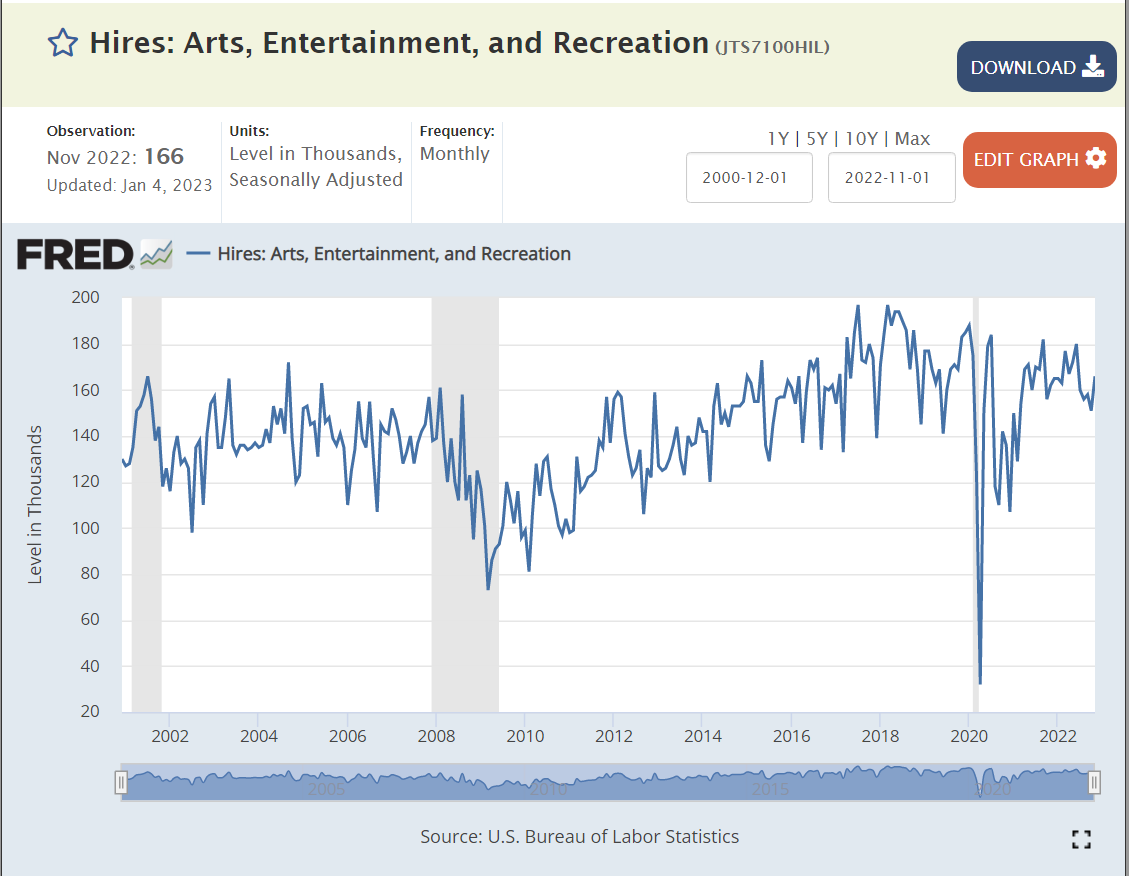
The Arts sector has recovered to its pre-pandemic level of hiring.
Hiring in the Wholesale Trade industry fell from 180K to 120K with the Great Recession but has since recovered to 160K.
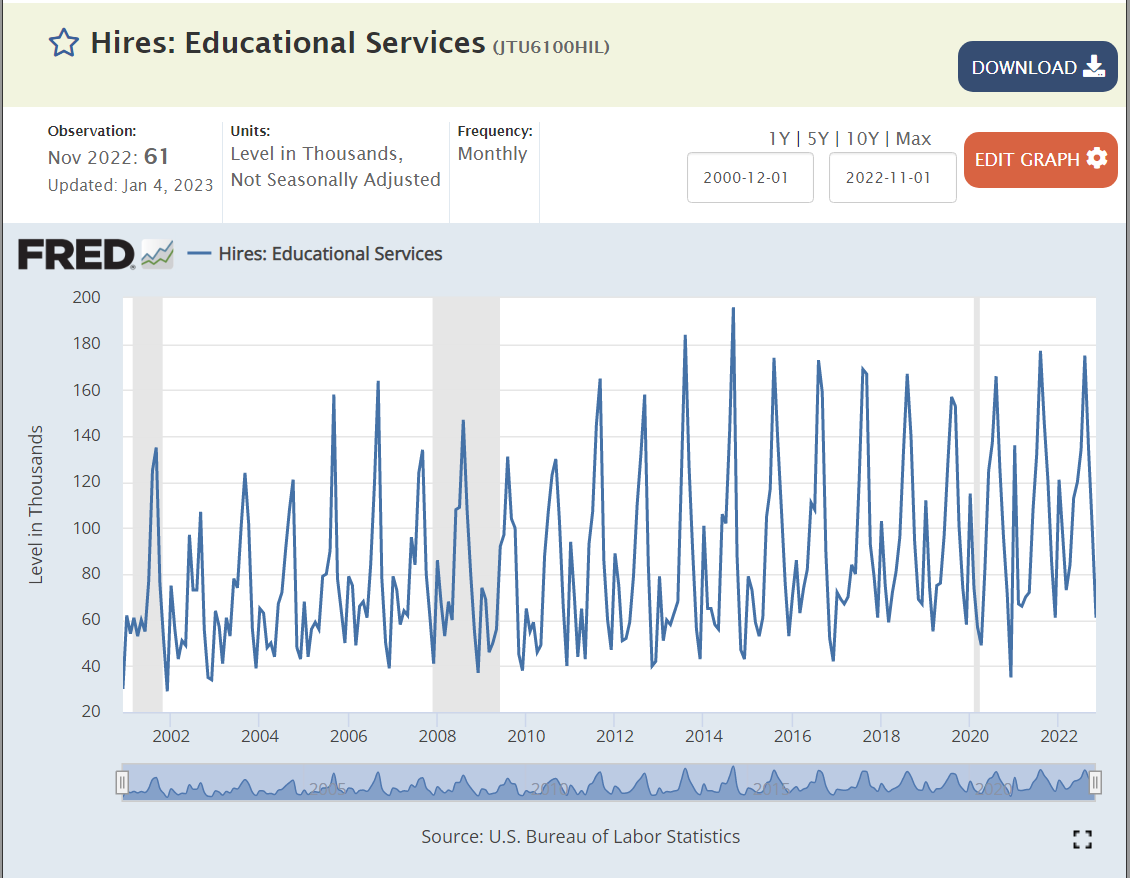
The Education industry has continued with its increased hiring.
Summary
The annual rate of new hires has dropped by 10% from 6.6M to 6M. 9 of the 12 sectors have drifted sideways. 3 have fallen significantly in the last 9 months: professional and business services, retail trade and transportation, warehousing and utilities. The economy is clearly in a slow-down period, but the ongoing trend of growth is clear.
During 2021-22, Florida Governor Ron DeSantis appointed 29 people to various Florida state college and university boards.
They included 8 business leaders, 3 real estate professionals, 5 doctors, 3 lawyers, 2 accountants, 3 educators, a banker, a farmer, a government leader, a not-for-profit leader and a public relations leader.
The 11 news articles emphasized the nominees’ professional and civic achievements. None mentioned any strategic agenda or revolution desired by the governor.
22 men and 7 women.
Every nominee was a Florida resident, with most highlighting their long ties to the state. One was touted as a “fifth generation” Okeechobee resident. Most highlighted their Florida college degrees. A handful listed experience with national US firms or military experience. Many listed their other board of director experience. Only 3 had obvious political roles in their biographies. Dr. Madhu Sasidhar, president of Cleveland Clinic, Port St. Lucie is the only nominee with limited Florida ties.
The governor’s office, board nominees, journalists and advocates from both parties highlight that the 6 recent 2023 appointments to New College of Florida’s board are intended to “revolutionize” the small (700 student) college in Florida.
The governor is only revolutionizing one institution. This appears to be for national political purposes. Florida voters, visitors, alumni and politicians need to consider what their response would be if the governor, of his own accord, decided that it was time to “revolutionize” an institution that they attended or supported.
The “contract system” replaces distribution requirements. Students cooperate/negotiate with a faculty sponsor to define their “program of study”, term by term. Foreign language requirements gone. Western civilization gone. Religion gone. Humanities gone. Science gone. Each student will have a “major” in order to graduate, but the first 1-2 years can be very flexible. The student-faculty relation/interaction is essential. Starting with just 100 “high potential” 18-year-olds in 1964.
Narrative evaluations replace letter grades. Pass, fail or incomplete. Faculty try to clearly define “mastery” up front for each course, tutorial or project. Real feedback is provided in person and in writing regarding progress and “opportunities for improvement”. Faculty and students are fellow learners, but standards are high; basically elite graduate school level.
Many independent study projects are required for all students. Tutorials with significant “independent study” components are offered by faculty to cover subjects not frequently offered. Students are encouraged to ” define their program of study, including the creation of interdisciplinary majors.
A senior “honors thesis” is required for graduation. The ability to research and write at a high level is required. Students must pass an oral examination of their thesis and related “major” program of study. Quasi-graduate school for undergraduates.
The US is leaving behind the pains of the 1930’s and 1940’s, enjoying more than a decade of solid economic growth. The business cycle is still very relevant. Rapid and extended post-war growth was unexpected once the economic demand of the war fell off. General economic growth into the future is now generally expected by 1964. The Keynesian economic model and policy prescriptions appear to be working. But true poverty continues in both urban and rural areas, especially among the elderly. Union-management relations remain tense, with strikes and labor actions frequently in the news.
Social Context
This is a conformist period where most individuals are willing to “go along to get along” in a world that is generally deemed positive by most. Religious attendance increases and conformist symbols on money “in God we trust” and the pledge of allegiance are adopted in the context of the Cold War. There is no 4th religious “Great Awakening”, but Pentecostal and fundamentalist churches see rapid growth. The Roman Catholic Church works through the second Vatican Conference to reform, update, reorganize and modernize the church. Mainstream Protestant churches are at the peak of their membership and influence. Liberal Paul Tillich is the representative theologian, emphasizing “matters of ultimate concern” and “the courage to be”. “Rock and Roll” music grows as an expression of teenage independence, but the “British Invasion” is yet to come. Racial justice is growing as a major topic, south and north. National and regional politicians take small steps forward on race as liberal judges take controversial larger steps ahead.
Global Context
The Cold War is topic A, B and C. The threat of nuclear war is omnipresent with students learning to “duck and cover” and citizens and communities building “bomb shelters”. Oppenheimer and other scientists who wish to “limit” further development are sidelined by the military and national leaders. Eisenhower warns about the power of the military-industrialist complex as he retires. The United Nations fills some global functions and Europe begins its long journey of integration. The US builds NATO into a strong alliance and supports the recovery of Germany, Japan and Europe through the Marshall Plan. Imperial/colonial holdings are released around the world within the context of the Cold War. Military technology continues to advance. The US is shocked by Soviet rocket, nuclear and satellite advances and invests in programs to recapture the lead. Displaced people and immigrants are resettled. Limited food production, oil availability and unlimited population growth are highlighted as a new Malthusian challenge. The pain is mostly felt in the “less developed” world, but policy elites highlight the risks. The Peace Corps is founded.
Political Context
Truman rode FDR’s goodwill to victory in 1948. Eisenhower accepted the New Deal and governed in a low-key, centrist manner for two terms. Populism and McCarthyism (nationalism) were largely eliminated in the 1950’s, but the existential threat of “Red” communism in Russia, China and its allies remained as a major political debate. Modern conservativism began with the academic scribblings of Russel Kirk (1953), the voice of William Buckley (1955) and the political moxie of Barry Goldwater and Ronald Reagan. However, John Kennedy squeaked out a narrow win over Richard Nixon in 1960 and provided that time with an idealistic, progressive, academically supported New Frontier and Camelot.
Intellectual Context
Some academics were walking away from the party line Marxism of China and the USSR by 1960 as the shortcomings of the economic, political and social systems were becoming apparent. They were very focused on the French existentialism of Sartre and Camus. In the shadow of “mutually assured destruction”, this was not surprising. The structuralism and post-modernist philosophies emerged at this time but did not quickly impact American cultural life. Universities were growing rapidly in this period, fueled by the GI Bill and the coming Baby Boom freshmen.
Public intellectuals were still a significant part of national debates about politics, technology, the economy and culture. The mainstream media provided print, radio and TV stages for public debate.
The “popular” intellectual debate was largely focused on the eclipse of the individual versus the power of the group, whether that group was society, advertisers, corporations, neighbors, property developers or government.
The continued growth of science and technology as practical applied science and theory was also a major concern at this time. The split between scientists and the humanities scholars was emphasized. The changing view of “science” as a firm, fixed, objective body of work conducted by objective scientists was also called into question.
The local (Sarasota and Florida) and national founders of the college were shaped by the context of the period. In hindsight, it is clear that they worried about growing “individuals” who could resist the power of the various social and organizational forces that demanded compliance. This was not a left- or right-wing political initiative. These were business, government and university elites doing their best in a patriotic American way to shape a new institution in a growing city, state and country.
60 years later, it’s not clear that these founding principles were “leaning left”. The focus was on the individual, not on the community, society, nation, state, religion, history or culture. The founders: well-minded business, religious and academic elites, emphasized this dimension of education because they believed that a simple, patriotic, conventional, practical, productive, well-defined, professional, feasible, traditional model of education was simply inadequate. It’s 1960. Two dozen successful people got together to form a new college in a resort town. They did a quick SWOT analysis (strengths, weaknesses, opportunities and threats) of colleges and universities. They chose to innovate. Let’s “reach for the moon”. We want to attract the “best and the brightest”. (Ouch).
College freshmen today (1960) are unduly shaped by society’s expectations. Let’s “turn them loose”. Young people are much more mature today due to their exposure to the “mass media”. They are very well educated in many high schools. Faculty and administrators are also much more highly qualified to lead the education process. Let’s fully engage them in the learning process.
This was an idealistic birth process only possible in a positive period of confident national growth.
I don’t see any incompatibility between New College’s historical educational program and associated learning environment with Florida Governor DeSantis’s stated desire to improve the critical thinking skills of students, making them less influenced by “trendy” philosophies. I believe that New College already provides a solid base in those skills. The burden of proof is on new trustees or new programs of study to better deliver the desired results.


