Trump Presidency Accomplishments

  1. Tax cuts. Corporate rates cut from 35% to 21%, closer to OECD norms. Incentives for returning profits to US. Higher income tax rate cuts.
  2. Regulation cuts. Environment, business, banking, labor.
  3. Lower environmental standards. Withdraw from Paris climate deal. Methane limits. Wetlands. Vehicle milage and emissions standards.
  4. New limits to welfare benefits: Medicare and SNAP.
  5. Antitrust investigations for telecommunications, media, internet, network advantaged firms.
  6. Increased use of Congressional Review Act (1996) to allow Congress to vote down newly implemented regulations.
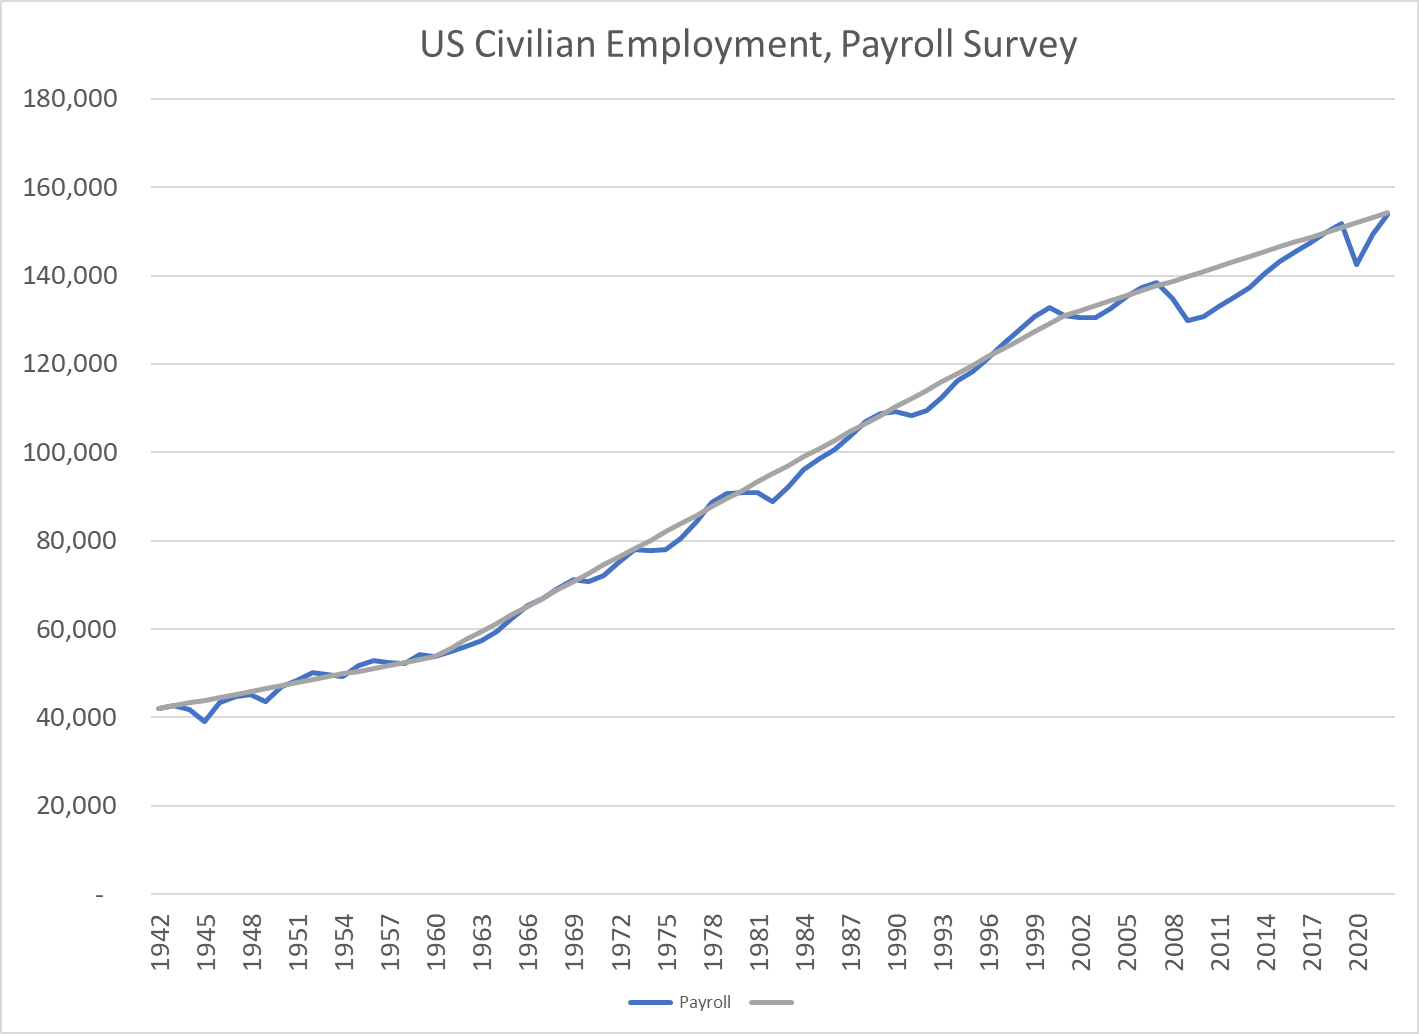
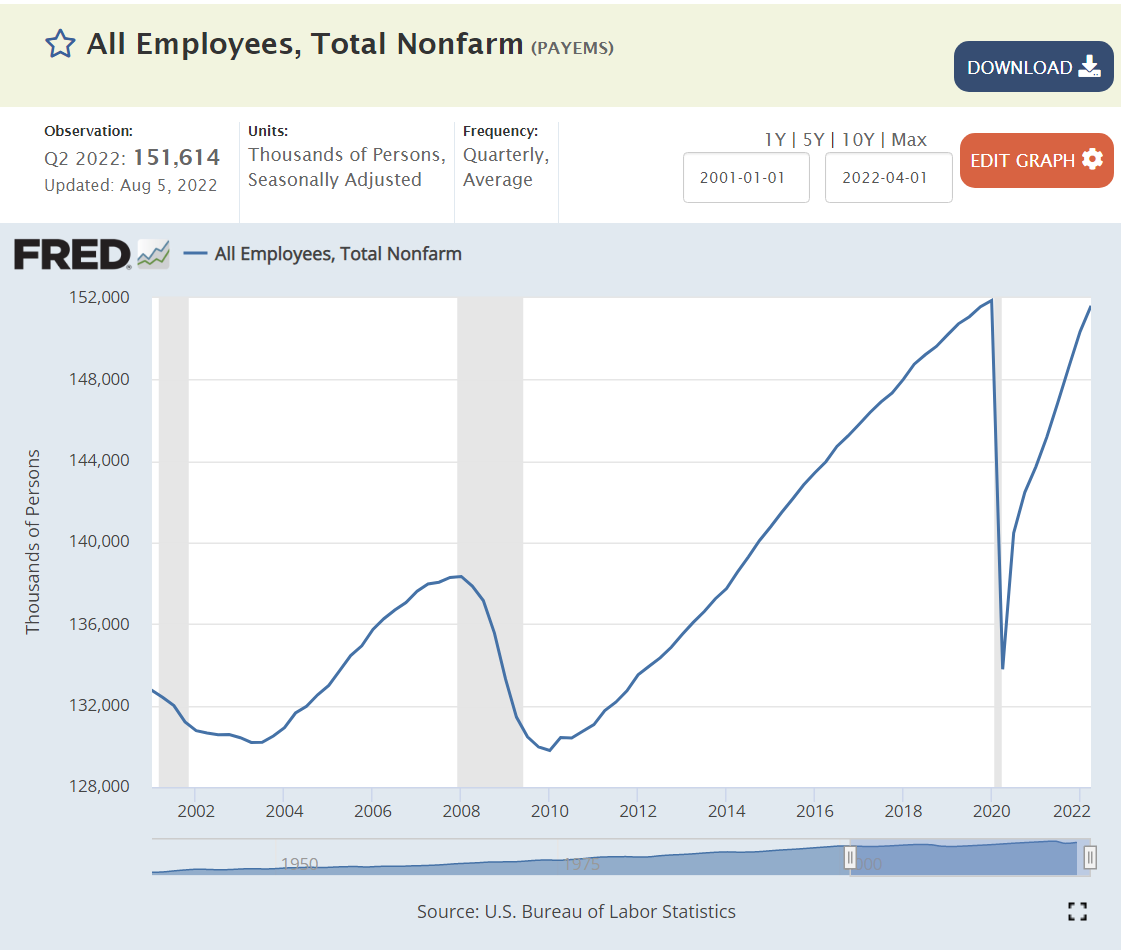
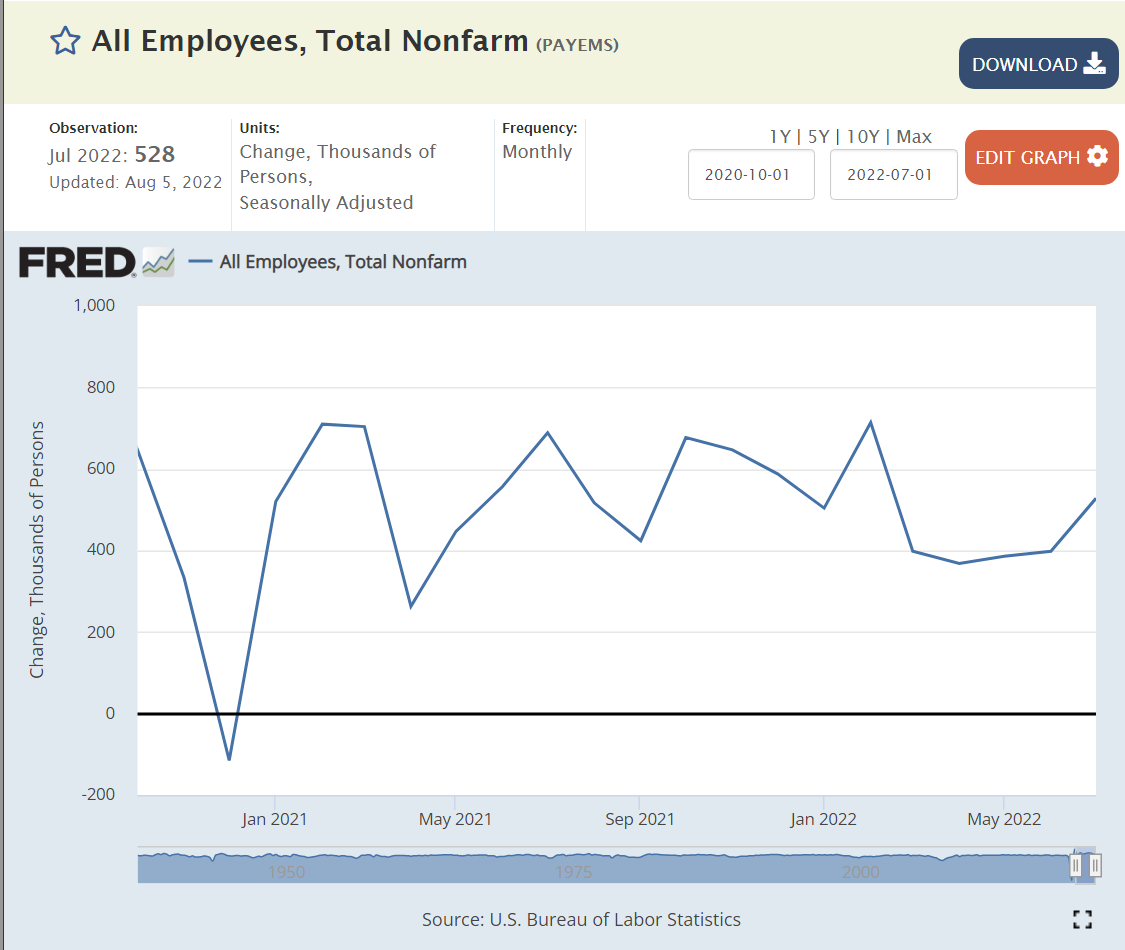
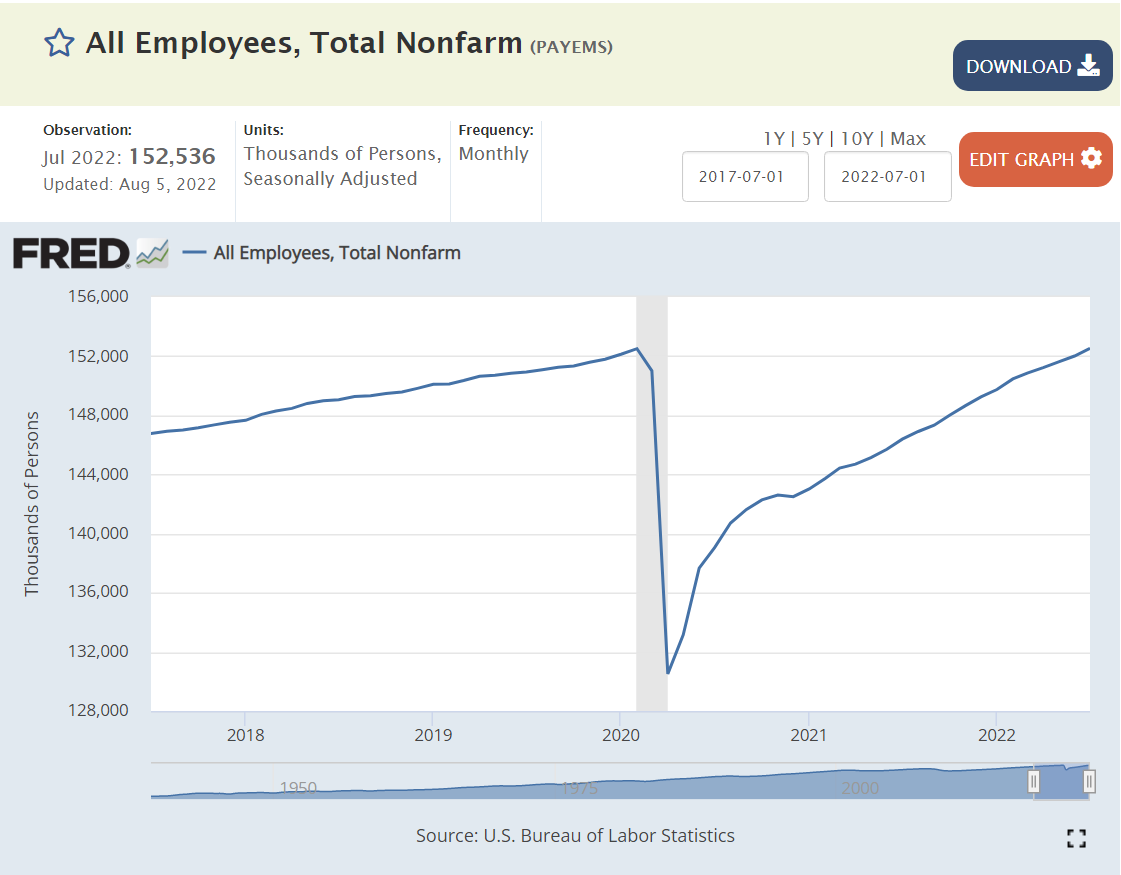
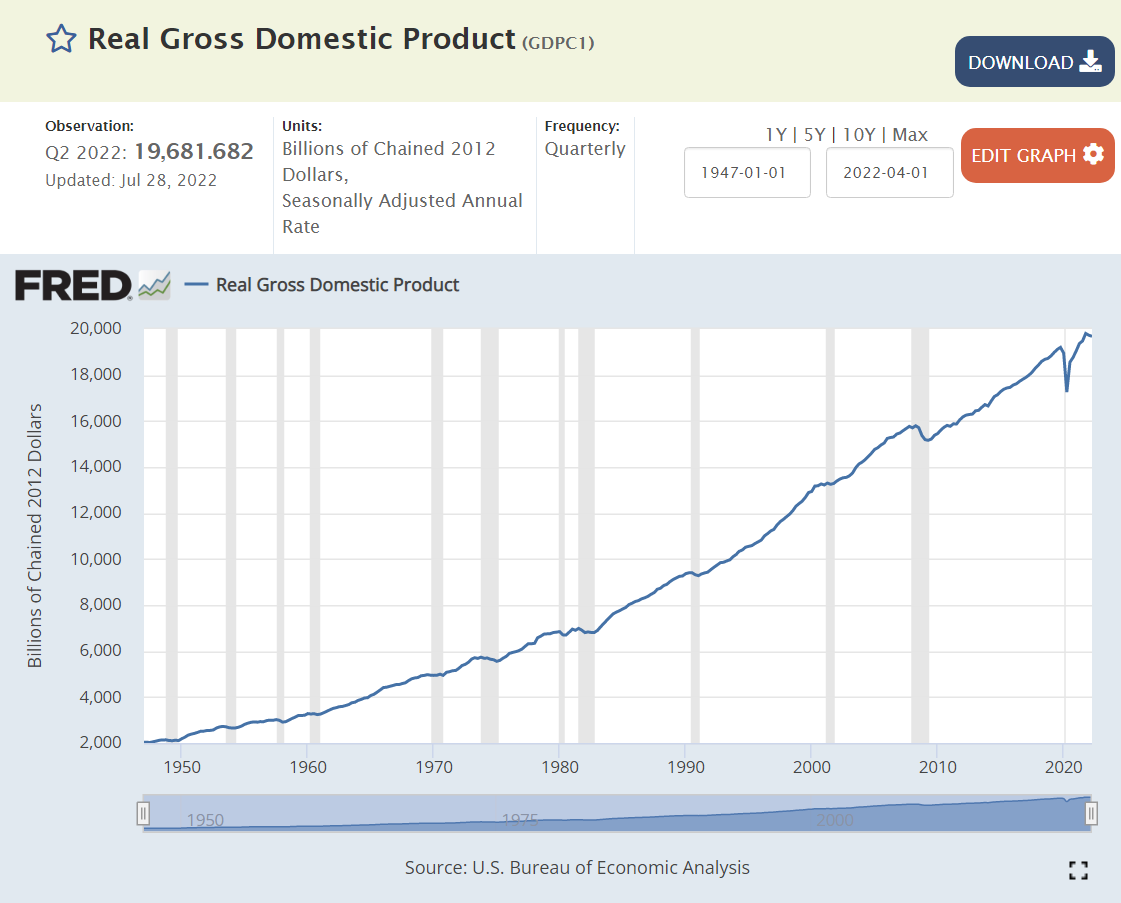
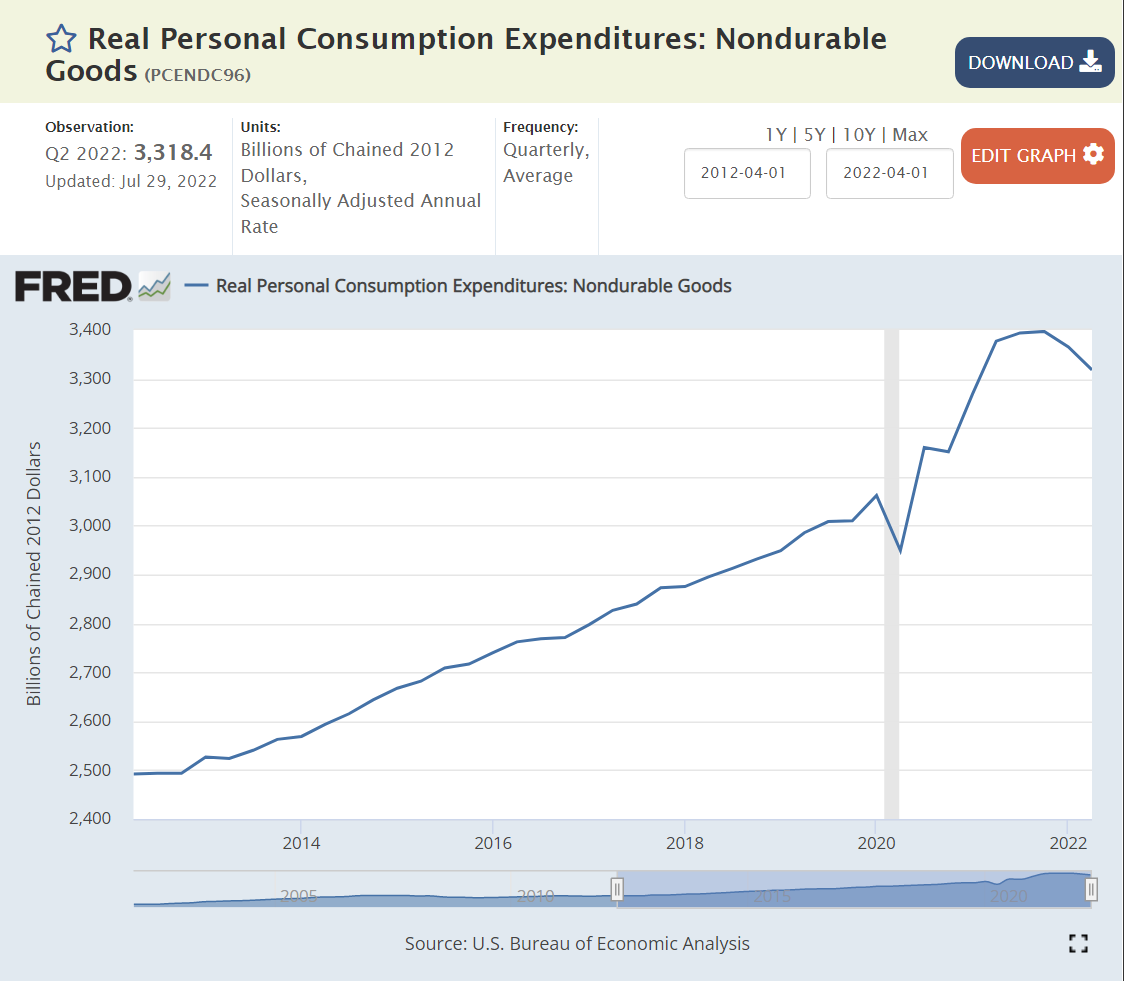
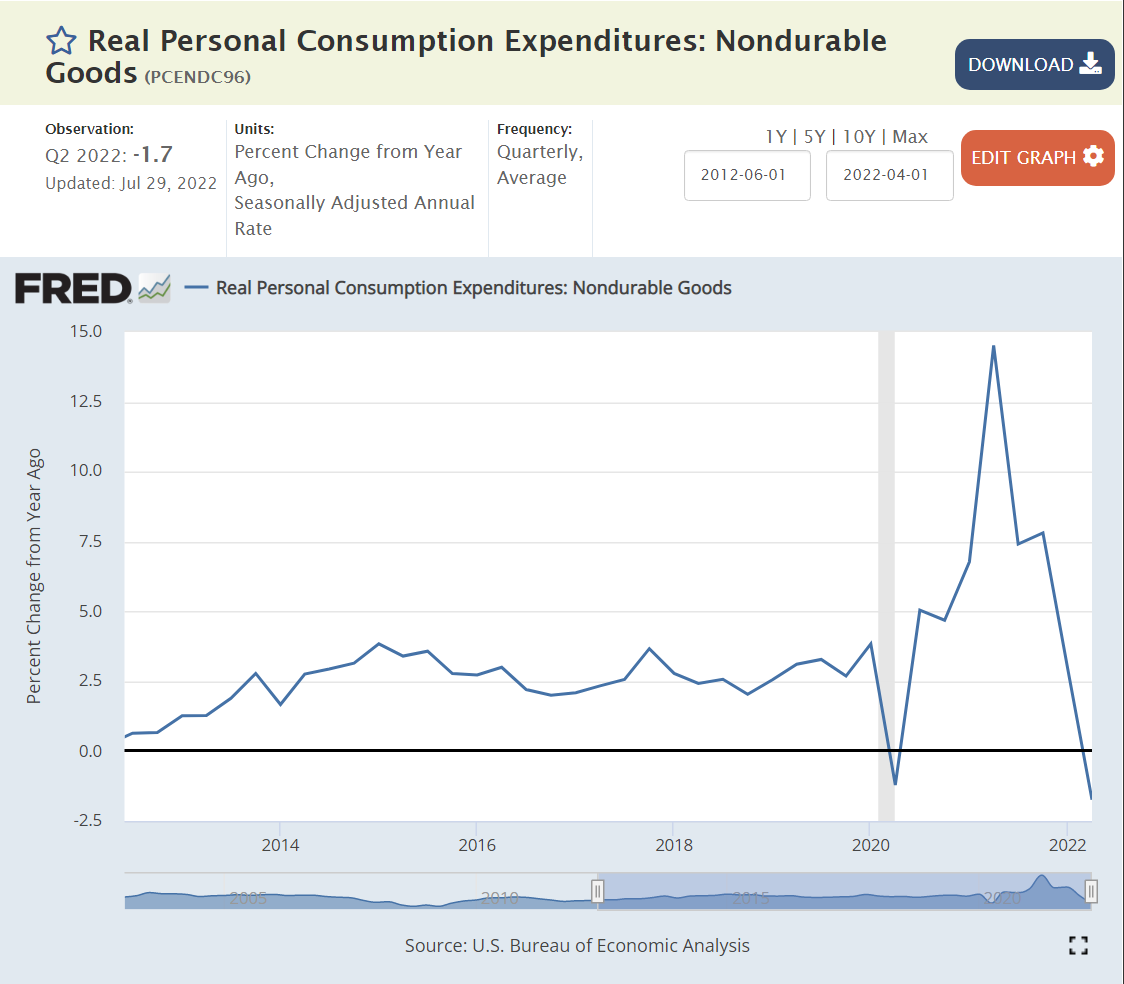
  7. Economic recovery continued for 3 more years. 2.5% annual growth. 3.5% unemployment. Stock market gains. 6.5M jobs added. Tighter labor market. Increased wages. Minority and lower income gains.
  8. Bipartisan Covid relief spending for individuals and firms.
  9. Home building increased during Trump term and afterwards.
  10. More “Middle Americans” believed that they were heard and represented.
  11. NAFTA agreement renegotiated.
  12. China relations re-evaluated. Higher tariffs on both sides. Technology limits.
  13. Presidential “bully pulpit” used to maintain some US jobs.
  14. Legislation and executive orders used to support US steel, coal and manufacturing businesses and employment.
  15. Legislation passed to improve visibility to tax shelters and tax fraud enforcement.
  16. Agriculture industry subsidies offered to offset trade costs.
  17. Trade deals with South Korea, Japan and EU.
  18. Enhanced trade policy for communications, IT, technology and AI.
  19. Increased military spending.
  20. Revised defense strategy focused on China and Russia.
  21. Flexed US military muscle in limited attacks.
  22. Actions reduced Islamic State threats to low level.
  23. Supported Israel diplomatic relations with 4 Arab states.
  24. US troops withdrawn from Afghanistan, Syria and Iraq.
  25. Opposition to dictators in Cuba, Venezuela, China and Nicaragua.
  26. Reduced support for international organizations such as WHO.
  27. Built 80 miles of new wall and 300 miles of enhanced walls on Mexico border.
  28. Negotiated improved coordination with Mexico and Central American nations regarding immigration.
  29. Reduced legal immigration from all countries.
  30. Reduced opportunities for asylum seekers.
  31. Used “zero tolerance” family separation policies to disincentivize immigrants.
  32. Removed Affordable Care Act individual mandate.
  33. Streamlined FDA approval process and made financial commitments to ensure rapid COVID vaccine development.
  34. Took steps to reduce drug price inflation.
  35. Invested in opioid drug addiction prevention and correction.
  36. Enacted market friendly policies and regulations to expand domestic energy development, furthering American energy independence.
  37. Supported the bipartisan First Step Act which reduces minimum sentences and supports recovery from incarceration.
  38. Invested in historically Black colleges and universities and vocational education (Perkins).
  39. Made small steps to support “school choice”.
  40. Appointed 3 conservative Supreme Court justices and 225 federal justices.

Trump Presidential Results

Economic Policy

  1. Deficit spending is permanently entrenched. 3-5-7% annual budget deficits do not appear to have major economic downsides in investment crowding out or inflation.
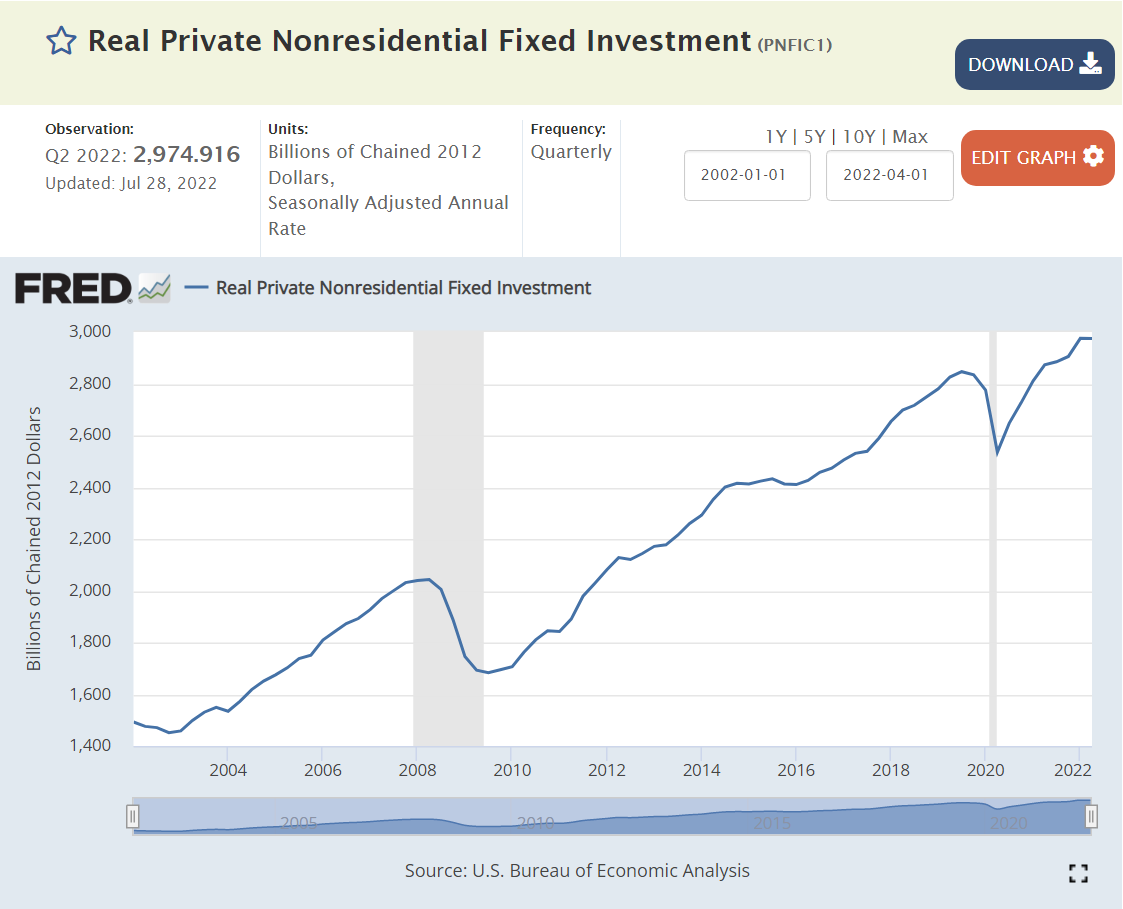
  2. Tax cuts do not generate extra growth, investment, productivity or economic resiliency. They transfer dollars to the recipients.
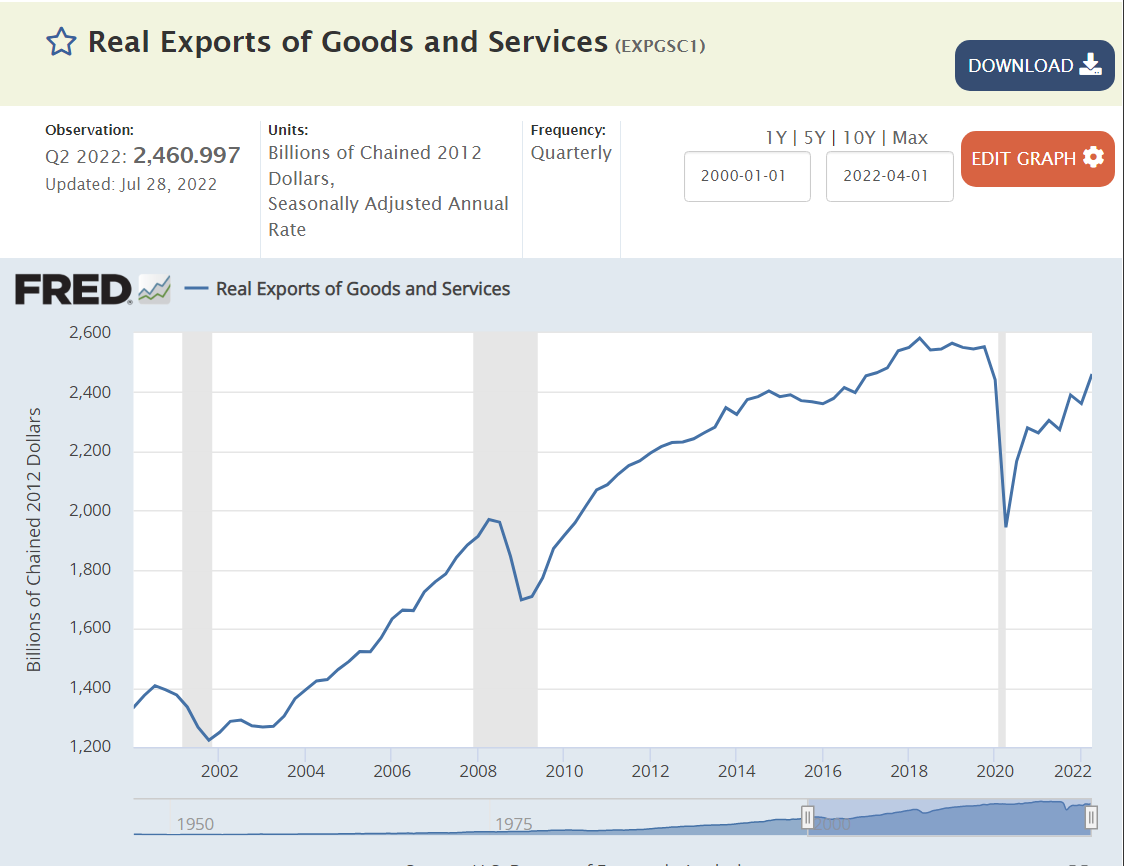
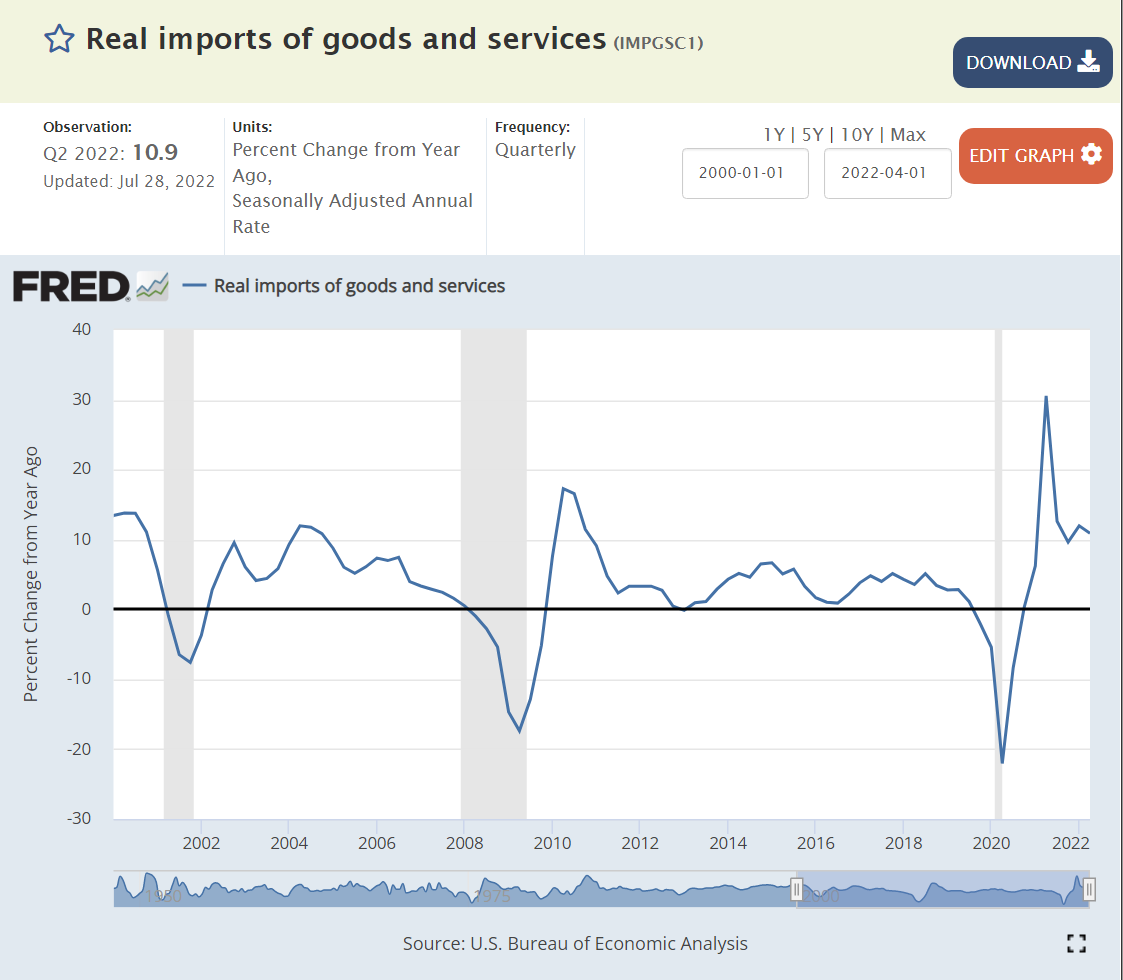
  3. Concentrated supply chains (China) are subject to significant trade, logistics, military and emergency risks which must be managed.

Foreign Policy

  1. U.S. remains the leading superpower and can pursue its own goals with less allied cooperation and attention to “niceties”, at least in the short run. See NATO, Japan, Korea, climate.
  2. China is the number one competitor.
  3. U.S. and Russia relations are no longer based on Cold War issues. The “Hawks versus Doves” dimension competes with domestic political parties.
  4. Negotiating with nuclear states (Iran, North Korea) is very difficult, even for a superpower.
  5. Europe has its own international interests. It will pursue them. It cannot rely upon the U.S. for its defense.

Domestic Policy

  1. Bipartisan immigration policy may be impossible.
  2. Supreme Court and judicial politicization may drive structural changes/reforms.
  3. Racial relations and inequality will be a top political issue for decades.
  4. Wedge issues – abortion, guns, school content/choice, liberty, gay rights – will remain a focus of both parties.
  5. Traditional social security, Medicare and Medicaid are untouchable.
  6. Obamacare is now essentially untouchable. Lower income citizens will have health insurance.

Democracy at Risk

  1. Legitimacy of media, press, free speech threatened.
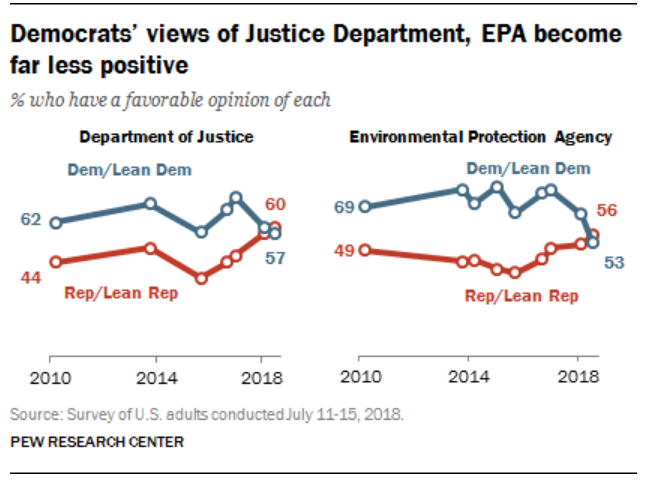
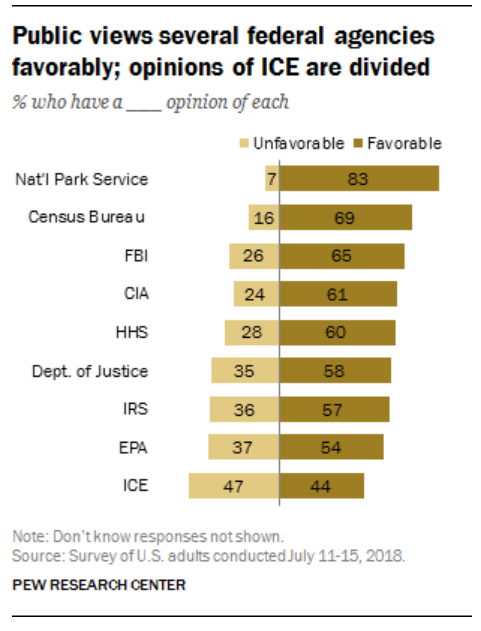
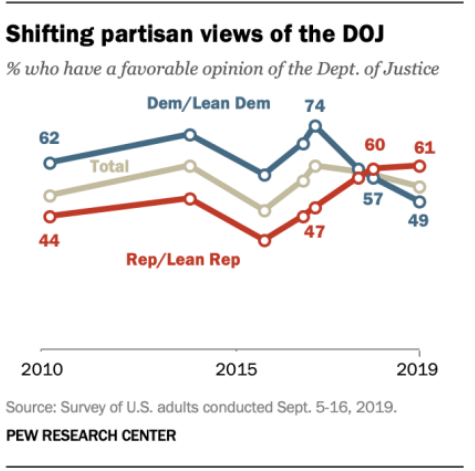
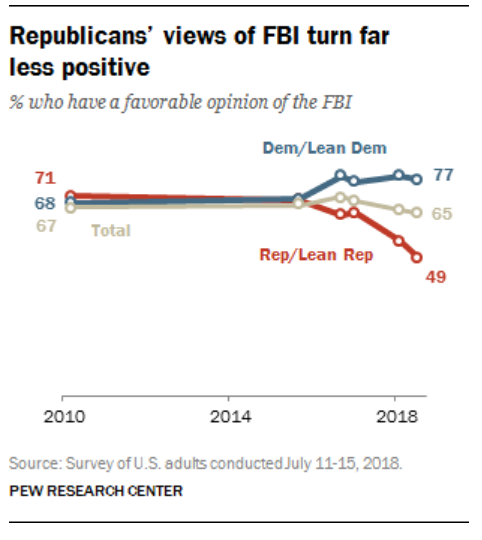
  2. Government employees, courts, justice system, law enforcement threatened.
  3. Schools, universities and teachers threatened.
  4. Legitimacy of voting processes threatened.
  5. Illiberal democracy, authoritarianism have more support.
  6. Gerrymandering, voting rules, campaign funding rules undercut public confidence.
  7. Voter participation has increased in response.

Communications Policy

  1. Media attention is priceless and can be manipulated by extreme statements and behavior.
  2. Traditional media “fairness” approach (quotes from both sides) can be manipulated to support unsupportable claims.
  3. Every media outlet or actor has some degree of bias. Consumers are more aware, but many choose to only reinforce existing beliefs.
  4. The president has the opportunity to control/influence the attention of the media.
  5. Facts and objectivity are not respected by some media voices. The pattern of communications statements and framing of subjects can be much more important than content.
  6. Political actors are not held accountable for false claims or exaggerated promises. Claims and promises are just tools to motivate the faithful.

Rules of Politics

  1. President has tremendous power. International agreements. Regulations. Executive orders. Bully pulpit. Political party discipline. Using power seems to have little downside.
  2. Only winning matters. Not popularity, broad support, bipartisanship, appearances, fairness, mud, litigation, critics, impeachment, norms, tradition or relations.
  3. Polarization strategy is more effective than building a central coalition. Motivating your team to vote is more important than persuading independent voters.
  4. Candidate character does not matter. Politicians are salesmen and saleswomen. They are lawyers. They are tools, not statesmen.
  5. Party/team winning is most important factor. 400,000 covid deaths were not enough to spark a revolution. Deaths were traded off against economic opportunity without negative political impact.
  6. Harry Truman’s “buck stops here” responsibility position is not required. No one was responsible for Covid results.
  7. Administrative competence is not required to hold office or to run the federal government (so far). Slow appointments, fast cabinet turnover, acting secretaries, department heads that oppose the role of their departments.
  8. President represents his team and interests, not the whole country.

Party Policy

  1. Philosophical conservatives have departed the Republican party and lost influence.
  2. Moderate Republicans (RINO) have mostly departed, have no political candidates and no influence in the national party.
  3. Extremist groups (race, religion, military, nationalist) are not opposed.
  4. Traditional business interests have much less influence (immigration, social issues, antitrust, trade limits, industrial policy, presidential threats, banking, bailouts).
  5. Pragmatic policies and legislation remain largely unimportant. No party platform for 2020. Everyone in the party “knows” basic positions on all issues. No budget policy debates. No health care alternative to Obamacare. No abortion policy. Statements of preference and intent and belief are more important than wonkish details.
  6. Highlighting the threats and follies of the most leftist Democrats is the most effective means to motivate true believers and maintain support of more independent minded voters.
  7. Only a few federal level policies really matter. Tax and regulation cuts. Social wedge issues. Most other topics can be “managed” with small policy victories and messaging.
  8. Party discipline is essential. Republicans are obligated to support the political winners in their party, not to represent all Republicans or all Americans or to “solve problems”.
  9. Managing the voting system (districts, rules, methods) is as important as policies, candidates, fundraising and communications strategies.

Summary

Trump has revolutionized modern American politics. The Reagan revolution consolidated conservative voters, clearly aligning them with the Republican party. The Gingrich revolution further separated the two parties, emphasizing winning and party allegiance. Republican candidates and voters engaged in a reinforcing cycle of “purist” policy aims such as no tax increases, “drill baby drill” environmentalism, banning abortions, and “bomb baby bomb” anti-terrorism. The Great Recession and the tea party further motivated populist leaning voters to demand populist policies and appeals. Trump modified many historical Main Street and Wall Street Republican policies to make the party better embrace the populist mood and “make American great again”.

Trump’s “only results matter” approach has further transformed the party and the nation. His presidency delivered some key political accomplishments. It also produced many “results” that will shape American politics, economics, society and debate for years to come.

https://www.bbc.com/news/world-us-canada-37982000

https://www.pewresearch.org/2021/01/29/how-america-changed-during-donald-trumps-presidency/

https://www.washingtonpost.com/politics/2021/01/20/trump-promised-his-supporters-everything-he-didnt-deliver-most-it/

https://www.politifact.com/truth-o-meter/promises/trumpometer/

https://www.politico.com/news/magazine/2021/01/18/trump-presidency-administration-biggest-impact-policy-analysis-451479

https://trumpwhitehouse.archives.gov/trump-administration-accomplishments/

https://www.vox.com/policy-and-politics/2019/12/2/20970521/trump-administration-achievements

https://www.reuters.com/article/us-usa-trump-legacy-factbox/factbox-donald-trumps-legacy-six-policy-takeaways-idUSKBN27F1GK

https://www.propublica.org/article/the-government-donald-trump-left-behind

https://www.mcleancountyrepublicans.org/trump_administration_accomplishments

https://www.businessinsider.com/trump-biggest-accomplishments-and-failures-heading-into-2020-2019-12#failure-covid-19-pandemic-12

https://www.washingtonpost.com/outlook/2021/01/20/trump-legacy/

https://apnews.com/article/fact-check-donald-trump-farewell-remarks-f911b5ea84a2b69291aa6f52b9ef6318

https://www.barnesandnoble.com/w/trump-got-it-done-jack-t-adams/1139526046

https://foreignpolicy.com/2020/10/14/trump-foreign-policy-wins-losses-over-four-years-china-middle-east-coronavirus-pandemic/
https://www.maciverinstitute.com/2021/01/on-policy-donald-trump-was-by-far-the-most-effective-consequential-conservative-since-reagan/

https://www.newsmax.com/bestlists/donald-j-trump-accomplishments-america-first/2021/06/14/id/1025067/

https://www.thedailybeast.com/even-liberals-have-to-admit-trump-had-real-successes-on-the-economy

https://www.cbsnews.com/news/trump-view-historians/

https://www.pewresearch.org/fact-tank/2021/03/29/a-partisan-chasm-in-views-of-trumps-legacy/

https://www.belfercenter.org/publication/trump-legacy-and-its-consequences

https://www.cnn.com/2021/08/30/politics/trump-legacy-fake-news/index.html

https://www.reuters.com/article/usa-trump-legacy-analysis-int/analysis-trumps-legacy-a-more-divided-america-a-more-unsettled-world-idUSKBN29P0EX

https://www.cfr.org/article/donald-trumps-costly-legacy

https://www.usatoday.com/story/news/politics/2021/01/20/trump-legacy-how-history-see-presidents-tumultuous-four-years/4158507001/

https://www.pbs.org/newshour/show/what-will-trumps-legacy-be-after-leaving-office

https://www.yahoo.com/video/what-is-president-trumps-legacy-203123599.html

https://thehill.com/opinion/white-house/531734-trumps-legacy-an-enduring-contempt-for-truth/
https://www.brookings.edu/research/tracking-turnover-in-the-trump-administration/

Good News: The US Economy is a Job Creating Machine

https://www.copelandintl.com/blog/oilfield-equipment/the-best-allison-transmission-models-for-your-industry/

In 1942, the US economy employed 41.9 million people in firms. At the end of 2022, the number will be 153.8 million, an increase of 267%. Yes, for very 3 jobs in 1942, we have 11 today. Yes again, almost 4 times as many in 2022 versus 1942, despite the 9 million jobs lost in 2008-9 and the 9 million jobs lost in 2020.

https://fred.stlouisfed.org/series/PAYEMS#0

The US economy added 12 million jobs between 1942 and 1960, growing from 42 to 54 million positions. Job growth averaged nearly 700,000 per year or 1.4% annually. This was a period of solid growth, despite the 4 recessions.

https://fred.stlouisfed.org/series/PAYEMS#0

The period from 1960 through 2001 showed truly remarkable job growth. The economy added 78 million jobs, almost 1.9 million each year or 2.2% annually. STOP and think about this. The Greatest Generation, WW II saving the planet team was just 40 million employees in the US. The immediate post-war boom increased employment to 55 million when the US was the only advanced economy running at full speed. But employment growth accelerated from 1960 to 200. These 4 decades essentially tripled the size of the US economy.

https://fred.stlouisfed.org/series/PAYEMS#0

Overall, the last two decades have delivered much slower job growth. Using 2019 as an ending measure, the economy grew by 21 million jobs, from 131 to 152 million since 2001. This is just 1.1 million per year, or a growth rate of 0.8%, far below the 2% plus rate of 1960-2000. Or, the 21 million added jobs is one-half of the jobs in 1942 in the heart of WW II.

But, these two decades experienced the post-millennium downturn, the great recession and the covid pandemic.

The economic recovery from the millennium (Y2K) was quite slow. The recovery from the Great Recession was slow but strong and extended, allowing unemployment rates to eventually reach 3.5%. The recovery from the pandemic situation was much faster than expected, reaching pre-pandemic levels of GDP and employment within 2 years.

The economy has been adding 400,000 jobs each month since the beginning of 2021, almost an amazing 5 million jobs annually.

Million Jobs Added Per Year in Economic Recovery Periods

1948: 2.0

1952: 2.2

1956: 1.8

1959: 2.0

1969: 1.9

1973: 2.4

1980: 2.2

1990: 2.5

2000: 2.7

2007: 1.6

2019: 2.2

The US economy adds 2 million jobs each year when the economy is expanding. The percentage growth rate is slower through time, but the 2 million jobs added each year remains a solid capacity or capability.

Summary

The US economy added 1.4% new jobs annually from 1942-1960. The jobs growth rate averaged a very strong 2.2% from 1960-2021. It then slowed to just 0.8% annually while digesting the Great Recession and the COVID pandemic. The economy added more than 2 million jobs each year after the Great Recession, pushing unemployment to a very low 3.5%. The economy rebounded from the pandemic much faster than the consensus view,

https://fred.stlouisfed.org/series/PAYEMS#0

Despite

  1. increased international trade
  2. greater share of immigrants
  3. greater percentage of federal government spending
  4. fewer new businesses started
  5. declining shares for agriculture, mining and manufacturing
  6. greater outsourcing of corporate functions
  7. greater share of contracting, non-traditional employment, part-time employment
  8. lower rates of geographic mobility
  9. lower rates of economic upward mobility
  10. greatly increased political polarization at the state and local level
  11. decreased labor force participation rates
  12. increased opioid and drug damage rates
  13. lower community service participation rates
  14. lower church attendance and membership rates
  15. lower male college attendance and graduation rates

Despite the very many headwinds, the US economy is still able to add 2 million jobs annually during economic recovery periods. It added 9 million positions in 2021 and looks to add almost 5 million positions in 2022 despite the weakening business cycle. Even with a slowing economy, the US is likely to add 2 million new positions in 2023 and 2024.

Good News: Better Refrigerator Capacity, Energy Efficiency and Real Prices

https://www.vox.com/energy-and-environment/2019/5/31/18646906/climate-change-california-energy-efficiency
https://appliance-standards.org/blog/how-your-refrigerator-has-kept-its-cool-over-40-years-efficiency-improvements

Between 1972 and 2014, the size of an average refrigerator grew by about one-fourth, adding 5 cubic feet.

From 1972 to 2010, the real, inflation adjusted, price of a refrigerator was cut in half.

From 1972 to 2010, the average annual energy use was reduced by three-fourths (75%), from 2,000 to just 500 KwH per year.

https://blog.sense.com/how-much-energy-does-your-refrigerator-really-use/

An Energy Star model in 2020 was another 30% more energy efficient than in 2010.

https://www.eia.gov/todayinenergy/detail.php?id=3030

The US consumes more than 8 million new refrigerator units each year.

https://www.eia.gov/todayinenergy/detail.php?id=3030

Refrigerators have become more reliable through time, now averaging 12 years old.

https://www.energy.gov/energysaver/shopping-appliances

https://www.eia.gov/consumption/residential/reports/2015/overview/

The share of homes with more than one refrigerator doubled between 1997 and 2015, reaching 30%.

https://www.ibisworld.com/industry-statistics/market-size/refrigerator-freezer-manufacturing-united-states/

The US market is roughly $5 billion dollars, growing slowly.

https://fred.stlouisfed.org/series/CUSR0000SAH3

The US Dept of Labor does not publish a consumer price index specifically for refrigerators, but the category it belongs in showed essentially zero nominal inflation between 1994 and 2018. The real price decline shown in the first chart probably continued through 2018.

Refrigerators and appliance prices spiked by more than 10% in 2021 as consumer demand for durable goods grew 20% during the pandemic, supported by government transfer payments.

https://www.foxbusiness.com/economy/consumers-slapped-with-home-appliance-price-hikes-as-input-costs-soar

https://www.eia.gov/todayinenergy/detail.php?id=37813#:~:text=As%20a%20group%2C%20refrigerators%20use,of%20total%20refrigeration%20consumption%20nationwide.
https://www.researchgate.net/figure/Household-Electricity-Consumption-Source-Adapted-from-EIA-2001-Figure-1_fig1_228665463

Refrigerators now account for just 7% of home electricity consumption, down from 14% in 2001.

Opinion writers differ on who gets credit for the improved price/performance results for refrigerators, but it seems clear that both energy standards and inventive firms share credit.

https://www.vox.com/energy-and-environment/2019/5/31/18646906/climate-change-california-energy-efficiency

https://appliance-standards.org/blog/how-your-refrigerator-has-kept-its-cool-over-40-years-efficiency-improvements

https://fee.org/articles/thanks-capitalism-refrigerators-are-awesome/

Trust in the DOJ and the FBI

Republican Trust in the DOJ Has Improved Significantly Since 2015

https://www.pewresearch.org/politics/2018/07/24/growing-partisan-differences-in-views-of-the-fbi-stark-divide-over-ice/
https://www.pewresearch.org/politics/2019/10/01/public-expresses-favorable-views-of-a-number-of-federal-agencies/
https://www.pewresearch.org/politics/2020/04/09/public-holds-broadly-favorable-views-of-many-federal-agencies-including-cdc-and-hhs/

Trust in the Department of Justice (DOJ), overall, has been relatively flat. Republican support has increased while Democratic support has dropped.

Historically, Republicans Strongly Supported the FBI

https://fivethirtyeight.com/features/why-democrats-and-republicans-did-a-sudden-180-on-the-fbi/
https://www.pewresearch.org/politics/2018/07/24/growing-partisan-differences-in-views-of-the-fbi-stark-divide-over-ice/

Historically, Republicans have been conservative, supporting the police, military, FBI, defense, “law and order”, criminal justice and “black and white” law enforcement. While the DOJ and some other federal agencies have been staffed by left-leaning coastal elites, the FBI has been staffed by more conservative leaning individuals.

https://www.politico.com/story/2016/11/fbi-donald-trump-base-230755

Overall Support for the FBI has Remained High, but has Become Polarized

https://www.pewresearch.org/politics/2018/07/24/growing-partisan-differences-in-views-of-the-fbi-stark-divide-over-ice/
https://news.gallup.com/poll/257489/fbi-positive-job-ratings-steady-among-americans.aspx
https://www.pewresearch.org/politics/2019/10/01/public-expresses-favorable-views-of-a-number-of-federal-agencies/

Different survey questions produced different results, but the FBI is one of the most respected federal agencies.

Trump’s 2018 Attacks on the FBI Drastically Reduced Republican Support for the FBI (see above and below)

https://www.pbs.org/newshour/politics/fbi-support-is-eroding-but-most-americans-still-back-bureau-poll-says

The Republican versus Democratic split widened.

https://www.vox.com/latest-news/2018/2/3/16968372/trump-fbi-republican-poll-confidence

https://www.huffpost.com/entry/republican-confidence-in-the-fbi-has-dropped-since-2015_n_5a721bbbe4b09a544b5616a7

https://ssri.psu.edu/news/mccourtney-institute-mood-nation-poll-examines-public-trust-fbi

Republican’s Response to Trump’s Claims Were Severe

https://democracy.psu.edu/poll-report-archive/poll-report-republicans-no-longer-trust-the-fbi/
https://www.huffpost.com/entry/republican-confidence-in-the-fbi-has-dropped-since-2015_n_5a721bbbe4b09a544b5616a7

https://www.politico.com/story/2018/02/03/conservatives-fbi-trump-republicans-389076

Republicans Were Much Less Supportive of the FBI in 2019 versus the Democrats

https://www.pewresearch.org/politics/2019/10/01/public-expresses-favorable-views-of-a-number-of-federal-agencies/
https://news.gallup.com/poll/257489/fbi-positive-job-ratings-steady-among-americans.aspx

Context: Americans’ Belief in or Trust of Institutions Has Been Declining for Decades

https://news.gallup.com/poll/192581/americans-confidence-institutions-stays-low.aspx

Huge 10% drop in the middle of George W Bush’s presidency. 5 institutions with 10% or greater drops in support.

https://news.gallup.com/poll/352316/americans-confidence-major-institutions-dips.aspx

Widespread further decline in support of “institutions” during the pandemic.

https://news.gallup.com/poll/394283/confidence-institutions-down-average-new-low.aspx

The broad decline continues in 2022. Can it continue?

I’m Very, Very, Very Scared

538 has a similar article but refuses to link directly. Worth your time to query and copy.

“What Happens When Americans Don’t Trust Institutions?”

If only one-quarter of Americans trust in its basic institutions, how can we have democracy and capitalism and “western civilization”? If “everything is broken”, then we need a dictator or a revolution. Really? Really? Really?

I have to blame the 16 year-old me for some of this. In 1972, we were all opposed to “the man”, “the organization man”, “the establishment”, etc. We were children of the hard-won victory of democracy and capitalism against fascism and imperialism and communism. We believed in progress, science, growth and possibilities. We were skeptical about the Vietnam war, the military, McNamara and his whiz kids, General Curtis LeMay, big corporations, compromises, limitations, bureaucracy, bigness (small is beautiful), population growth, technology, etc. Many of us deeply believed in a romantic idealism or utopianism, making stodgy historical institutions so irrelevant.

Fast forward 50 years and I (we) possess a fundamentally conservative view, embracing the need/value of institutions and channeling our inner Edmund Burke to emphasize the value of the accumulated wisdom of society.

https://en.wikipedia.org/wiki/Edmund_Burke

So, the overall decline in trust of American institutions is a real challenge. The decline in trust in the FBI is clearly (IMHO) a Trump driven result. This, too, is a real challenge to our democracy. Do we (I) really believe that the leadership and staff of the FBI have abandoned their democratic principles which we have lived and supported for almost 250 years? I don’t think so. But the decline in trust/belief in all institutions combined with the increasingly politically polarized view of individual institutions makes this a reasonable view for many of our fellow citizens. We have much, much work to do in order to preserve our institutions, government and society.

Americans, Are You Better Off?

Presidential candidate Ronald Reagan skewered the incumbent Jimmy Carter in the 1980 presidential debate with this question and framing of economic issues.

https://www.youtube.com/watch?v=rU6PWT1rVUk

We are economically better off today than we were in 2019, 2016, 2012 or 2008. As a nation, we need to recognize the strong economy that has been built across several 4-year periods.

Let’s focus on just 2 measures: unemployment and real gross domestic product (GDP).

The US encountered its worst or “tied for worst” economic downturn in almost a century in 2008-9 with the Great Recession.

https://fred.stlouisfed.org/series/UNRATE

The economic recovery was relatively slow, but the economic expansion continued for a RECORD 10 years! This was followed by the pandemic recession which drove unemployment up to 15% in a mere 3 months!! In 2 years, with a never before encountered global pandemic raging and evolving, the US unemployment rate dropped from 15% back to 3.6%!!! It has since levelled off at 3.6%, just shy of the 3.5% rate before the pandemic. This is an AMAZING outcome for the economy and our citizens

https://fred.stlouisfed.org/series/GDPC1

Since WWII (1947), the real, inflation adjusted, “no fooling”, GDP of the US has increased TEN-FOLD! We can honor the “greatest generation” and the country’s sacrifices to win WWII, but the economy in the 1940’s was less than 10% of the size that it is today. This is a true “order of magnitude” change. The economy has rotated from agriculture to manufacturing to services and trade.

The real economy is THREE TIMES as large as it was when Reagan was debating Carter in 1980.

It is 25% higher in 2022 than it was in 2008, despite two major recessions.

Unemployment measures the available labor capacity that is unused. The Depression saw extended periods of 20% unemployment. The post-war period enjoyed low 4% level unemployment through 1957. The next 7 years were above 5%, setting a new expectation of what the reasonable, long-term, natural, non-accelerating inflation rate of unemployment (NAIRU) was. The next 6 years of Vietnam and social welfare spending drove a 4% average unemployment rate which most economists believed was unsustainable and which eventually drove significant increases in inflation. The 1970 recession drove unemployment above 5% where it stayed for nearly 30 years, before finally starting with a 4 in 1997. Unemployment remained below 5% for 3 years, touching a 4% low before the millennium recession. Unemployment then averaged a sustainable 5%+ for the next 6 years, reaching a low of 4.5%.

So, when unemployment rocketed up to 10% in the Great Recession, no mainstream economist expected it to return to less than 4% soon, maybe never. Unemployment eventually reached 5.0% by the end of 2015. Professional economists were sure that it had reached its bottom. But Mr. Market, Dr. Copper and Senor Economy had news for the pundits. Consistently through the next 4 years, unemployment declined another 30% from 5.0% to 3.5% without triggering increased inflation.

The subsequent reduction of unemployment from 15% to 3.6% in 2 years is an incredible result reflecting a robust economy.

Next, let’s turn to a set of global comparisons to gauge if we are “better off”.

Just 12 Countries Account for 70% of Global GDP

US, China, Japan, Germany, UK, India, France, Italy, Canada, S Korea, Russia and Brazil provide the framework for evaluating global economic results today.

https://data.worldbank.org/indicator/NY.GDP.MKTP.CD?locations=JP-DE-BR

US Unemployment Rate is Low

India, France, Italy and Brazil are saddled with 7% unemployment rates, double the US level. Canada and China encounter 5% unemployment. The UK, South Korea and Russia enjoy below 4% unemployment rates with the US. Japan and Germany glory in sub-3% rates. The 12 country average is 5.3%, almost 2 points above the US 3.6% rate.

https://www.economist.com/economic-and-financial-indicators/2022/07/28/economic-data-commodities-and-markets

US Inflation Rate is Above Average

The most recent 9.1% annualized US inflation rate is above the 7.7% average. Russia and Brazil are struggling with 10%+ inflation. Canada, Italy, India, UK and Germany face 6-7% inflation. France and South Korea encounter 5% inflation. Japan and China see just 2% inflation.

Combining the unemployment rate and inflation rates to create a “misery index”, the US scores 12.7%, just above the 12.2% average.

https://www.economist.com/economic-and-financial-indicators/2022/07/28/economic-data-commodities-and-markets

The US Remains the “Big Dog” in the Global Economy

At 24% of global GDP, it is first. China and Japan together add up to 24%. The remaining 9 large countries add up to just less than 24%. Being large provides the advantage of a larger domestic market that attracts investors, entrepreneurs, researchers, supplier, labor, traders, etc. On the other hand, continuing to grow in the same percentage terms through history or compared with smaller countries as the largest economy is a handicap. (This is a great graphic worth exploring for a few minutes)

US Leads in Per Capita Income by a Wide Margin

US reports $63,200 per year. Germany, Canada, UK, Japan and France range from $39K – $46K, roughly two-thirds of the US level. Italy and South Korea check-in at $32K, about one-half of the US level. China and Russia earn $10K annually, while Brazil ($7K) and India ($2K) lag further behind.

https://www.investopedia.com/insights/worlds-top-economies/

US Gross Domestic Product Increased 8% from 2019 to 2021

GDP figures are not widely available for the first half of 2022 for countries, so we can use the pre-pandemic 2019 compared with the late pandemic 2021 to gauge recent economic performance.

The US GDP in 2021 was 8% higher than in record breaking 2019. It increased by $1.63 trillion in 2 years. Global GDP in 2021 was $90T. US GDP grew from $21.37 to 23.0 trillion.

China (factory to the world), in a period when demand for durable goods increased by 20% and nondurable goods by more than 10%, grew even faster, from $14.3 to 17.7 trillion, an increase of $3.4 trillion. I believe this is overstated somehow, given other data that indicates 6-7% annual growth in China each year, but it’s first place two-year ranking is clear.

The other 10 major economies combined grew from $26.4 to $27.7 trillion, an increase of $1.3 trillion, totaling less than the US $1.6 trillion growth. Their 5% combined growth rate trails the US 8% growth rate.

In percentage terms, the UK, India and Canada grew by 10% or more. Germany, France and South Korea grew by 8-9%. Russia and Italy grew by 5%. Japan and Brazil endured economic declines.

https://data.worldbank.org/indicator/NY.GDP.MKTP.CD?locations=JP-DE-BR

US Leads Long-term Stock Market Gains

From the end of 2012 through July, 2022, almost 10 years, the US Standard & Poor’s stock index gained 175%. Fast growing India and previously undervalued Japan reported the same kind of amazing 10 year returns, compounding at more than 11% annually. Germany, France and Brazil grew by a decent 75%. Resource based Canadian and previously overvalued Chinese stocks gained a modest 50%. The UK, Italy and South Korea edged up by 25%, while Russia dropped by 25%.

Stock market returns reflect relative initial evaluations, changes in investor preferences, terms of trade and the underlying profitability/sustainability of each country’s economy. By this measure, the US has a very bright future.

US Leads Short-term Stock Market Returns

Comparing July, 2022 with a pre-pandemic base of December 31, 2019 shows a 25% gain for the US, Japan and India, even with the 20%ish stock market declines in the first half of 2022. Canada and South Korean markets are up a respectable 10%. China and France report a modest 5% gain. Germany and the UK show no gain. Italy, Russia and Brazil are in the 10% loss range. Even with strong gains from 2012 through 2019, the US stock market lead the world through the pandemic recovery period.

Summary: Very Solid US Economy

US inflation has returned to threatening levels and consumer confidence has fallen sharply while confidence in the incumbent president has continued to decline. The current “mood” is negative despite many positive economic factors such as the labor market and growth in GDP, housing and stock values. We are having journalistic, academic and partisan debates about hanging the “recession” label on the economy.

Big picture, the US economy is in great shape. It continues to grow, employ labor, increase wages, export, generate profits and build asset values. The economy worked through a “once in 100 years” global pandemic, with limited long-term economic damage.

There is a risk of a recession, even a moderately painful 3-5% downturn. There is a risk that inflation will remain elevated for more than 1 year, reducing the value of wages and assets. But these are normal business cycle issues, not the “end of the world”. The responses of consumers, investors, suppliers, businesses, bankers, central bankers, regulators and … politicians to the last two recessions were constructive and helpful. We have the ability to work through our current economic headwinds if we choose to do so.

US Recession? Probably Not Yet

https://www.un.org/en/coronavirus

I tried to find a “mainstream media” article that objectively and insightfully evaluates the state of the US economy as of the end of the second quarter without success. So, I’ll take a shot at it.

First, I want to highlight that “this time, it’s different”. The US and global economies are recovering from a global pandemic situation last seen more than 100 years ago. The global economy is more integrated than ever. Viruses spread faster than ever. Businesses and governments have more information and ability to change quickly than ever before. The economic contraction was sharp, far more severe than the Great Depression or the Great Recession. The health care experts were unable to immediately evaluate the threat or recommend public policies. Nonetheless, “they persisted” and the medical, travel and economic recovery was far quicker than ANYONE expected in March, 2020 or December, 2020 or September, 2021 or January, 2022.

Second, I apologize for the required details involved to evaluate the simple question, “are we in a recession?”. Unfortunately, there is some judgment involved, as we have to evaluate three factors. Is there a clear downturn versus the trend rate? Is the downturn of significant length? Is this a widespread downturn, effecting most sectors of the economy?

Einstein said “be simple, but not too simple”.

https://wiki.c2.com/?EinsteinPrinciple

Sir Walter Scott noted the “tangled web we weave”.

https://nosweatshakespeare.com/quotes/famous/oh-what-a-tangled-web-we-weave/

The Ancient Greeks noted “many a slip twixt cup and lip”.

https://en.wikipedia.org/wiki/There%27s_many_a_slip_%27twixt_the_cup_and_the_lip#:~:text=There%27s%20many%20a%20slip%20%27twixt%20the%20cup%20and%20the%20lips,your%20chickens%20before%20they%20hatch%22.

Cheech and Chong rambled on with ” recession, repression …”

https://www.lyricsfreak.com/c/cheech+chong/santa+clause+and+his+old+lady_20745568.html

Total Economy Level

https://fred.stlouisfed.org/series/GDPC1

At the aggregate level, we clearly have a peak. Do we have an extended downturn? Not yet, based on the total. The rapid recovery from the second quarter 2020 bottom could not be sustained. A significant slow-down in the growth rate was expected. Typical annual real GDP growth in recent years has been only 2%, so the difference between “extended expansion” and “recession” is thin.

Components

Macroeconomic theory focuses on aggregate demand and aggregate supply. Real, inflation adjusted, gross domestic product (GDP) is a measure of the productive output of a nation. The demand side is split into consumption, investment, government and net exports. I’ll go one level deeper, reviewing 9 components of GDP.

The business cycle is influenced by the relative sizes of the components of GDP and their relative variability from quarter to quarter and typical changes as the business cycle moves from expansion to decline to recovery.

From most to least correlated with the business cycle, with their current percentage share of GDP (sums to more than 100 because imports are a negative factor and changes in private investment can be negative), the 9 components are: Change in private inventories (1%), Residential Investment/Housing (5%), Business Investment (14%), Durable Goods Consumption (9%), Imports (16%), Non-durable Goods (food, energy) (15%), Services (45%) !!!!, Exports (8%) and Government (17%).

Overall, I see 4 sectors as “maybe” trending to a recession and 5 sectors currently at “no”. Unfortunately, the two most sensitive, Housing and Business Inventories, are in the “maybe” category, along with non-durable goods consumption and government consumption.

It is critical to look at the longer-term trends and context to evaluate short-term changes. There is significant month-to-month and quarter-to-quarter variability in the final numbers for GDP and especially for the initial estimates, like those we just saw for the second quarter of 2022. Significant revisions are made for 6 months, which is why the NBER committee which officially declares recessions is typically waiting longer to make a final call than everyone desires. Hence, I won’t usually share a long-term graph, a short-term graph, annual percentage changes and quarterly percentage changes annualized for each component. The media tends to focus on the preliminary quarterly percentage change annualized as the “gospel”. This is unwise. Let us begin to review the 9 main components.

Durable Goods (9% of GDP, 4/9 Volatile)

https://fred.stlouisfed.org/series/PCEDGC96#0

Durable goods demand spiked by an incredible 20-30% during the pandemic, fueled by government transfers and fewer opportunities to consume services. Demand for durable goods has flattened at this 20% higher level, it has not declined. In my view, this sector is not signaling recession.

Non-durable Goods (15%, 6/9 Volatile)

https://fred.stlouisfed.org/series/PCENDC96

Non-durable goods consumption jumped by a real 12% during the pandemic and has essentially remained at this elevated level. We have two quarters at slightly lower consumption levels, so I rate this as “maybe” moving to a recession. Focus on the “big picture”. Both durable and non-durable goods consumption increased by historic percentages during the pandemic period and have remained at that elevated level 2 years later. It is not surprising that this demand has flattened or fallen off a bit. The surprising feature is the willingness of the American consumer to voluntarily spend much more money on “things” during the pandemic and maintain that level of spending as service opportunities returned, government transfers ended, and savings were drawn down.

Services (45%, 7/9 Volatile)

https://fred.stlouisfed.org/series/PCESC96

The very large (44% of GDP) services sector was slower to recover from the pandemic, but demand for services remains quite strong, even though the percentage growth rate is lower than during the initial recovery period.

Business Investment (14%, 3/9 Volatile)

https://fred.stlouisfed.org/series/PNFIC1

Business investment was above trend in the two years before the pandemic and has resumed its solid level. No recession indicator here.

Housing (5%, 2/9 Volatile)

https://fred.stlouisfed.org/series/PRFIC1

New housing investment grew by 50% between 2012 and 2016 and then remained at that level for the next 4 years before the pandemic. Long-run supply and demand factors indicate a “need” for more housing construction in the US to make up for the “missing” construction from 2008-2016. New housing construction did not decline with the pandemic, it increased by 15% in real terms! As with durable and nondurable goods consumption/production, this would not have been predicted in March, 2020 by anyone. Residential construction has levelled off 15% above 2019, equal to 2007 before the Great Recession. The increased mortgage interest rates indicate that demand will soften and this sector will decline somewhat in the second half of 2022, so this is a “maybe”. The long-term shortage of housing supply provides a floor for this sector.

Business Inventories (1%, 1/9 Volatility)

https://fred.stlouisfed.org/series/CBIC1
https://fred.stlouisfed.org/series/A371RX1Q020SBEA

“Supply chain issues” have restricted the accumulation of business inventories since the pandemic began. The unexpected spike in demand for durable and nondurable goods and residential construction lead to shortages. Worries about supply chain resiliency have led to higher targeted business inventory levels. Retailers have overstocked some product categories as the recovery has slowed and are being forced to discount prices to move these goods. Overall, this is a slight “maybe” recession indicator. I think that businesses would like to have 20% higher inventories overall.

https://fred.stlouisfed.org/series/ISRATIO

Exports (12%, 8/9 Volatility)

https://fred.stlouisfed.org/series/EXPGSC1

US exports continue to solidly recover from the pandemic.

Imports (16%, 5/9 Volatile)

https://fred.stlouisfed.org/series/IMPGSC1\

Although imports act as a reduction in the calculation of GDP, they tend to decline when the US economy declines. Import demand remains high, not indicating a recession.

Government (17%, 9/9 Volatile)

A majority of government spending is accounted for as a simple transfer, not part of the annual production of goods and services.

https://fred.stlouisfed.org/series/GCEC1

Government production activity grew quite significantly from 2014 to 2020. It has since declined by less than 1%. I rate this as a “maybe” indicator of recession, even though government activity is typically a countercyclical indicator, rising when recession arrives.

Summary

Services (45%), Business Investment (14%), Exports (12%), Imports (16%) and Durable Goods (9%) are NOT in recession. Housing (5%) and Non-durable Goods (15%) point towards recession, while Government (17%) and Business Inventories (1%) show warning signs. If I were a member of the NBER board, I would not designate a recession in the first half of 2022 as of today.

For the second half of 2022, a recession is possible. The Fed raising interest rates is already affecting the housing industry. But businesses continue to report solid to record profits. The stock market has declined by a bear market 20% but may or may not have found a bottom. The global risks from Russia’s attacks on Ukraine and China’s Covid lockdown strategy remain. Consumer confidence is weak, especially in a partisan world. Business confidence is weaker than in recent months, but most measures remain marginally positive. The labor market is at its strongest position in 50 years, supporting consumer demand. Higher than expected inflation has slowed consumer spending, but not to recession levels. Consumer savings and debt levels remain positive. Business debt levels have increased, but most businesses locked in low debt interest rates during 2020-22.

Why So Positive?

  1. Governments operate with expansionary fiscal policy, ensuring that aggregate demand is adequate. There is a risk of too much stimulus and “modern monetary theory” excesses, but so far this is not a risk in the major economies.
  2. Central banks are more effective. They provide credit in downturns, increase interest rates when required, coordinate with each other and pressure banks to hold adequate capital.
  3. Governments and central banks take proactive steps to avoid currency crises,
  4. After the Great Recession, lending in the US housing market is more reasonable.
  5. Businesses have worked through many challenges in the last 15 years and are well positioned to prosper.
  6. The overall economy is increasingly based on services more than manufacturing, mining and agriculture. The operations leverage of manufacturing facilities is a smaller factor in the world economy.
  7. Labor power is lower. Cooperation with management is stronger.
  8. Demand for labor is high. US has record open jobs and voluntary quits. The effective minimum wage has increased from $8-10 per hour to $12-15 per hour without major business disruptions.
  9. Trade is lightly restricted.
  10. Global economy is multipolar, relying on US, EU, Japan, China, India, Middle East, etc.
  11. Technological progress continues. Better goods and services. Better processes, trade, transportation, markets, communication and insights.

Good News: Vehicle Dependability Continues to Improve

https://www.vwvortex.com/threads/jd-power-dependability-2001-vs-2011.5350295/
https://www.jdpower.com/business/press-releases/2021-us-vehicle-dependability-study-vds

Ongoing defects dropped by 60% from 2001 to 2011 and then dropped by another 20% from 2011 to 2021. The compounded reduction is 68%, a little more than two-thirds of the defects disappearing in 20 years.

JD Powers started its initial quality surveys in 1987 and its Vehicle Dependability surveys in 1990. The summary results are not easily found on the internet. The Consumer Reports defect rates are similarly restricted to paying customers.

https://www.yahoo.com/news/30-years-iqs-perspectives-history-222747086.html

In the 1980’s, Toyota and Honda offered significantly higher vehicle quality. Other manufacturers essentially “caught up” in the next 20 years. A snapshot from 1985 illustrates the gap that was closed by 2000-5, before the Vehicle Dependability improvements shown above.

https://www.carqualityinfo.net/reliability-durability-gpas/car-brands—7-best-brands-of-my-1985/
https://www.jdpower.com/business/press-releases/2022-us-vehicle-dependability-study

The very disappointing 2022 results are inconsistent with the downward defect trend of the last 20 years, reflecting the pandemic production, supply chain sourcing and vehicle prep problems of the last 2 years.

Lake County, Ohio: A Swing County for Presidential Elections (1952-2008)

https://en.wikipedia.org/wiki/My_Little_Town

Historically, Ohio was a critical “swing state” in presidential elections.

https://en.wikipedia.org/wiki/United_States_presidential_elections_in_Ohio#:~:text=Ohio%20is%20considered%20a%20swing,regular%20swing%20state%20since%201980.

My “little” hometown of Fairport Harbor is part of Lake County, Ohio which once was the most sensitive county to changing presidential voting patterns after 1952. Lake County is a suburban or exurban county in the Greater Cleveland area. The population doubled from 29K to 60K between 1920 and 1944 while it retained a mixture of agricultural and manufacturing employment. The county grew very rapidly on its western side as Cleveland residents moved away from the city, reaching 149K by 1960. Another 50,000 new residents arrived by 1972, pushing the total above 200K. Growth slowed with the decline of the Cleveland metro area, but the population reached 228K by 2000. The population has been relatively fixed for the last 20 years.

https://wikiless.org/wiki/Lake_County,_Ohio?lang=en

From 1952 through 2008, Lake County voted with the national presidential election winner in all but one of the 15 elections. In 1992, Lake County provided George Bush, Sr with 38% of the vote, the same as he won nationally, but only provided Bill Clinton with 36% of the vote, offering a very high 26% of the vote to “protest candidate” Ross Perot, far above his national 19% share.

https://wikiless.org/wiki/Lake_County,_Ohio?lang=en

https://en.wikipedia.org/wiki/2020_United_States_presidential_election

From 1920 to 1932, Lake County voted 70% Republican, a solid 16% above the national average. Lake County took pride in its role as part of the Connecticut “New Western Reserve” and its road, rail and ship based east to west transportation role at this time. The county was also the proud home of Republican President Garfield.

https://www.whitehouse.gov/about-the-white-house/presidents/james-garfield/

While the country gave FDR 57% of the vote in 1932, Lake County offered just 35%, preferring to re-elect President Hoover.

From 1936 to 1956, the county continued to lean Republican, offering an average of 6% more votes to the Republican head of the ticket than the average state. The county supported FDR in 1936 but opposed him in 1940 and 1944 and opposed Truman in 1948.

The county started its remarkable 14/15 presidential winners string in 1952, supporting Eisenhower by 5 points more than the country at large and repeating this support in 1956.

The county surprisingly supported Kennedy over Nixon 51/49 in 1960, dropping those 5 extra points of Republican support. Kennedy visited the small county during the election. This may have helped shift enough marginal voters.

https://www.jfklibrary.org/asset-viewer/archives/JFKSEN/0912/JFKSEN-0912-002

This was a time of change, with future 20-year congressman Frank Stanton serving as a county commissioner.

https://www.latimes.com/archives/la-xpm-2002-apr-13-me-stanton13-story.html

From 1960 to 2004, the county’s Republican vote percentage matched the national average.

Democrats earned a record high 62% vote share for LBJ in 1964, with Goldwater falling to a stunning 38% Republican low. Lake County “faced east”, looking to the New England/New York and Midwest Republicans (Taft) for inspiration. Goldwater’s Texas, Arizona, California “western” message gained little local traction.

The 1968 election was completely different. Nixon edged Humphrey by 0.8%, with Wallace receiving 14%, as he did nationally. I was just 12 years old, but as a newspaper carrier for 3 years, I had read many editorials from the Cleveland Press, Cleveland Plain Dealer, Lake County News-Herald and Painesville Telegraph. The race riots of 1966-67, Vietnam protests and counterculture demonstrations and activities were beyond the lived experience of my neighbors. Nixon and Agnew leveraged a “patriotic” message to win voters in “my little town”. George Wallace earned a remarkable 14% as a modern populist, promising simple solutions to all of the nation’s problems. I don’t believe that Wallace’s “racist” message was a significant part of his appeal in this heartland. He was an early version of the right-side “anti-establishment” candidate.

In 1972, Nixon cruised to victory by 61/38 against a weak McGovern candidacy. Lake County agreed: 59/38. The “Kent State Riots” were part of this vote. Governor Rhodes was very popular in Ohio, winning 3 terms.

https://en.wikipedia.org/wiki/Jim_Rhodes

https://en.wikipedia.org/wiki/Kent_State_shootings

In 1976, Jimmy Carter sold Lake County on a moderate Democratic platform and his promise to “never lie”, winning 51/46, about the same as the national 50/48.

In the same year, the county’s largest employer, Diamond Shamrock, announced that it was permanently closing its chemical plant that had employed as many as 5,000 workers historically.

https://www.rsworld.com/snix66/diamond.html

Reagan solidly won Lake County and the country by 50/41 and 59/41 in 1980 and 1984. His positive, traditional, patriotic, common-sense, reassuring message was well-received in a county and metropolitan region that was very hard hit by the start of a long-term downturn in manufacturing employment and regional population and economic growth.

George W. Bush was a little more popular in Lake County than the country as a whole, earning a 57/42 win, better than the national 53/46. Bush, Sr.’s WWII pedigree, executive experience and countenance played well in Lake County.

The 1992 election, pitting Bush, Sr.’s continuity, generation, broken tax promise, moderate social and economic views against Clinton’s contrasting policies was a divisive election, the true beginning of our polarized red versus blue state situation today.

In 1996, Bush’s support dropped from 57% to just 38%, while the national vote fell from 53% to 38%. Bush beat Clinton in Lake County 38% to 36%, the one non-match in the 15 elections.

Lake County was enamored with Ross Perot, offering him 26% of the vote in 1992 versus his 19-point national haul.

I worked for Ross Perot’s EDS in the 1980’s, as a headquarters financial analyst and project manager, producing the kinds of “charts and graphs” he loved to use in debates and press conferences. Ross was the most “what you see is what you get politician” I have ever seen. He believed that there are pragmatic, straightforward answers to any problem, and had lived a life demonstrating that this was true in the IT business, inventing the outsourced IT model and selling it to government agencies and corporations, just as he had sold mainframe computers in record volumes for IBM.

Ross was an anti-politician, a nationalist, a leader, a persuader, a man of integrity, a team player, a Texan, an outsider and very customer focused. Even with his significant campaign flaws, he was able to many attract voters who wanted to vote “none of the above”. I don’t believe his appeal was one of subtle racism, anti-immigration or historical pandering to a simpler, more culturally conservative time. Ross believed in progress, science and business.

Perot attracted 14% of Lake County voters in the next election, almost double the 8% national tally.

Clinton edged Dole 44/42 in Lake County in 1996, significantly behind his 49/41 national victory. In essence, this was a “none of the above” election for many in Lake County.

Lake County was an optimistic, fast-growing growing county for many years, tripling its population from 50,000 in 1940 to 149,000 in 1960 as Cuyahoga County grew, freeways opened, and people moved further from the central city. The county added another 50,000 people by 1972 as regional shopping malls such as the Great Lakes Mall opened by the Youngstown DeBartolo’s provided new attractions at the edge of the metro area. Growth slowed significantly after that, with the county adding just 20,000 people in the next 20 years through 1992 and another 14,000 people in the next 20 years. This change in the local environment from boom town to slow growth aggravated concerns about the country’s direction.

In 2000, George HW Bush, Jr. was able to capitalize on his message of “compassionate conservatism”, winning Lake County by 50/45, better than his narrow 48/49 popular vote loss. Even with the 9/11 patriotism bump, Lake County and the nation only narrowly re-elected Bush, Jr. by 51/48.

Obama’s centrist “hope and change” message attracted a few more Lake Countian’s to the Democratic ticket in 2004, earning a narrow 49.5% to 48.6% win, much tighter than the national 53/46 win.

The tables were turned in 2012, with Romney beating Obama by the same 49.5% to 48.6% result, in contrast with Obama’s 51/47-point victory. The 14/15 election match was broken. Lake County’s Republican share was 3 points higher than the nation this year, but its average Republican tilt for the last 16 elections was less than 1%.

Trump’s 2016 nationalist, populist, anti-immigrant, anti-globalization message played well in Lake County. He earned 5 points more than Romney, earning a solid 55/40 win, far ahead of his 46/48-point popular vote loss to Hillary Clinton. As with other blue collar, middle class, rust belt, Midwest states that had historically supported the Democrats, Lake County voted “no”, offering just 40% to Clinton.

2020 was very similar to 2016 in Lake County. Trump beat Biden 56/43 in Lake County, discounting Biden’s small-town Pennsylvania roots claims and centrist messages. Biden increased the Democrats’ national popular vote margin to 51/47.

It’s difficult to reconcile the 20-point swing from LBJ’s 1964 62/38 victory with Trump’s 56/43 advantage in 2020. Goldwater was a weak Republican candidate, promoting a conservative “philosophy” and radical “for the time” policies. Biden is a lifetime Washington politician, subject to obvious criticisms.

From Wallace to Anderson to Perot to Trump, a significant share of independent Lake County voters has been attracted to “outsider” national political candidates. The shared national experience of the Depression and WWII and bipartisan support for national leaders like FDR, Eisenhower, Kennedy and Reagan is nearly gone.

Since Reagan’s 1980 50/41 victory, Lake County has averaged a 51/43 Republican advantage. Based on Trump’s recent higher results (55-56%), Lake County looks to be a solid Red county today, leaving behind it’s Purple history.