Years of Missing Housing

The Housing Market is Tighter than Ever

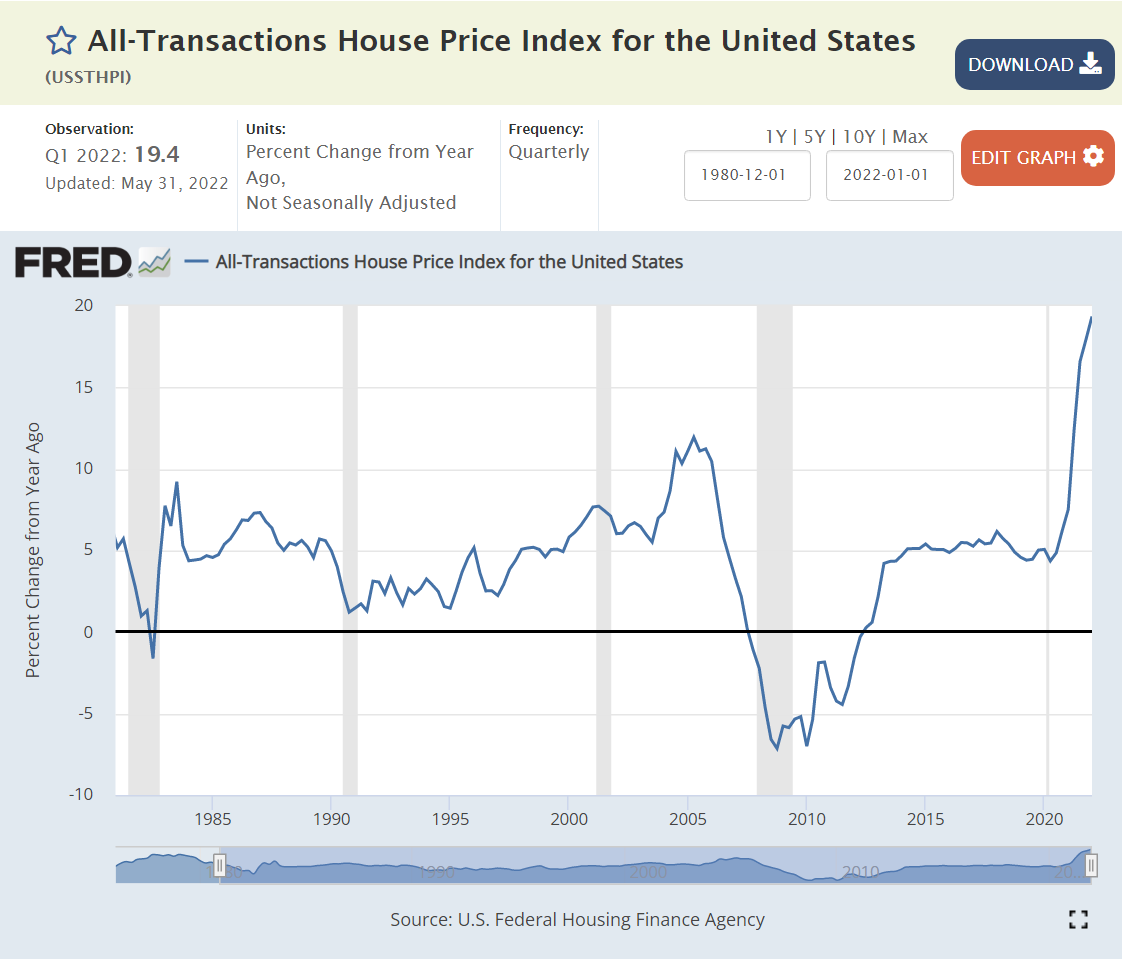
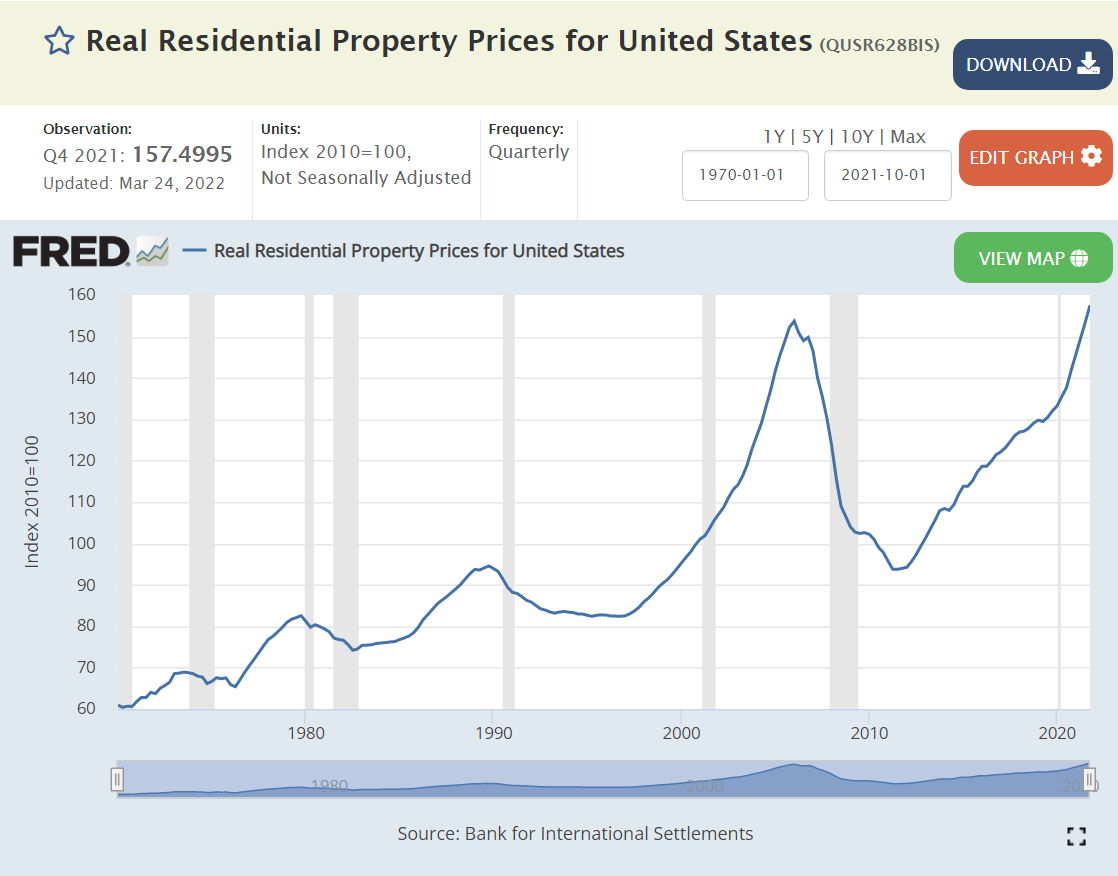
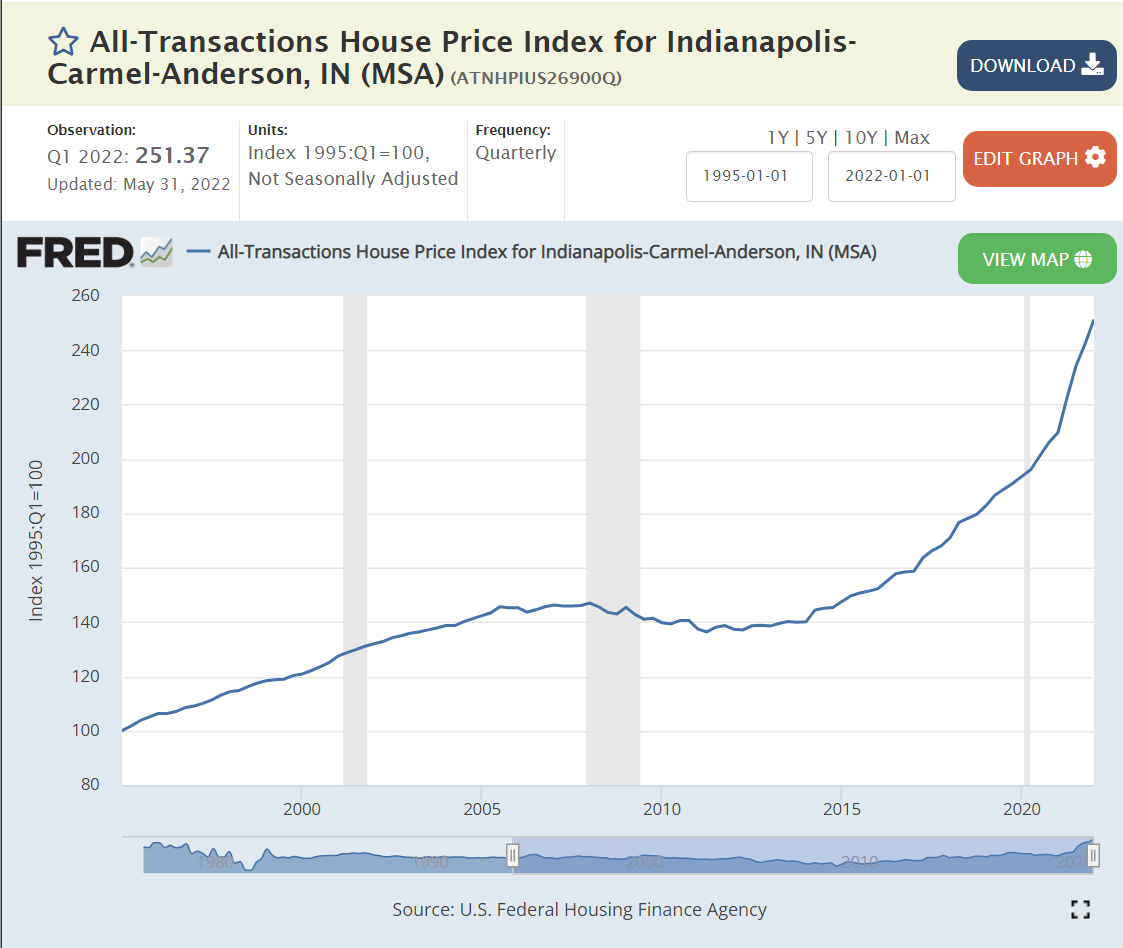
20% housing price inflation.

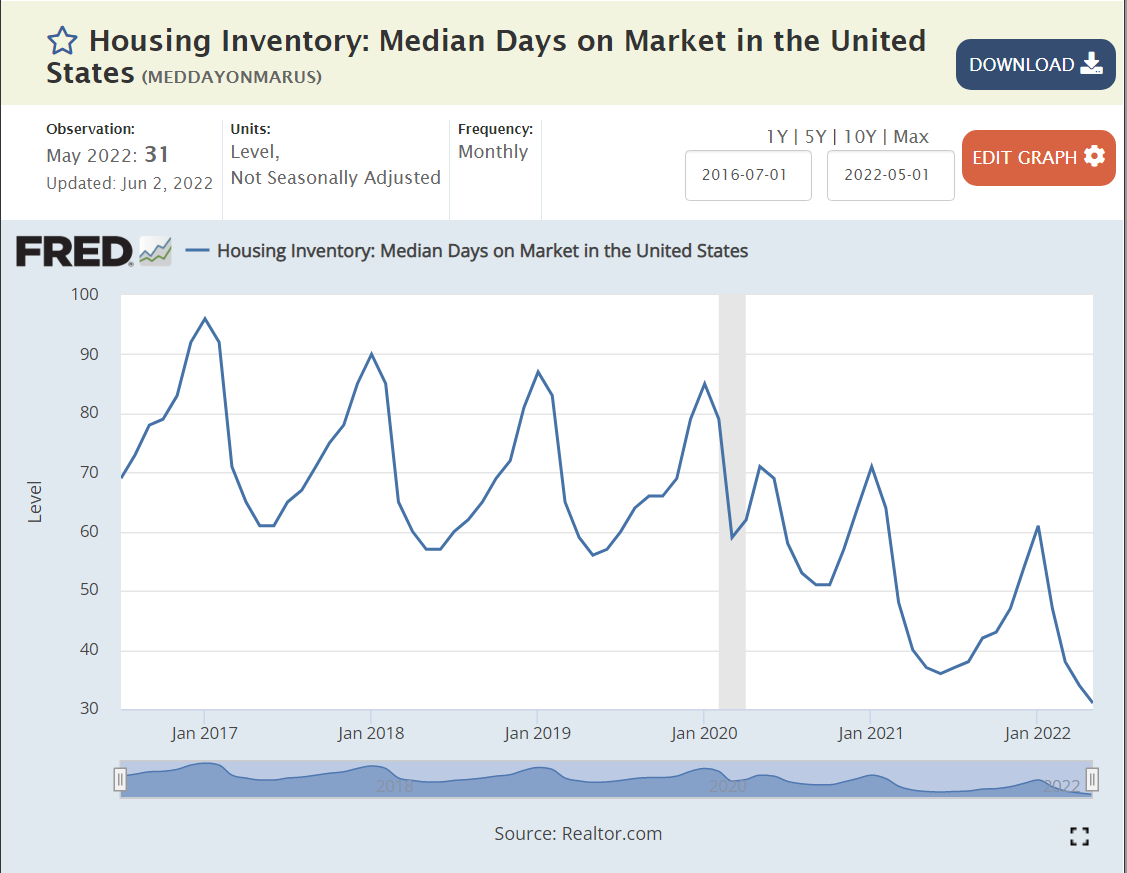
Typical house sells in one month.

Listings down by 70%.

https://eyeonhousing.org/2020/01/a-decade-of-home-building-the-long-recovery-of-the-2010s/
https://www.whitehouse.gov/cea/written-materials/2021/09/01/alleviating-supply-constraints-in-the-housing-market/

Existing homes available for sale cut in half, even before the recent decline.

https://www.realtor.com/research/topics/housing-supply/

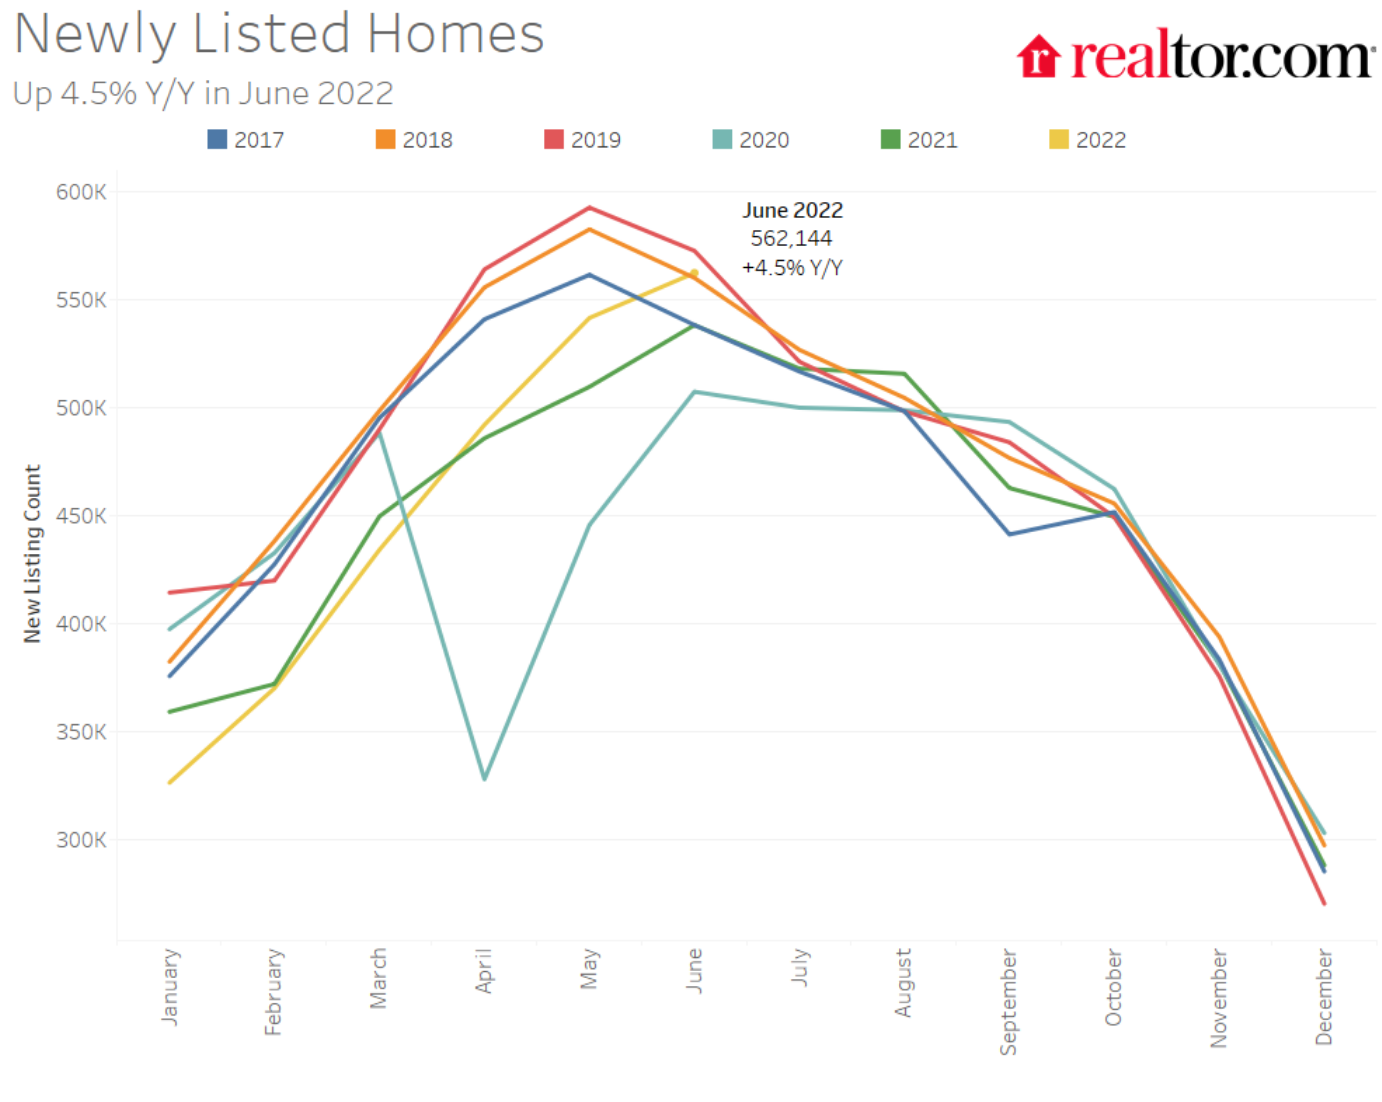
Even with record prices, new listings lagged during 2020-22.

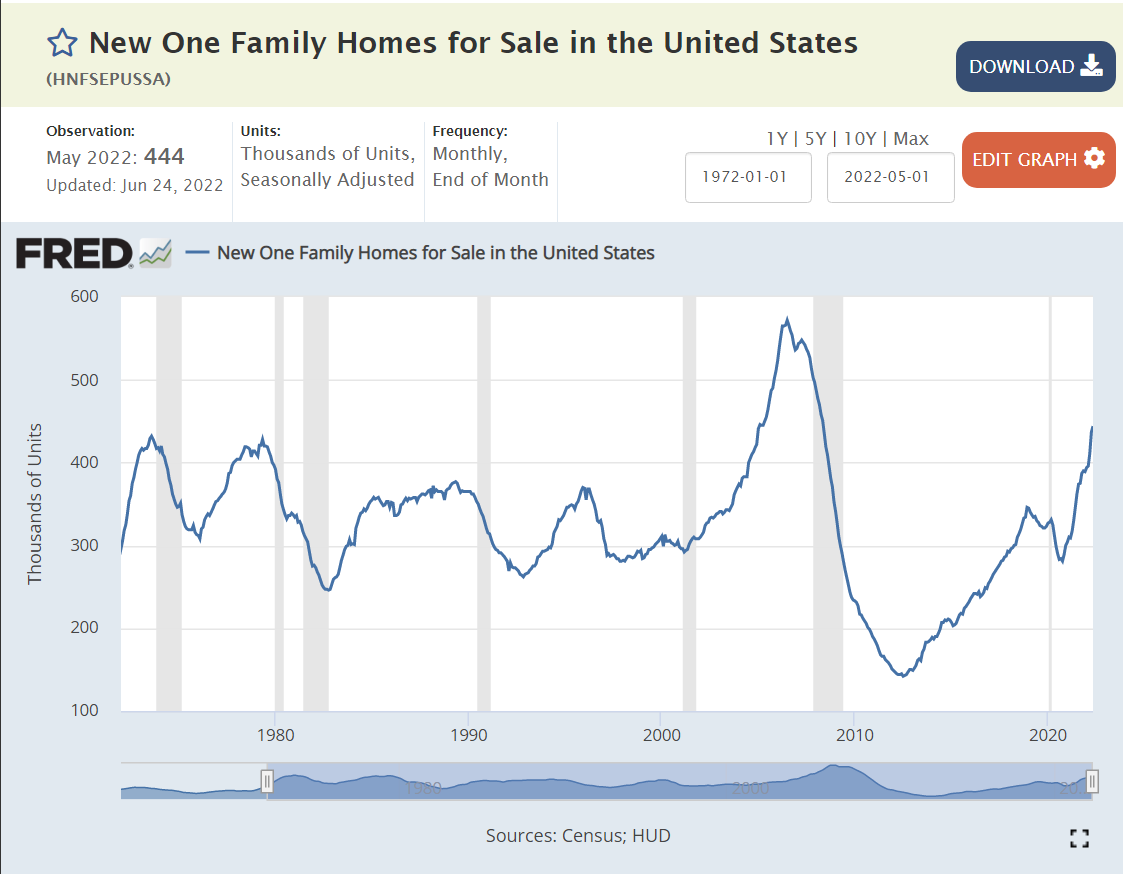
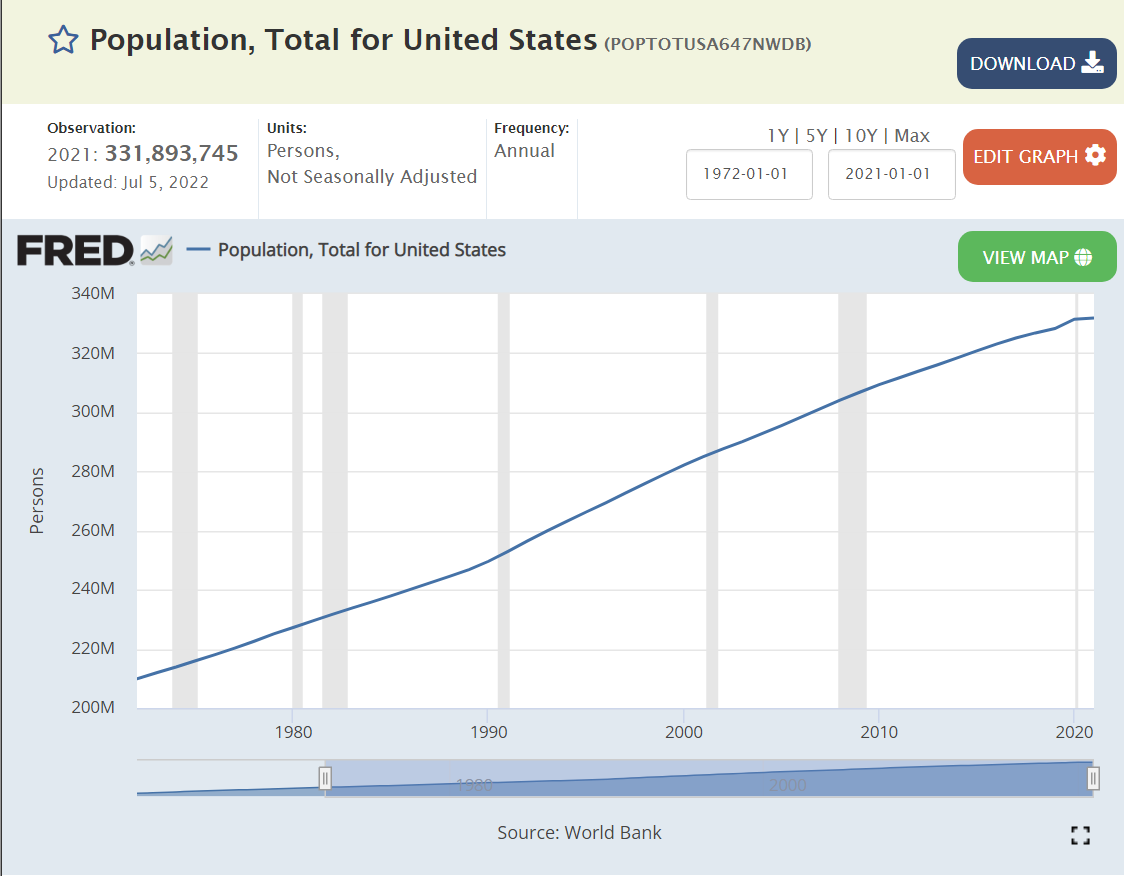
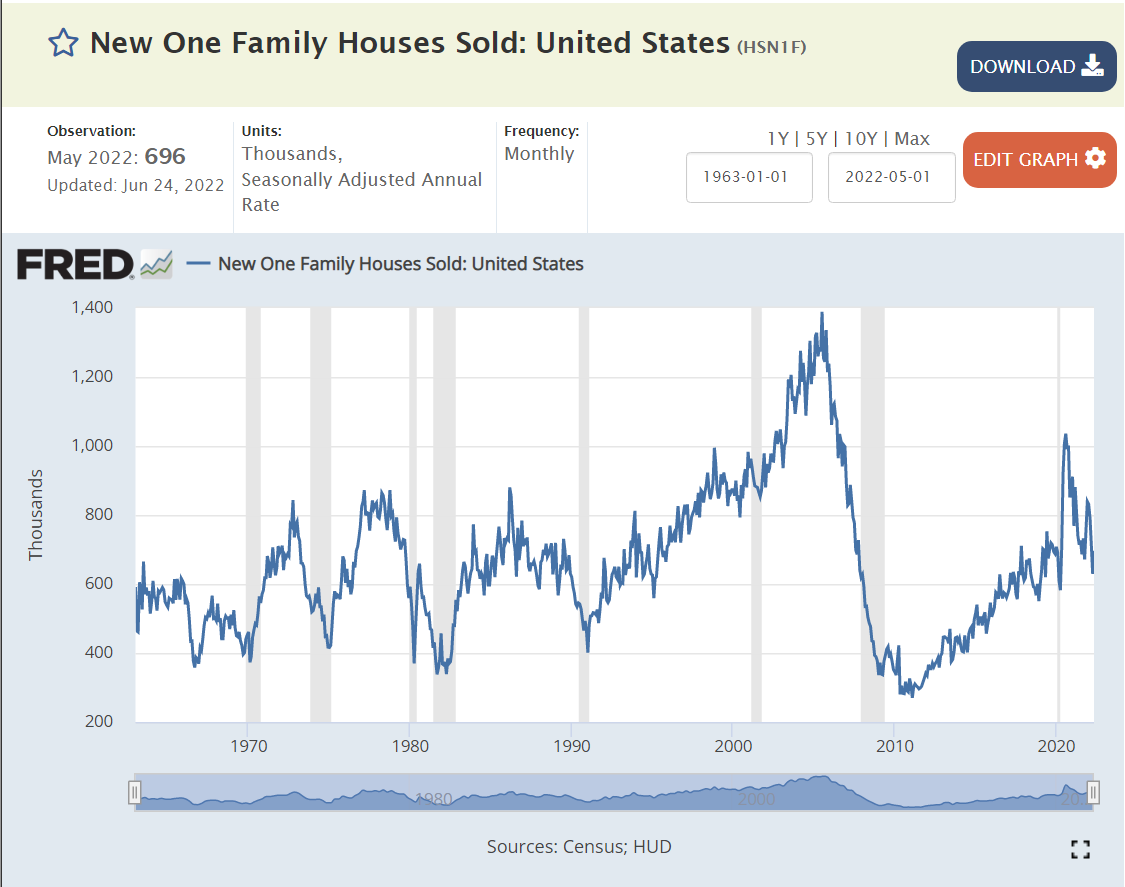
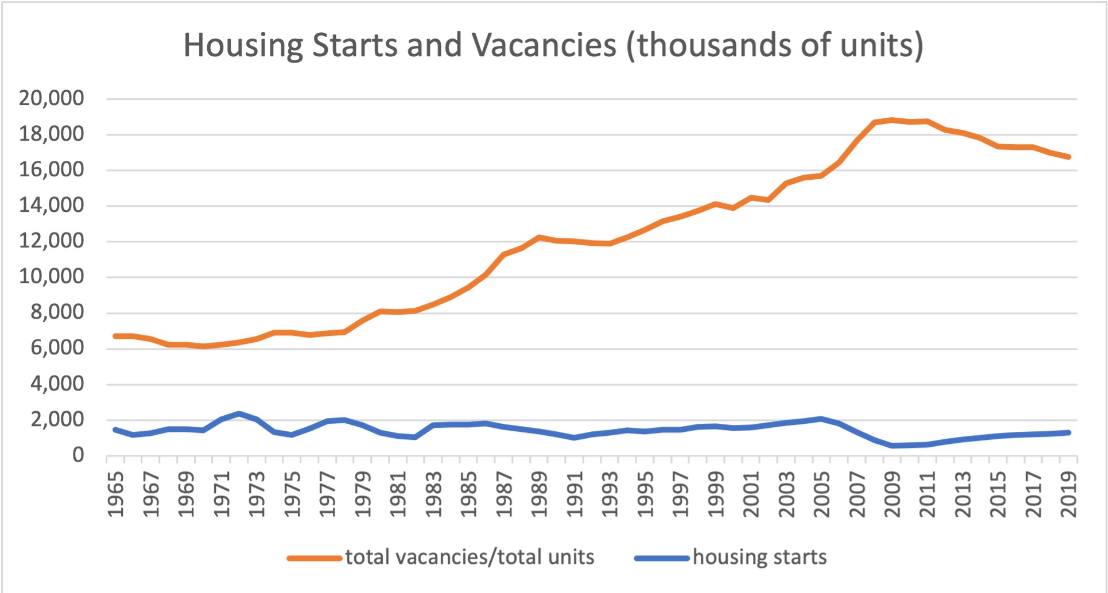
The supply of new homes available for sale, has remained flat at 300,000 for the last 50 years, while the population has grown by 50%.

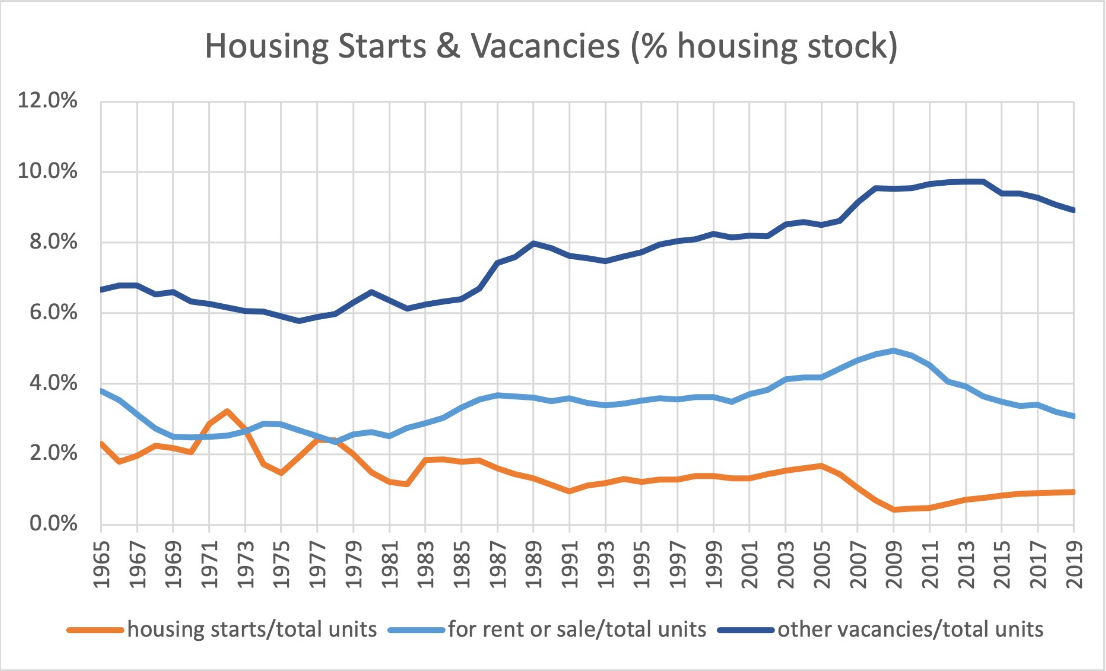
The home vacancy rate is at one-half of its historic level.

Housing Units

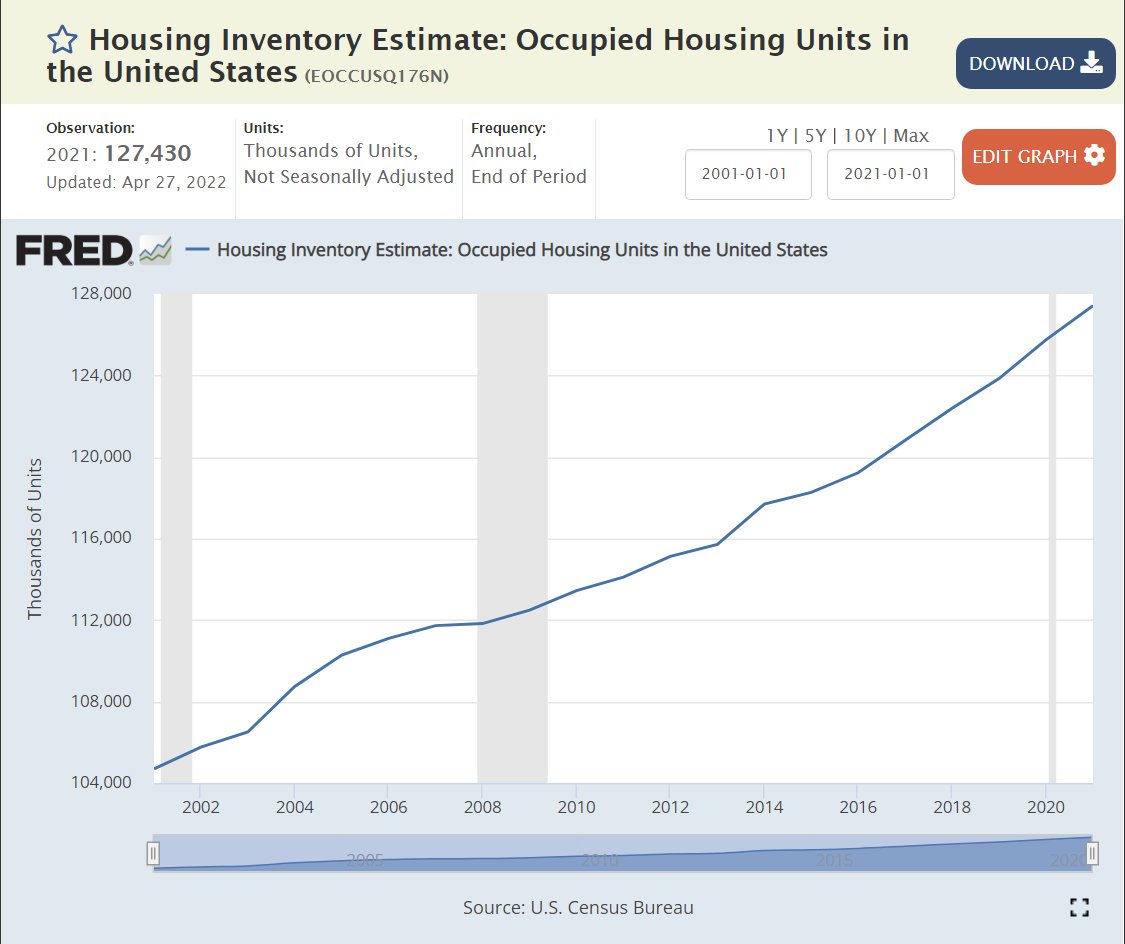
The ratio of housing units to population in 2021 is 0.38, a little higher than the 0.37 in 2001.

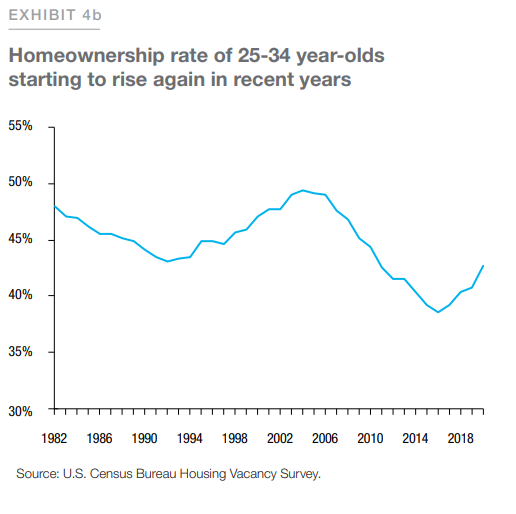
The “American dream” of single family home-ownership remains. Buyers continue to try to recover from the decline from 69% in 2006 to less that 64% in 2015.

The number of owner-occupied (single-family) homes reached a peak of 76 million in 2006 and then flat-lined for eleven (11) years through 2017. An estimated 8 million homes have been added in the last 5 years, about 1.8M per year after zero per year for 11 years.

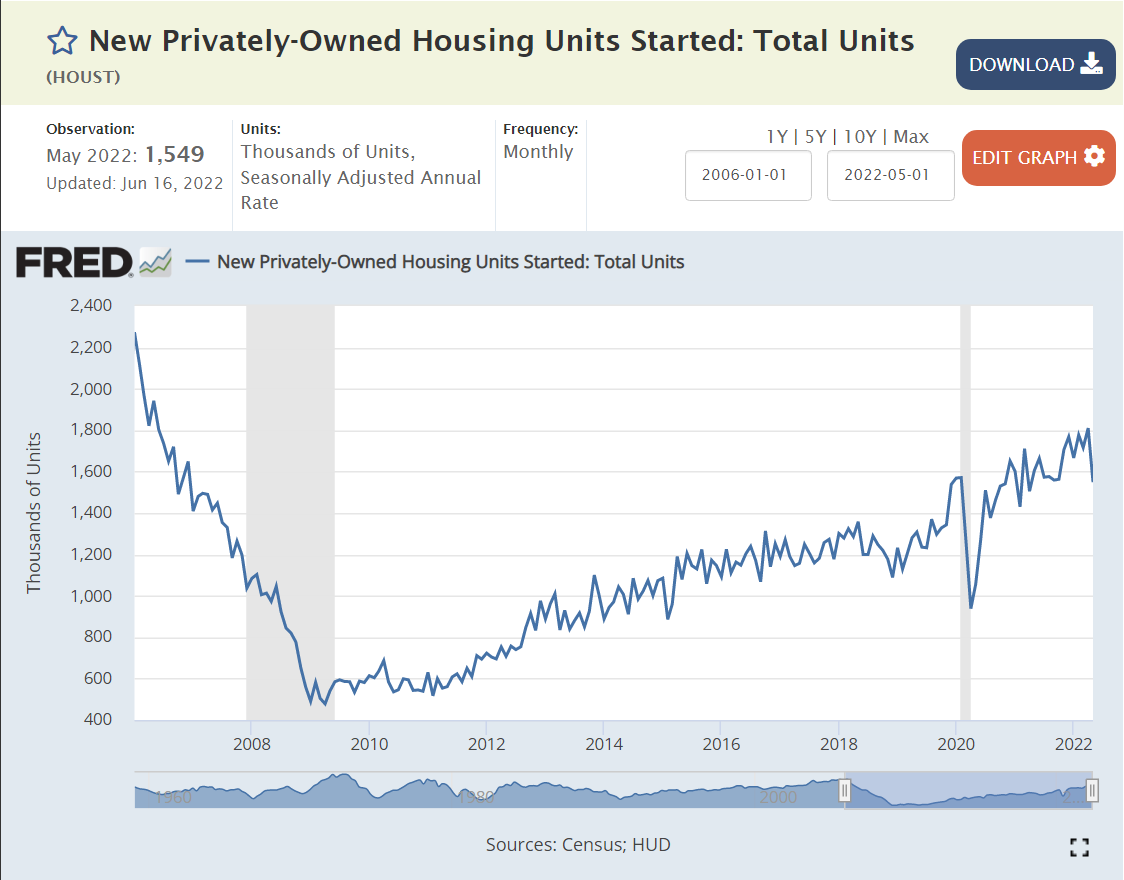
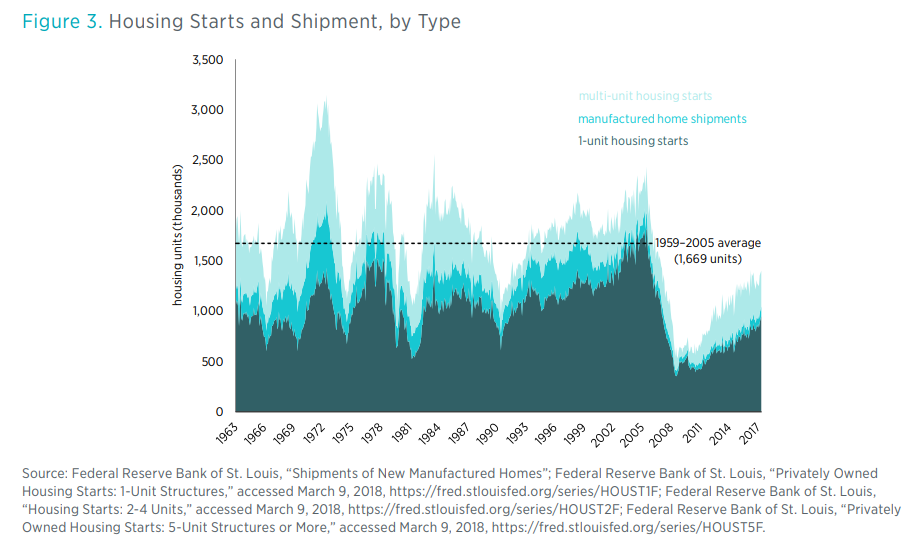
Supply Has Not Recovered from the Great Recession

https://www.freddiemac.com/research/insight/20181205-major-challenge-to-u.s.-housing-supply

A thorough analysis of supply and demand would include dozens of factors and 100 metro housing markets. However, at the simple trend-based macro level, we see 1.5-1.6 million units per year added from 1960-2010. We see a trough from 2007-2020 with a deficit of more than 5 million missing housing starts.

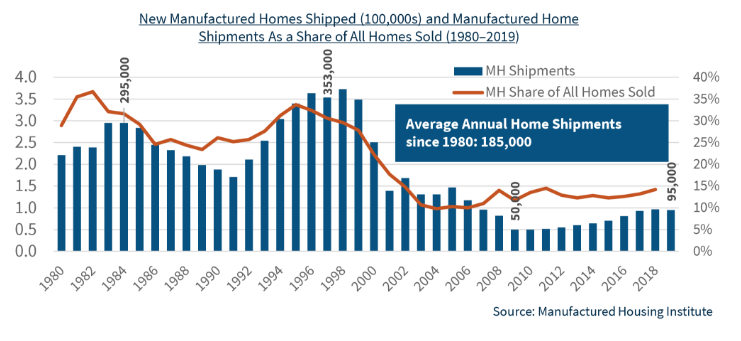
Even Worse, Starter Homes and Manufactured Housing Have Almost Disappeared, Driving an Affordability “Crisis”.

https://www.freddiemac.com/research/insight/20210507-housing-supply

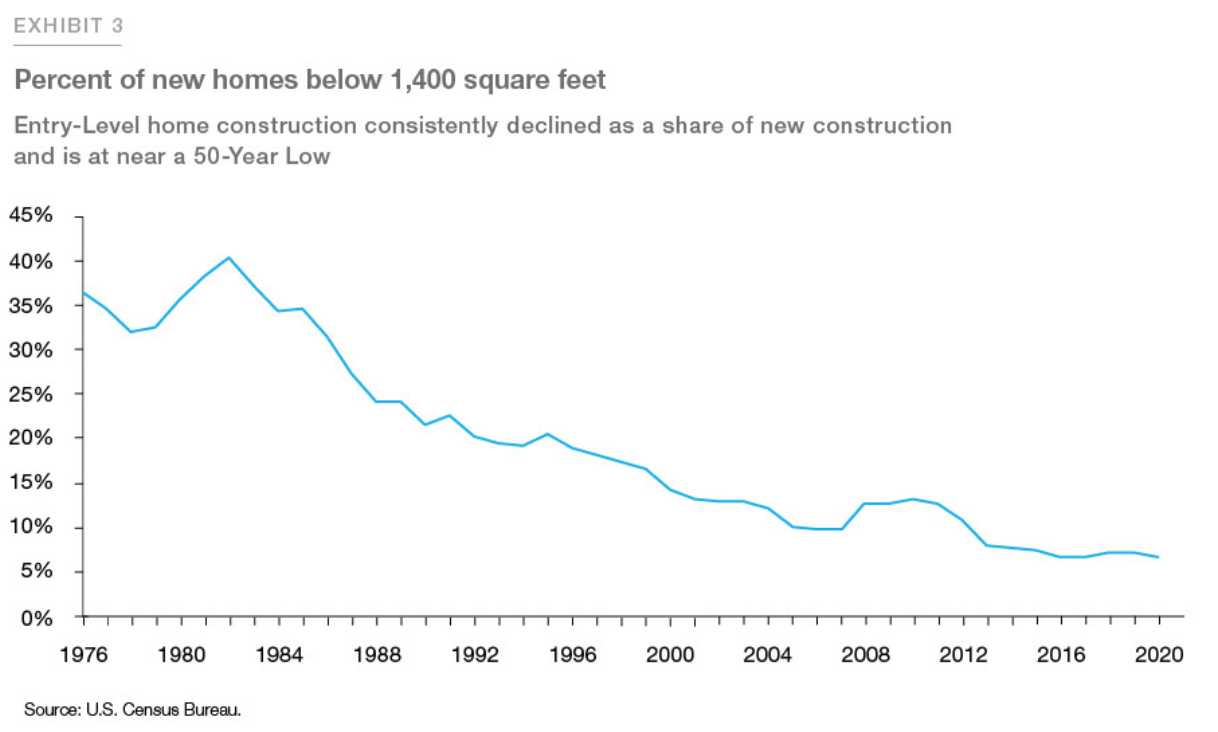
https://myhome.freddiemac.com/blog/research-and-analysis/20211013-starter-homes

https://www.mercatus.org/system/files/erdmann_-mophousing_was_undersupplied_during_the_great_housing_bubble-_v1.pdf
https://multifamily.fanniemae.com/news-insights/multifamily-market-commentary/manufactured-housing-landscape-2020

Aging of the Housing Stock: The 2010-19 Decade Was a Huge Outlier

https://www.huduser.gov/datasets/ahs/ahs_taskc.pdf

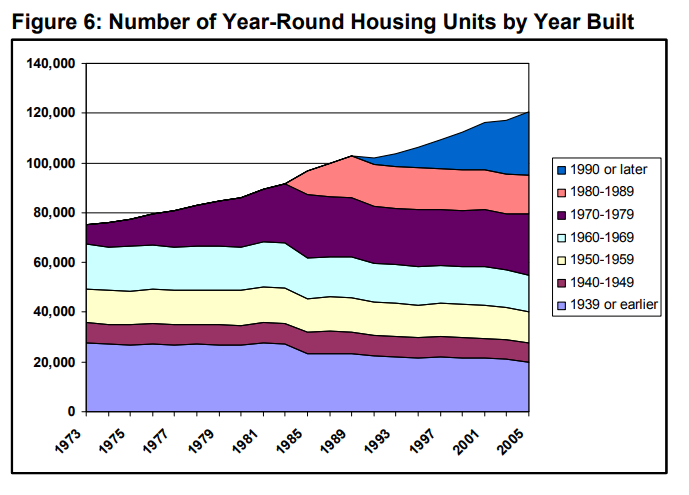
During every decade, except WW II, the US added 10 million+ housing units. They have an expected life of nearly 100 years.

https://eyeonhousing.org/2020/01/a-decade-of-home-building-the-long-recovery-of-the-2010s/
https://eyeonhousing.org/2022/06/the-aging-housing-stock-5/

The US added less than one-half of the usual amount in the teens, driving the median housing stock (owner-occupied) age up from 33 to 39 years. So, it’s even more than the 5 million housing units that weren’t built. The whole stock is older. More units require maintenance. More people are waiting to have the new or “newer” home ownership experience.

Many Ratios Echo the Simple “Missing” Housing Stock Claim

https://www.mercatus.org/system/files/erdmann_-mophousing_was_undersupplied_during_the_great_housing_bubble-_v1.pdf

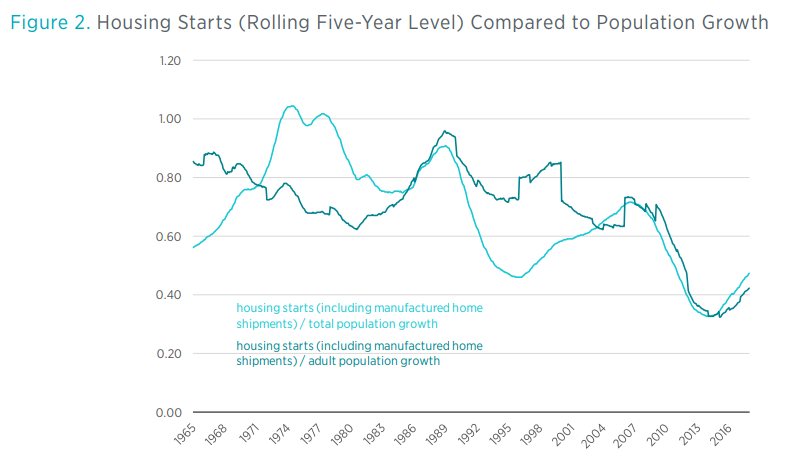
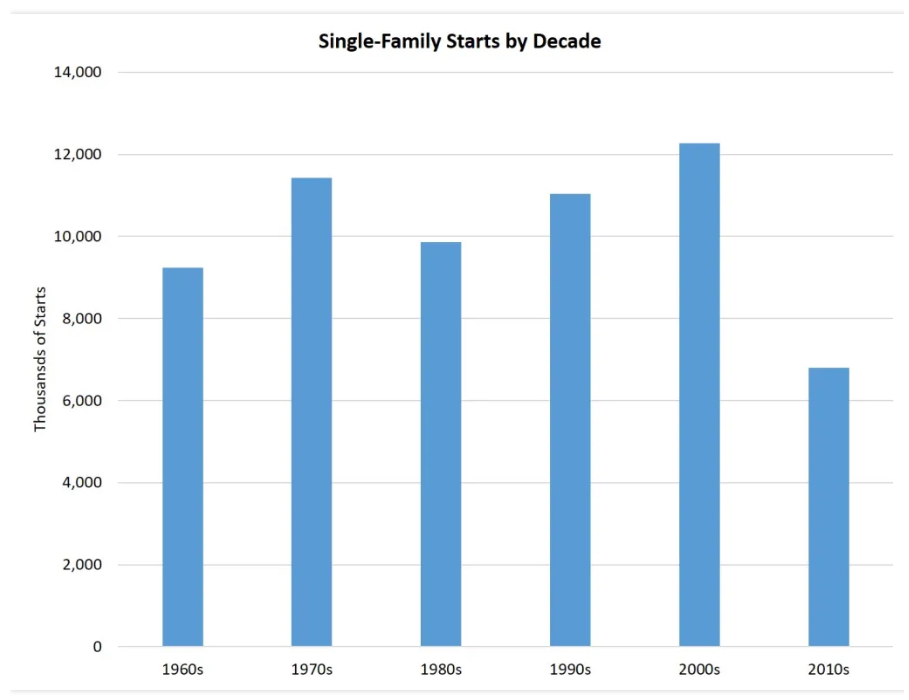
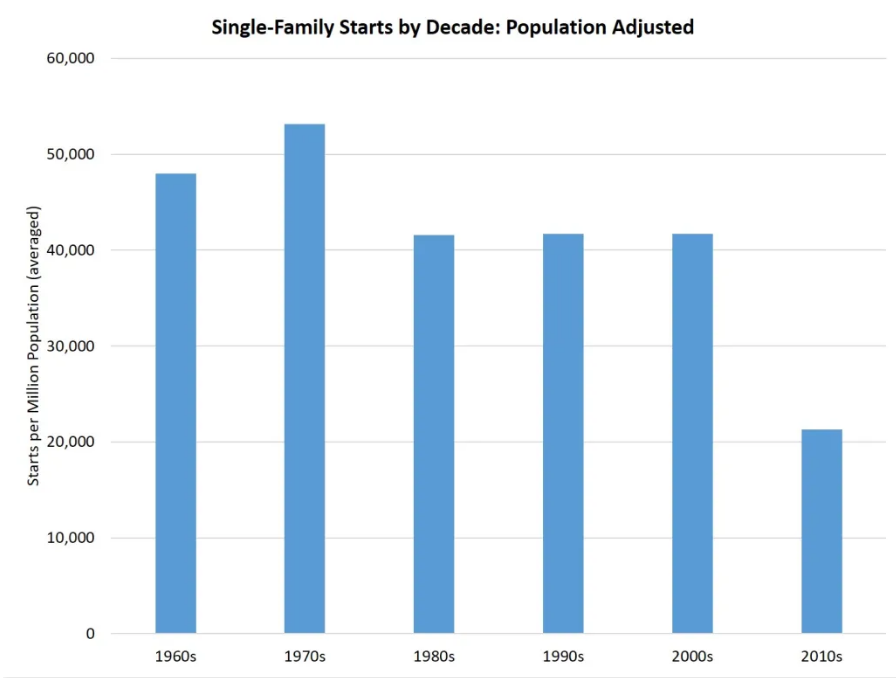
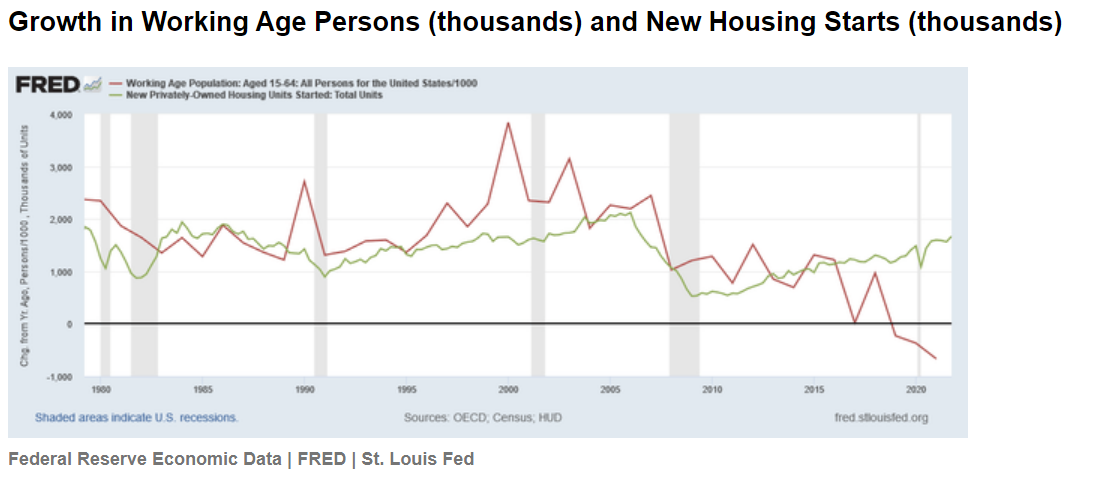
Housing units per capita has declined. New housing starts have not kept up with population growth.

https://www.mercatus.org/bridge/commentary/us-data-housing-starts-can-be-misleading

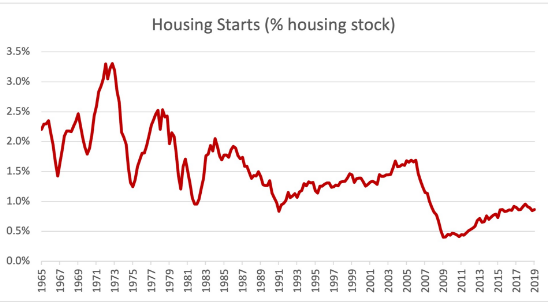
Compared with the overall size of the market, housing starts have become a smaller and smaller share.

https://www.freddiemac.com/research/forecast/20170726-lean-inventory-of-houses
https://www.whitehouse.gov/cea/written-materials/2021/09/01/alleviating-supply-constraints-in-the-housing-market/

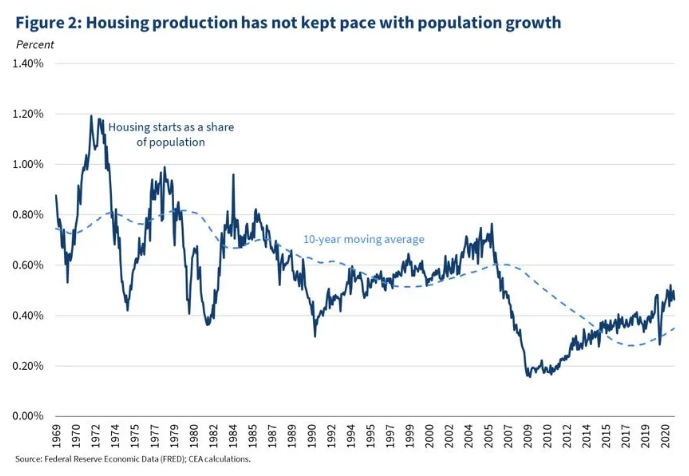
The last graph is most persuasive for me. Housing starts are less than one-half of what they were in the 1970’s. That’s a big drop. It’s possible that consumers have just chosen to consume less housing and more of other goods and services, but that does not appear to be the case.

https://www.mercatus.org/system/files/erdmann_-mophousing_was_undersupplied_during_the_great_housing_bubble-_v1.pdf

Overall, we’re missing 5-8 million units out of 128 million units in a market that is struggling to deliver 1.6 million units to meet the normal demand.

The Freddie Mac experts come up with a smaller number, just 3.8 million.

https://www.freddiemac.com/research/insight/20181205-major-challenge-to-u.s.-housing-supply

https://www.freddiemac.com/research/insight/20210507-housing-supply

Contrary Views: Supply is OK, Too Much Short-term Demand

https://seekingalpha.com/article/4498666-us-housing-is-a-dead-man-walking
https://www.forbes.com/sites/billconerly/2021/02/03/housing-boom-will-end-after-2021/?sh=27038d981e41

As noted earlier, the total housing units per capita ratio is relatively consistent. “Everybody gotta be somewhere”. The total housing units level has grown, with rental units replacing the desired and missing single-family units. The other graphs are comparing two rates of change and concluding that the rates of change are roughly equal, so there cannot be a shortage. I believe that the very deep and historically unprecedented (except for WW II) catastrophic decline in single family home construction from 2006-2020 created a material deficit in the stock of single family homes. The very weak economic recovery after the “Great Recession” held back new household formation and effective demand for new single family homes, so the construction industry did not recover back to its prior level for a full decade or more. The deficit remains.

Summary

One of the most important concepts in Economics 101 is “stocks and flows”. Stocks are a summary quantity at a single point in time, like all of the gallons of water in Lake Erie behind Niagara Falls. Flows are a quantity per unit of time, like the gallons of water flowing over Niagara Falls per minute, hour or day. Our economy contains both “stocks and flows”, especially relevant in the housing market. The flow of new home construction (single family or multi-family) is one of the most volatile components of GDP (flow of $ produced per year).

Historically, major changes in home construction have driven a majority of all business cycle declines. Bank runs and changes in interest rates account for another one-third. Supply shocks and international trade/currency changes account for the remainder.

Most markets “clear” in a relatively short time period and we collectively quickly benefit from the increases in prices that attract producers and drive consumers to find “next best” options and from the decreases in prices that force producers to leave an industry and reallocate capital elsewhere and the relative increase in consumer demand that limits price declines.

Unfortunately, the real estate industry works across much longer time frames. Consumers “want” to own single-family homes, but they can rent or live with relatives for many years. Construction firms are unable to quickly increase their supply capacity when demand increases. This is an industry where “learning by doing” remains a core factor.

The construction industry was truly “decimated” in 2006-7-8. One-half, two-thirds, three-fourths or four-fifths of all firms in any local market (general contractors and suppliers) were bankrupted. It has been slow to recover as banks were “burned” by construction loans and slow to extend credit to anyone.

The remaining construction firms reached new “critical mass” by 2017 and have been expanding rapidly, subject to zoning, land acquisition, labor and materials constraints.

Nonetheless, the cumulative supply deficit is quite large and will drive housing price increases for many years, perhaps another decade!

Indy Metro Housing Market: Not the Hottest!

All of the national indicators point to an overheated housing market.

Houses are selling in 30 days, 60% faster than their usual 75 days on the market.

The median home sold for $320,000 throughout 2017-18-19-20. Homes now sell for $100,000 more at $420,000. That’s a 30% increase. We’ve had 10% inflation during this time, so that’s still 20% extra.

Builders have joined the party, showing the same pattern.

https://www.corelogic.com/intelligence/april-jump-in-us-rent-price-growth-puts-pressure-on-inflation-corelogic-reports/

Single family rental prices have also followed suit.

Real, inflation-adjusted, home prices are at an all-time high, equal to those just before the bubble popped starting the “Great Recession”.

Are current house prices sustainable? I think so. Will they continue to increase by 15% per year? No. Prices will level off based on the slow-down of the overall economy, lower consumer confidence, higher mortage rates, etc. Prices are sustainable due to supply and demand. Population growth in the US has continued, especially those aged 25-34 who form the age range where ownership increases.

https://www.freddiemac.com/fmac-resources/research/pdf/202105-Note-Housing_Supply-08.pdf

The supply of new housing has lagged greatly since the Great Recession, compared with history and population. The supply of “starter homes” has been especially low.

The US population has not quite doubled since 1960, but we’re getting close.

Let’s use 1.5 million housing starts as the typical level for 1960-1970. The comparable level today would be at least 2.25 million, even accounting for the “catch-up” in the 1950’s and 1960’s to make up for the housing shortfall in the 1930’s and 1940’s. The 1970’s and 1980’s were very weak decades due to international competition, energy crises, crazy high mortgage rates, recessions, stagflation, etc. The Clinton economic recovery in the 1990’s was strong for employment, low inflation, lower mortgage rates and zero federal budget deficits, but the economic gains were not disproportionately invested in the housing market. The population had increased from 180 to 280 million (55%), but housing starts were essentially “flat”.

The turn of the millennium saw a 25% increase in housing starts, from 1.6 to 2.0 million per year. This level was artificially supported by low interest rates and unsustainable mortgage lending practices. Based on the population, 2 million new homes built per year was sustainable in theory, but not in practice. The construction market dropped to near-zero. (0.5 million starts/year). It reached the 1959 (think about this) level of 1.6 million starts again only in 2020.

Let’s estimate the “lost” construction units of this 16-year period. Assume 1.6 million units per year is the long-term requirement. 2.9 million units were lost during 2007-10. Another 5.3 million units were lost from 2011-20. That’s a total of 8.2 million units, or about 4-5 years’ worth of construction. We can throw out the first period and assume this was offsetting unreasonable demand and supply before the Great Recession. But that still leaves 5.3 million missing units, 3 years worth of current construction. If we assume that 1.8 million units per year is the real long-term requirement, then the 2011-21 period was short another 2.2 million units, for a total of 7.5 million units, or nearly 5 years worth of current construction. At a national level, we still have a severe housing deficit.

https://www.freddiemac.com/research/insight/20210507-housing-supply

The decreased building of “starter homes” aggravates the situation. Home builders try to optimize the profit on their investment in land, within zoning rules, so they disproportionately build larger single-family homes.

The Freddie Mac folks estimate a 4 million home deficit, about one-half of my “back of the envelope” estimate. Even at that level, we have a 2.5-year shortfall. This shortfall will work to increase home prices at a rate above inflation for at least the next 5 years.

Indy metro population has grown at about the same rate as the nation in recent decades, so it is not surprising that it’s housing starts pattern is quite similar. Perhaps 1,200 permits per month, or 14,000 per year at the peak. Dropping by 75%, eliminating most of the local builders by 2008. The “recovery” has been even slower, reaching 800 permits per month only in late 2020 (2/3rds of the base). Doing the same kind of “rough” math, Indy has a minimum 400 permits per month deficit for 15 years, or 72,000 missing units. At 6,000 units per month, we have a 7-8 year shortfall!!! (flyover country) Assuming that metro Indy continues to be relatively attractive as a destination for college graduates and movers, existing housing prices should increase by more than inflation for the next decade, even though Indy is “cursed” by being a relatively small city with many freeways and housing development options in all directions (tongue placed firmly in cheek)

https://www.storagecafe.com/blog/despite-rising-home-prices-indiana-and-mid-atlantic-states-step-up-with-starter-homes/

Although Indy residents complain about recent increases in housing prices, even the higher end suburbs of Fishers and Carmel show up in an “affordable” housing article.

Metro Indy house prices increased by 40% from 1995-2005, but then flat-lined for the next decade, showing just a 40% increase over 20 years or less than 2% growth per year, slower than inflation. They grew by another 40% from 2015-20 in 6 years, 3 times faster than the previous 20 years. They grew much faster in the last year!

The 2%ish price increase rate bumped up to 5% from 2015-2020, before spiking to 20%.

https://www.realtor.com/research/topics/housing-supply/

Realtor.com says Indy has a $320K median list price, up 16% for the year, with 30 days listing to accepted offer.

FHA reports 15% price increases in Indy home sales. Indy ranks 63/100 metro areas, slightly below the average 17% rate, and well below the 30% price increases in southwest Florida.

https://www.fhfa.gov/DataTools/Tools/Pages/FHFA-HPI-Top-100-Metro-Area-Rankings.aspx?

https://www.redfin.com/news/redfin-rental-report-may-2022/

US rents are up by 25% in the last year and a half. Places like Cincinnati and Nashville are seeing 30% asking rent increases. Redfin reports 20% increases in Indy asking prices, but the $1,471 monthly rent remains in the bottom 20%.

Realtor.com reports a less “frothy” Indy rental market with 11% actual increases and a $1,275 per month rate.

As housing prices have spiked, analysts have attempted to identify the bubble areas. Indy is in the below average risk catgeory.

https://www.corelogic.com/intelligence/potential-risks-of-price-declines-in-the-real-estate-market/
https://fortune.com/2022/05/31/is-housing-market-bubble-which-markets-overvalued-home-prices/

Summary

The US housing industry is not like a typical consumer product or services market where the forces of supply and demand determine a market price and the equilibrium quantity of housing is delivered instantaneously. Households adapt, calculate, defer, overextend their housing demand based on many factors. Given the four-fold difference between peak and bottom supply, the construction industry is inherently unstable. Zoning rules and approvals change. Mortgage interest rates change. The economy moves through business cycles. Houses are built with 40-60-80 year expected lives, but consumed one year at a time.

The US economy has underinvested in housing for 15 years. The population has grown and median household incomes have grown. Households have aged and decided they prefer single family houses. There is a 3-5-7 year deficit of new housing. Housing prices will increase faster than inflation for the next decade. Indianapolis may see housing prices rise even faster than the national average since it has built relatively fewer new homes.