


For each comparison, I’ll focus on the pre-pandemic Feb, 2020 numbers, the effective bottom rate in Jun/Jul, 2020 and today’s rate at May, 2022, about 2 years later.
The overall labor force participation rate dropped by 2 points from 63.4% to 61.4% and has recovered about half-way to 62.3%.

While many hope for a faster recovery, this 1% increase in 2 years is faster than from prior recessions. It is also taking place in the context of a long-term decline from 2000 to 2015, followed by a plateau and a bit of an increase in 2019 as the recovery from the “Great Recession” moved into a record length with record low unemployment.

The Hispanic rate generally followed the overall rate since 2000. However, the rate increased by a full 2 points in 2019. Hispanic labor force participation encountered a larger drop of almost 3 points, but has recovered one-half of the decline.

The Asian LFP rate follows the same general decline and flattening, with a somewhat higher rate in 2018-19 than the minimums from 2014-16. It dropped a little less than the overall average during the pandemic, by 1.7% and has fully recovered to the pre-pandemic level!
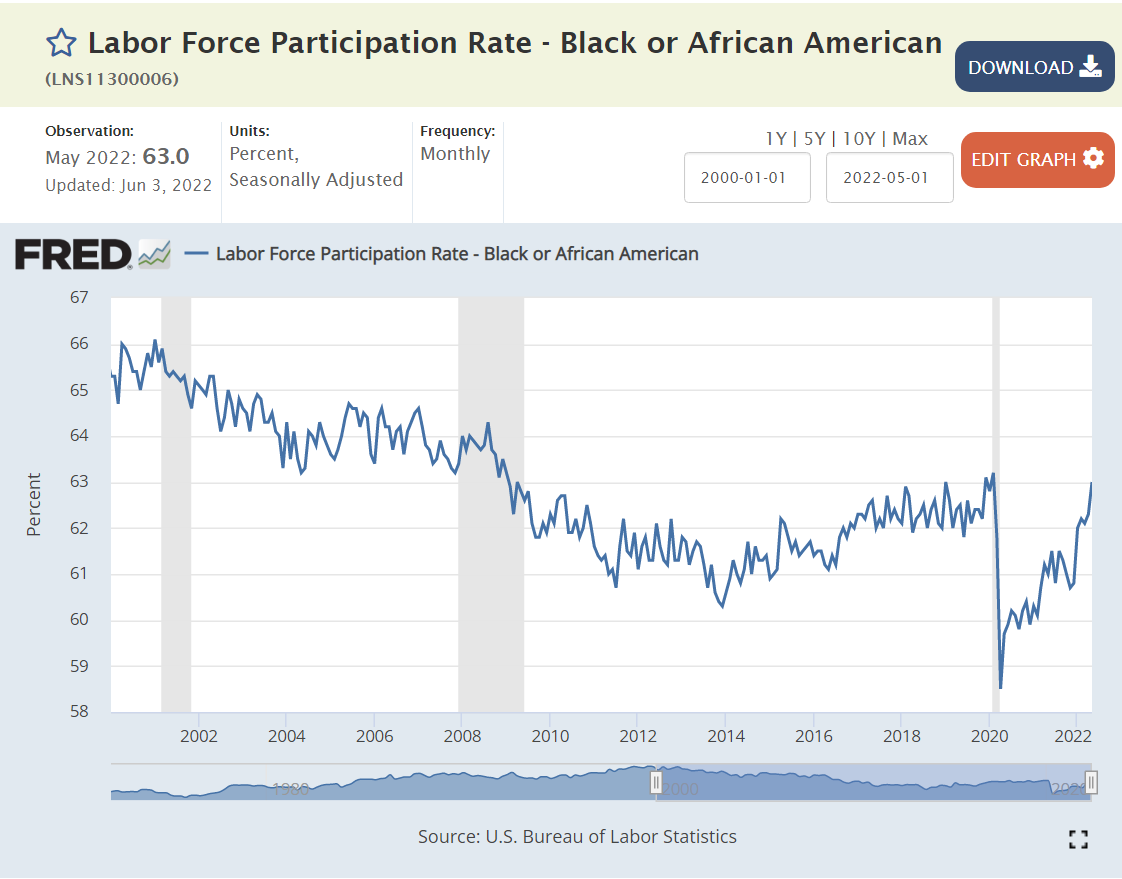
Black Americans showed the same general decline after 2000 to a minimum of 63% in 2015, with a significant and maintained increase to 64% in 2016 and a further 1% increase in 2019. Black labor force participation fell by a little more than 3 points to just 60%. It quickly added 1 point and in the last 6 months has added 2 more points, returning to its pre-pandemic 11 year high!
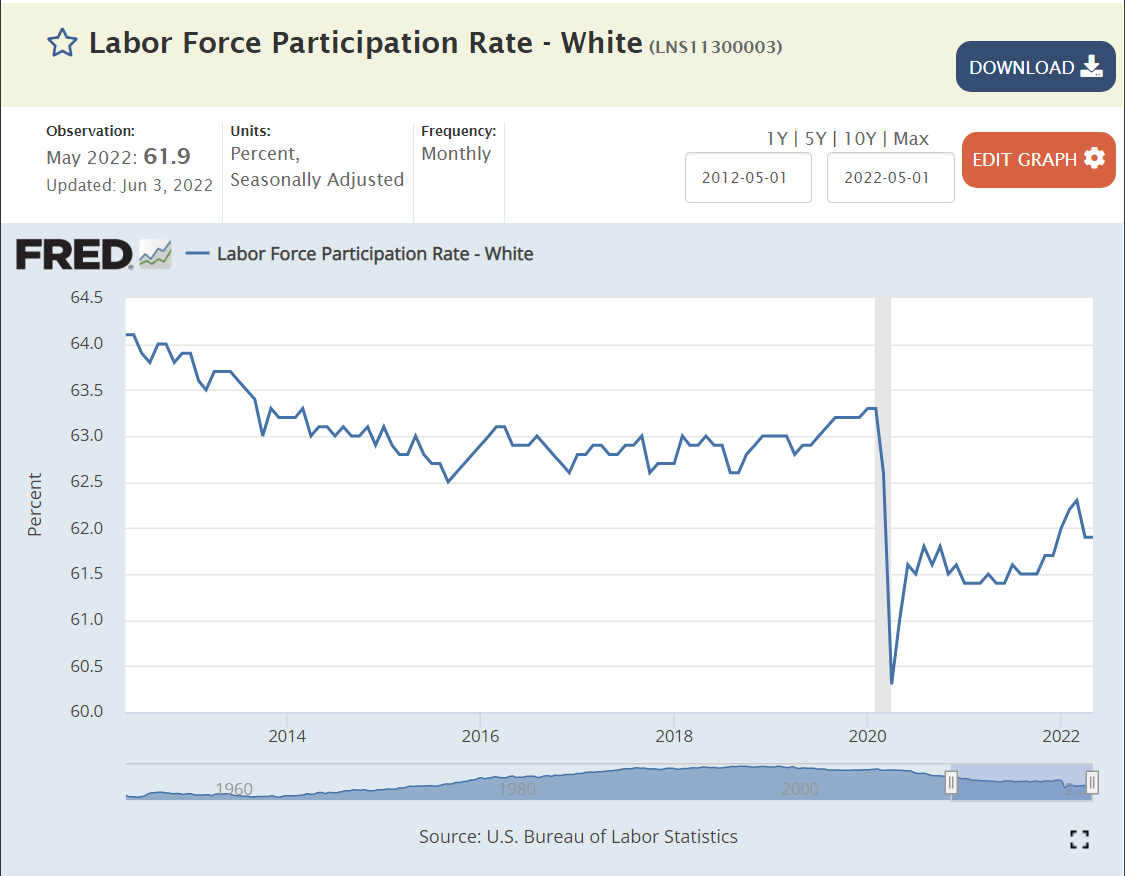
The White rate followed the overall pattern, but remained at the 63% plateau through the middle of 2019 before inching up by one-half percent. The participation rate was 1.8% lower in Jun/Jul, 2020. It did not change materially through the 3rd quarter of 2021, and has since added 0.4%. The White rate has recovered only 30% of the lost participation rate.

Women had added about one point of participation between 2016 and the beginning of 2020. Their participation declined a little less than men, at 1.8%. Women were slow to return to the work force during 2021, but have now closed one-half of the gap.


The Male participation rate remained flat from 2014 through the end of 2019. Note that male participation has been declining for 70 years. 2.1% of men left the labor force by Jun/Jul, 2020. The return during 2020-2021 was slow. The more recent increase has 40% of the absent men returned to the workforce.

Black men did not see a major participation rate increase in 2019. They experienced a 2.6% decline from the pandemic, followed by a 1% increase in the next year and a dramatic improvement in 2022 to a participation rate above the pre-pandemic level.

About 1.5% of Black Women were attracted into the labor force in 2019. Their pandemic decline was a very high 3.9%. They have added 2.7% of participation, so are about 3/4ths recovered.
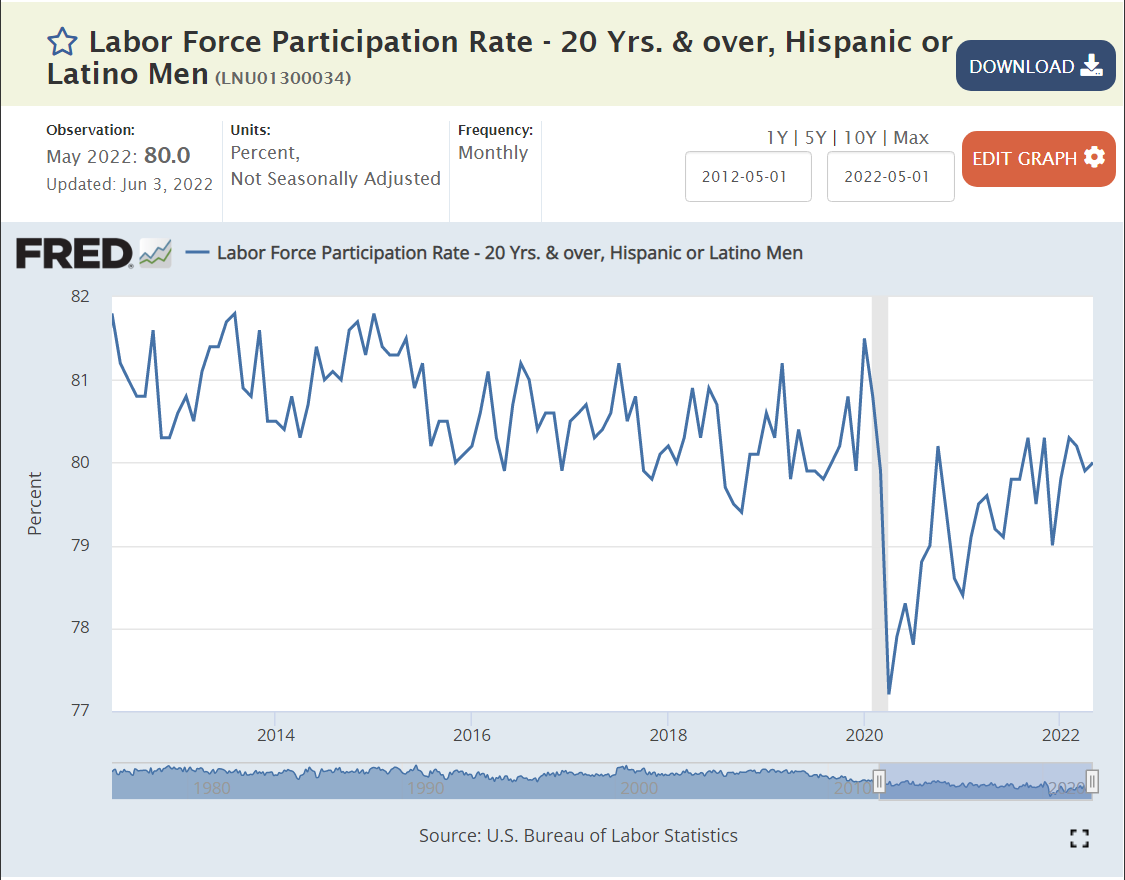
Hispanic men did not show a clear participation increase in 2019. Their rate fell by a large 2.8% in the pandemic. It has rebounded by 2%, so is about 2/3rds recovered.

An additional 3% of Hispanic women entered the labor force during 2018-19. Their participation rate fell by 3.3% and remained low through the third quarter of 2021. It has grown by less than 1%, leaving it at a one-fourth recovery level.

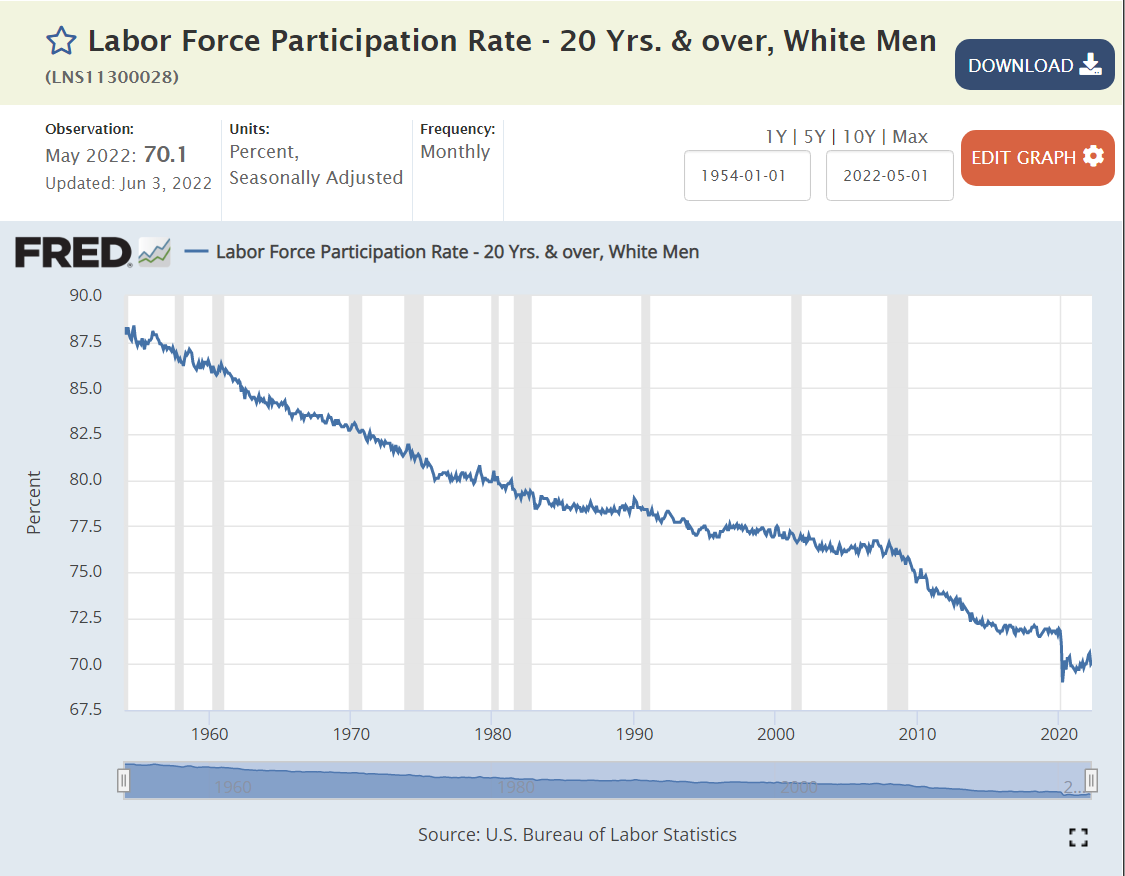
White men did not increase their engagement during 2019 and recorded a 1.8% participation decline. There has been no significant recovery at this date.
Looking at the long-term trend, it may be that the 2015-19 rates were just a “pause” in the long-term decline. This topic warrants a separate article.
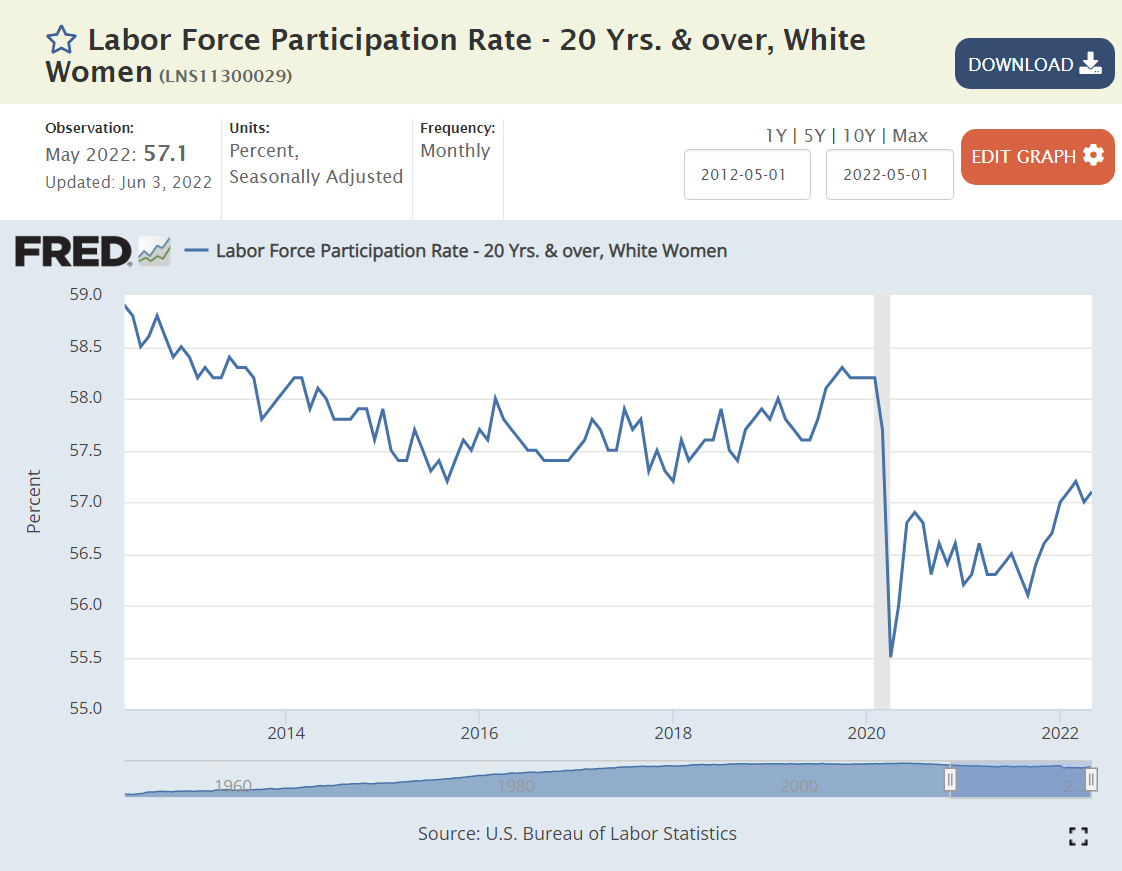
A smaller percentage of White women were drawn into the labor force during 2019, less than 1%. Their participation rate declined by 1.4% by Jun/Jul, 2020 and by 2% total in mid-2021 before beginning to recover. They have recovered by one-fourth to one-third of their decline.

Teenagers were least impacted by the pandemic, returning to prior work levels in less than a year.

College age young adults added almost 2 points of participation during 2018-19. They dropped a stunning 5.3% during the pandemic. They have recovered a solid 2.8%, so are a little more than 50% back.
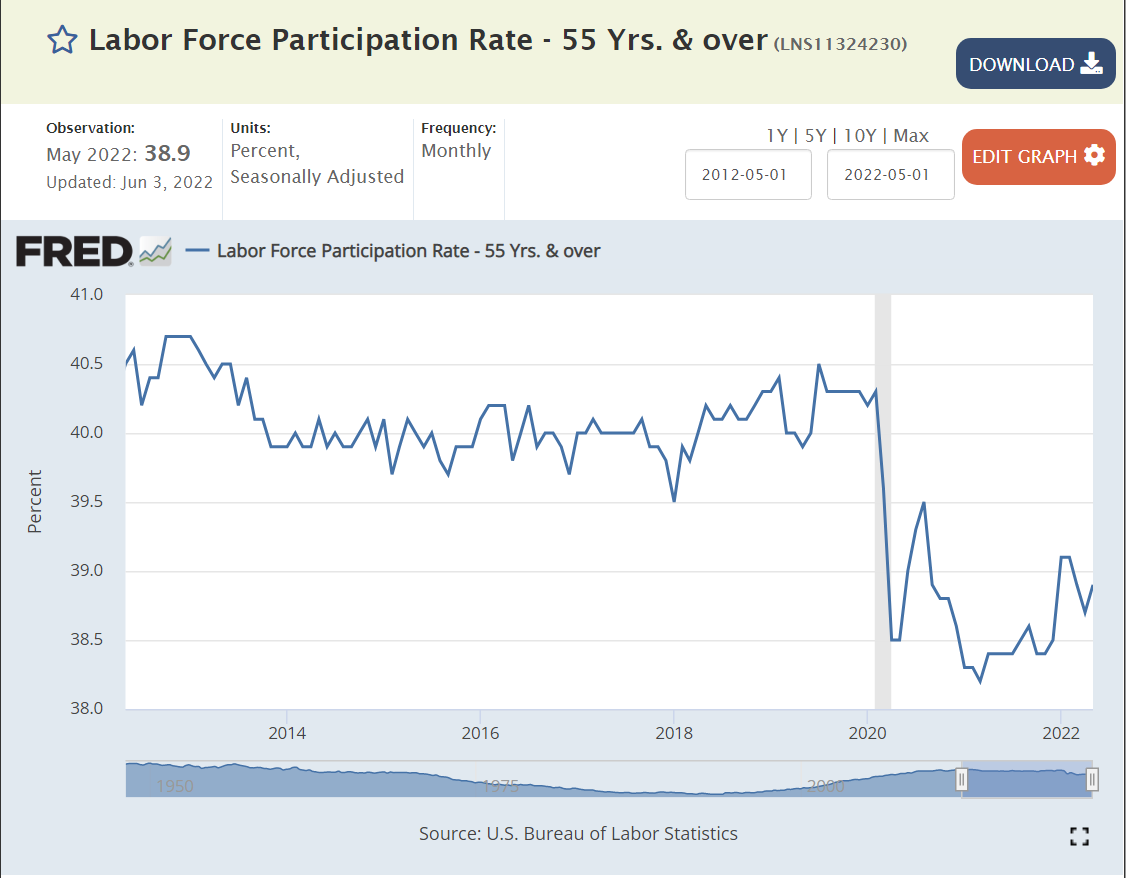
The 55 and older group didn’t add many workers in 2019. Their participation declined by 1.1% and then by 1.7% total during 2021. They have recovered about one-third of the maximum decline.
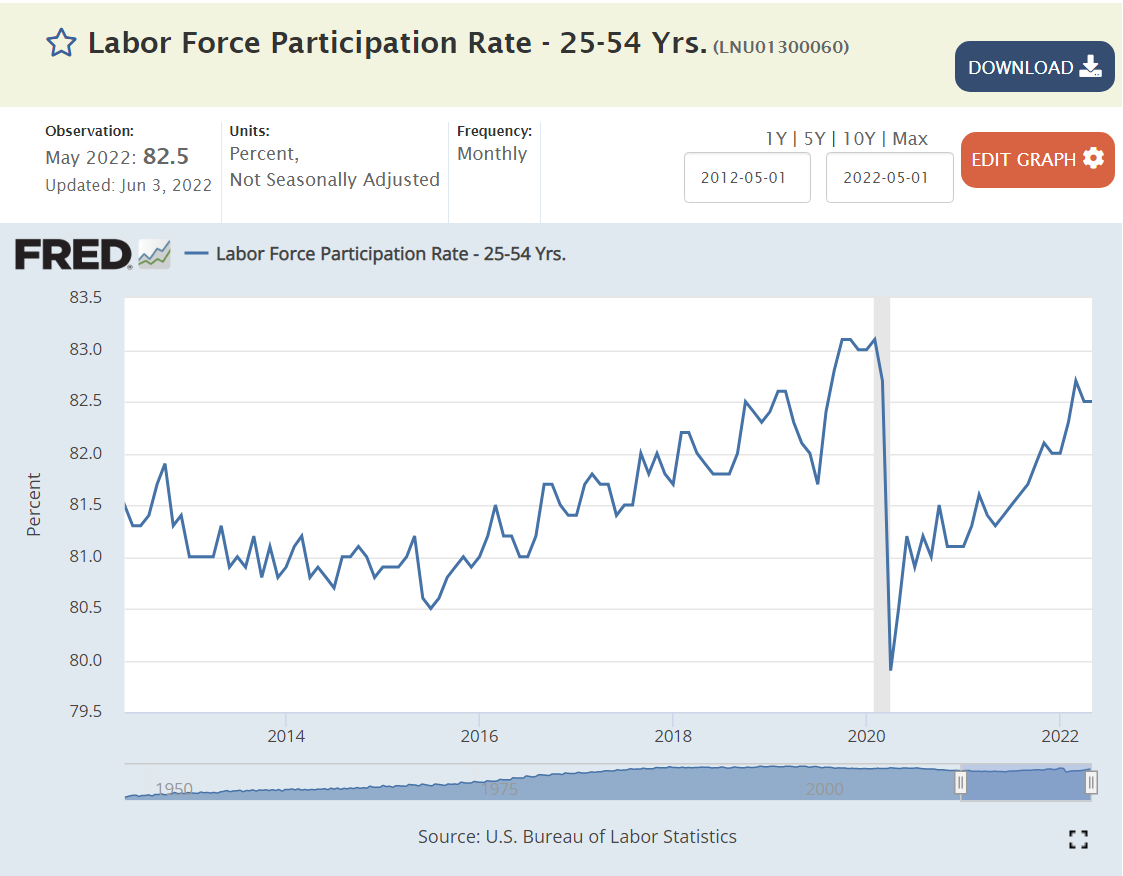
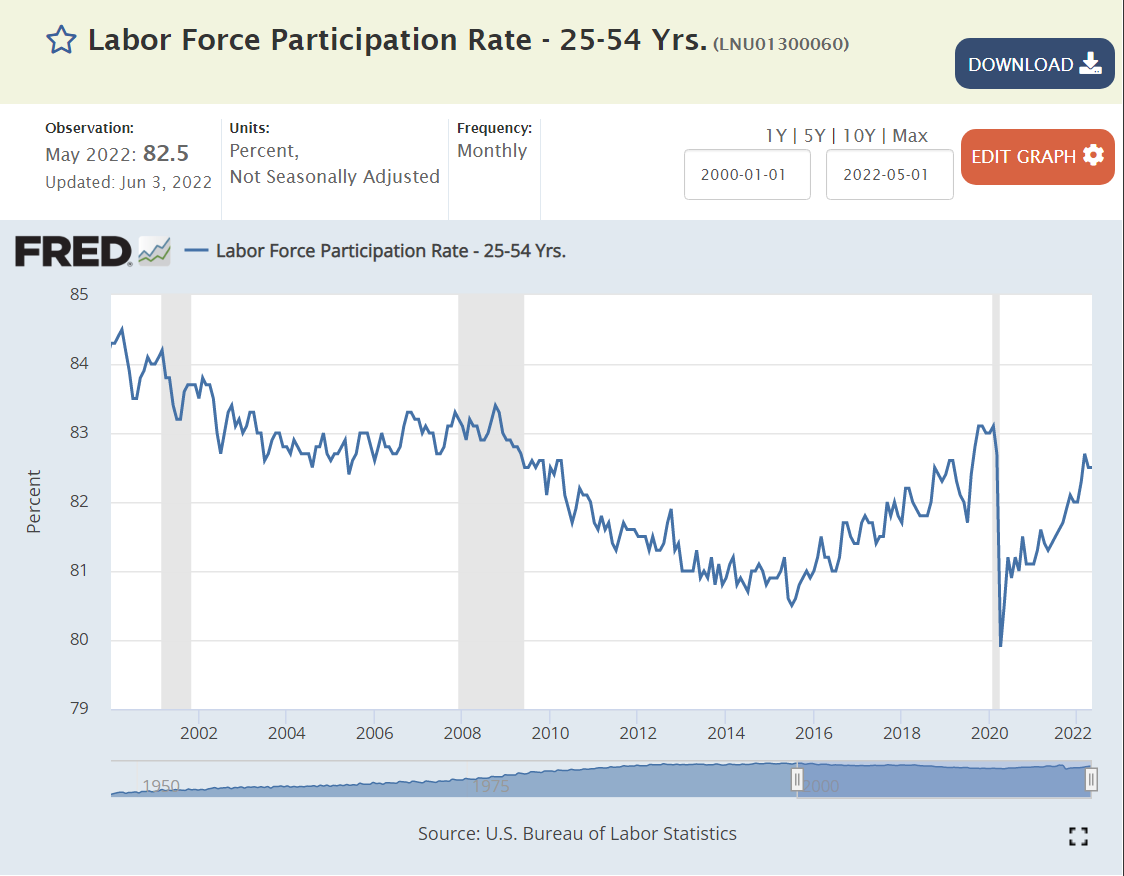
The prime age (25-54) work force participation rate dropped 3 points, from 84% to 81%, between 2000 and 2015 in periods often decried as “jobless recoveries”. This group added 2 points of participation during 2016-19 as the recovery was extended, jobs added and unemployment reduced to record lows. Participation dropped by 2.1% in the pandemic. It has recovered 1.5%, so it is about three-fourths back to the elevated pre-pandemic level. The monthly increase rate looks very solid.

Prime age men added almost 1% of participation from 2016-2019 before losing 1.5% in the pandemic. They have added 1 point of participation, so are two-thirds recovered.

Prime age women added almost 3 points of participation from 2016-19, but experienced a 1.7% reduction during the pandemic. They have added 1.4% to their participation rate, reaching 80% of total recovery to the high pre-pandemic level.

The even simpler ratio of employment to population shows a near total recovery in the prime age population. The steepness of the curve indicates that this will continue, at least in the short-run, even though the peak ratio was only 80.2%, 80.2% and 80.5% in 3 prior economic expansions. In 1999, the recent record was 81.9%.
Summary
From 2000 to 2015, the overall, male and white-male labor force participation rates declined by 4%, 5.5% and 5%. These rates bottomed out from 2016-18, with small increases in 2019. The recovery from the pandemic is fighting long-term trends that result in lower labor force participation (lower and later marriages, declining/flat pay for lower-skilled workers, increased disability claims, increased criminal, drug and alcohol records, social acceptance of not working, electronic entertainment options, etc.). Minority groups saw stronger 1-2% participation rate increases in the last years before the pandemic.
Hispanics, Blacks, teens and college students experienced pandemic dropout rates much higher than the 2% average from Feb, 2020 to Jun/Jul, 2020.
Overall, one-half of the decline has been recovered, but there are significant differences among the groups. Adults 55+ have remained close to their reduced rates. White men (a big share of the labor force) have made little progress returning to the labor force. Less than one-fourth of Hispanic women have returned. Two-thirds of the Hispanic male decline has been recovered. Three-fourths of the Black female gap has been closed. Teen participation has recovered (90%). Asian participation has fully recovered. Black male participation is above the pre-pandemic level.
The prime age group (25-54) has regained 1.5% of its 2.1% decline and the recovery trend looks solid in spite of the slower recovery groups.
Labor force participation has not increased quickly in prior periods. Based on the significant increases in the last 6-months, a continued increase in the participation rate through the end of the year is likely. I estimate that the pre-pandemic participation rate of 63.4% will be reached in the 1st quarter of 2023.
