
Dems Win Even Fewer Counties in 2016, But an Increased 64% of GDP!
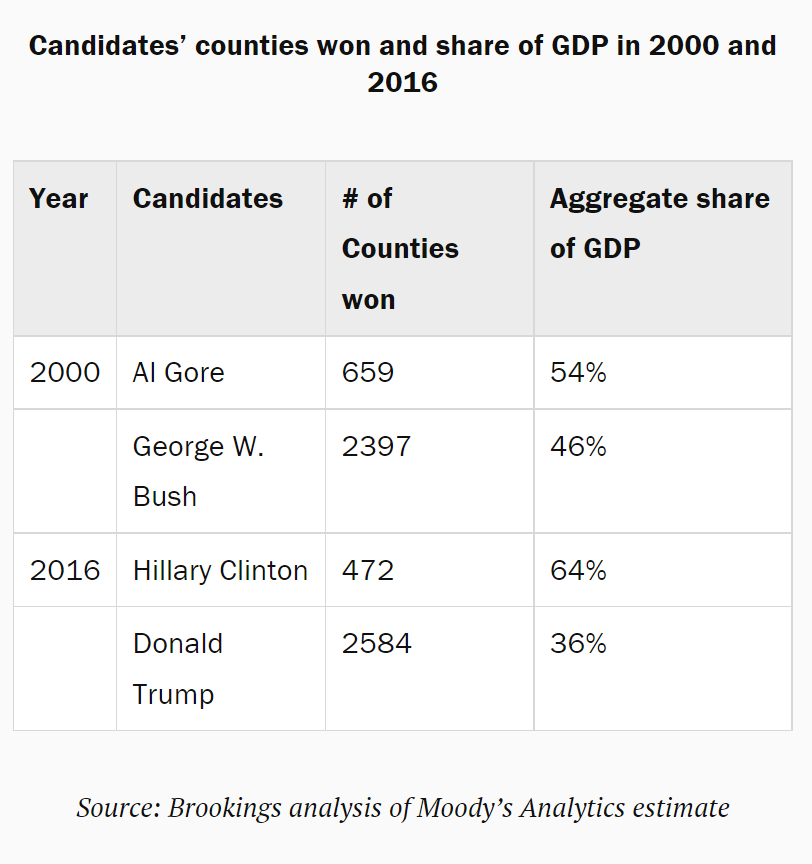

The rural versus urban split in American politics was very clear in the 2016 presidential election.
Trump Won 2016 in Rural Leaning Areas

Democrats are the Metro Party, Representing Just 20% of the Land Area

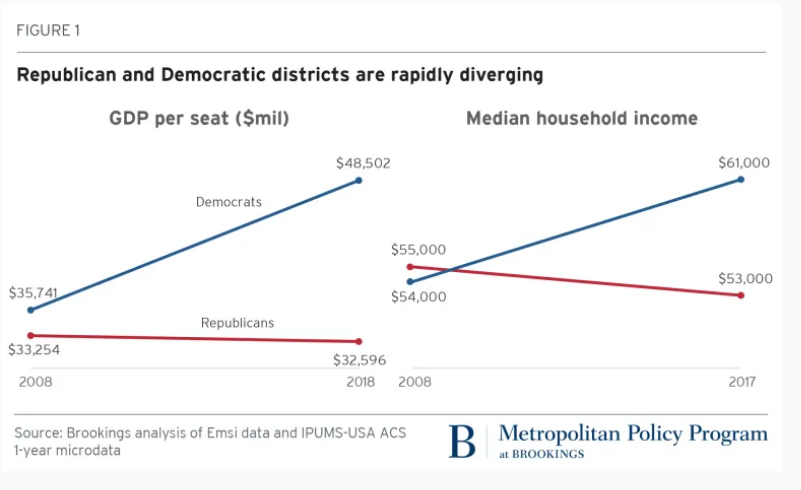
Democratic Congressional Districts are Increasingly More Economically Productive
Larger Metro Areas Continue to Grow Faster

Threat of Automation Job Reduction Haunts Republican States More

Trump Counties Employment Growth Increased in 2018, Due to Cyclical Expansion of Maunfacturing

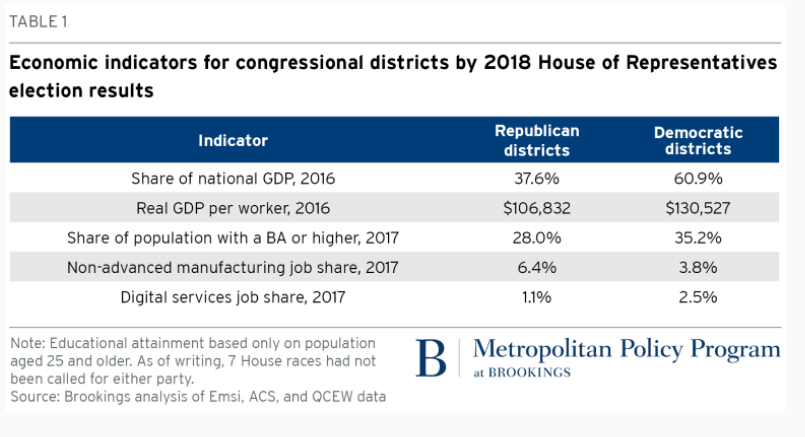
Democratic versus Republican Local Economies Split Becomes Much Clearer by 2018
Dems represent just 20% of the US land area.
Dem GDP/district is 50% higher than Republican areas.
Dem district median income is 15% higher.
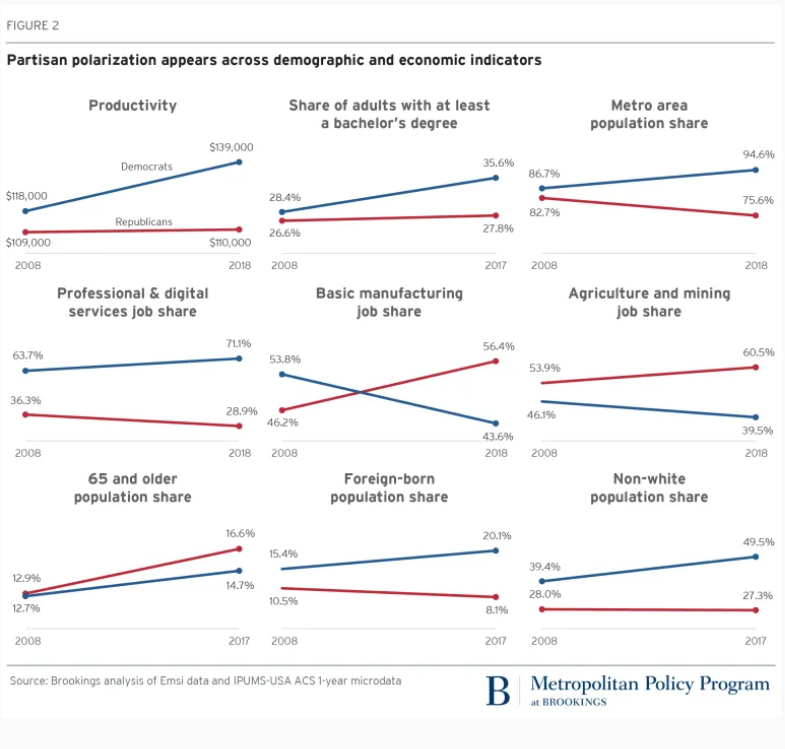
Dem district productivity is 75% higher.
Dem districts have 36% college degree holders versus 28%.
Reps have more basic manufacturing (56%) and agriculture/mining (60%).
Dem districts have more foreign-born population (20/8) and more non-white residents (50/28).
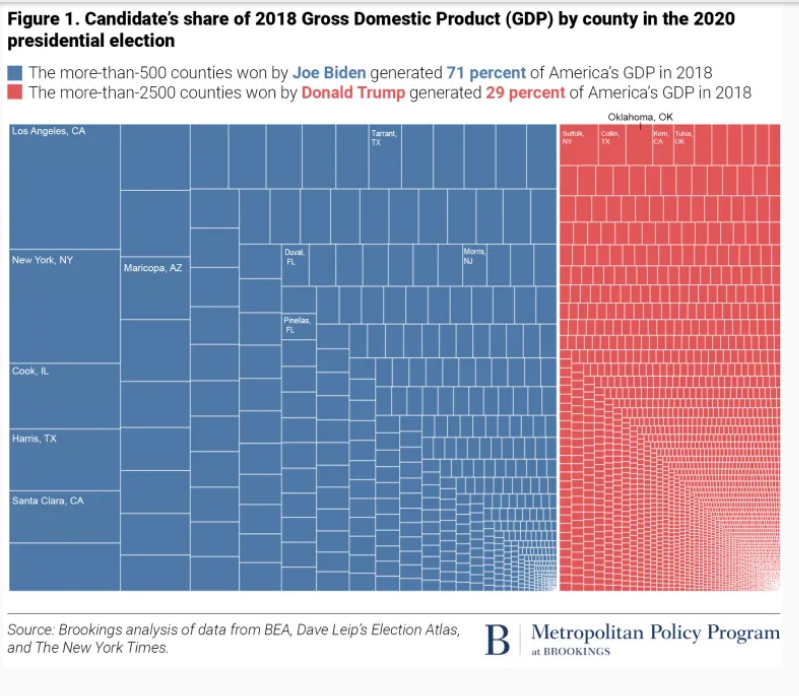
Biden Democratic Coalition Represents 71% of US $GDP

Democrats Represent 61% of GDP at Senate Level
Just 6 of 50 states have split US Senate representation. WV, OH, PA, ME, WI and MT account for slightly less than 10% of the 2021 US GDP.
Republicans have 2 Senators in 22 states, which account for $6.6T of GDP.
Democrats have 2 Senators in 22 states, which account for $10.8T of GDP.
Splitting the GDP for the 6 split states 50/50 results in $7.5T in Republican states and $11.7T in Democratic states. The Democratic states have 57% greater GDP in 2021.
The Democratic percentage advantage in 1997 GDP per state is identical. Republican states produced $4.5T while Democratic states produced $7.1T. Between 1997 and 2021, Democratic and Republican states grew at equal percentages. In dollar terms, Democratic states added $4.6T, while Republican states added $3.0T.
Percentages are difficult to digest. One way to compare the 2021 GDP of the two parties is to use “paired comparisons” and then examine the remaining non-paired states. 13 roughly equal pairs can be identified. WY-VT, AL-RI, ND-DE, ID-MA, KS-NV, MS-NH, AR-NM, SC-OR, LA-AZ, MO-CT, TN-MN, IN-MD and NC-MA.
The remaining Republican states have lower $GDP figures but can be mapped to equal $GDP Democratic states. IA+NE+SD=CO. FL+TX=CA. KY+AL+OK+UT=IL.
This leaves 6 states that represent the $4.5T (57%) Democratic state advantage: Michigan ($0.5T), New Jersey ($0.6T), New York ($1.5T), Virginia ($0.5T), Georgia ($0.6T) and Washington ($0.6T).
Summary
The Post-Trump Republican Party is distinctively different, representing a broader share of the American geography, but a smaller share of its income, production and diversity. This split reinforces the polarizing tendencies of recent decades, making attempts to find “common ground” at the national level more difficult.
