Nietzsche Declared It In 1882: 7 Generations Ago
https://philosophybreak.com/articles/god-is-dead-nietzsche-famous-statement-explained/
Time Magazine Taunted 1966: 3 Generations Ago
80-90% Believe in God or a “Higher Power”

56% believe in God as described in the Bible. Another 23% have a less literal belief in God. Of the 20% who answer “no”, fully one-half believe in some kind of higher power or spiritual force. Only 10%, in 2017, fully rejected any supreme being/force/concept.
Time Says 90% Believe in God

https://time.com/4283975/god-belief-religion-americans/
Gallup Poll Reinforces 80-90% Belief

https://news.gallup.com/poll/268205/americans-believe-god.aspx
US Belief In God Is Twice as High as In Europe
56% in US believe in Biblical God versus 27% in Europe.
U.S. adults are more religious than Western Europeans
Belief in God Forecast to Grow Globally
The Future of World Religions: Population Growth Projections, 2010-2050
However: Non-Religion Affiliated Folks Grew

From 7% to 22% by this measure!
PRRI summarizes their data and Pew data to assert that the unaffiliated population grew from 16% to 25% but has recently fallen back to 23%.
Other analysts conclude that the “nones” account for up to 30% of the population.
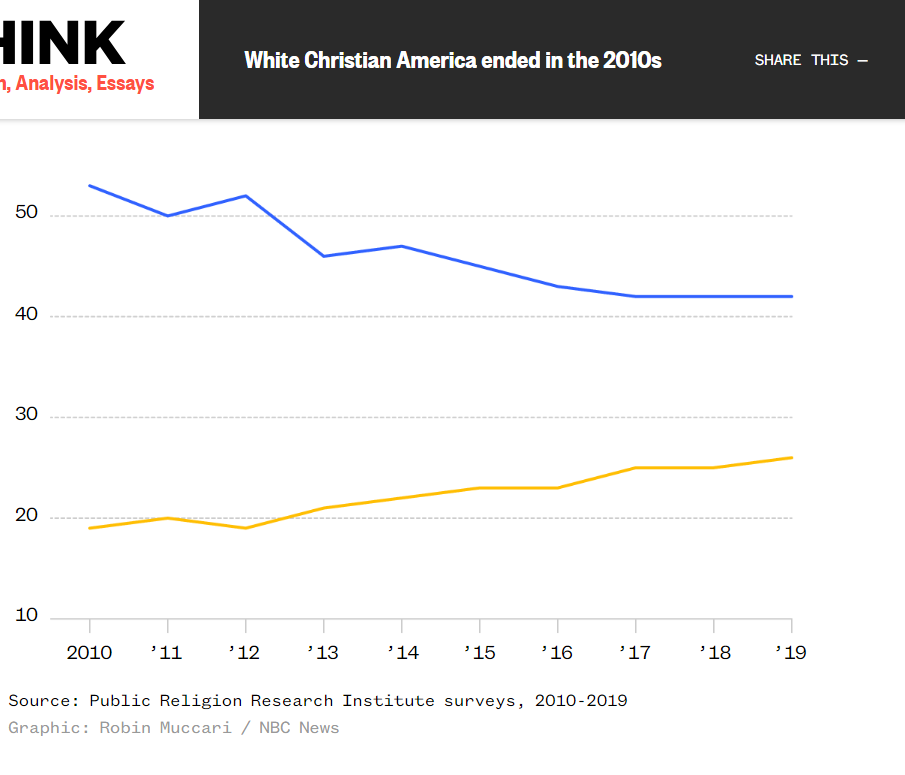
https://www.nbcnews.com/think/opinion/2010s-spelled-end-white-christian-america-ncna1106936
This survey shows the “unaffiliated” category increases from 20% to 26%.
Fewer Young Adults Belong to Churches


Religious Believers Maintain Same Activities
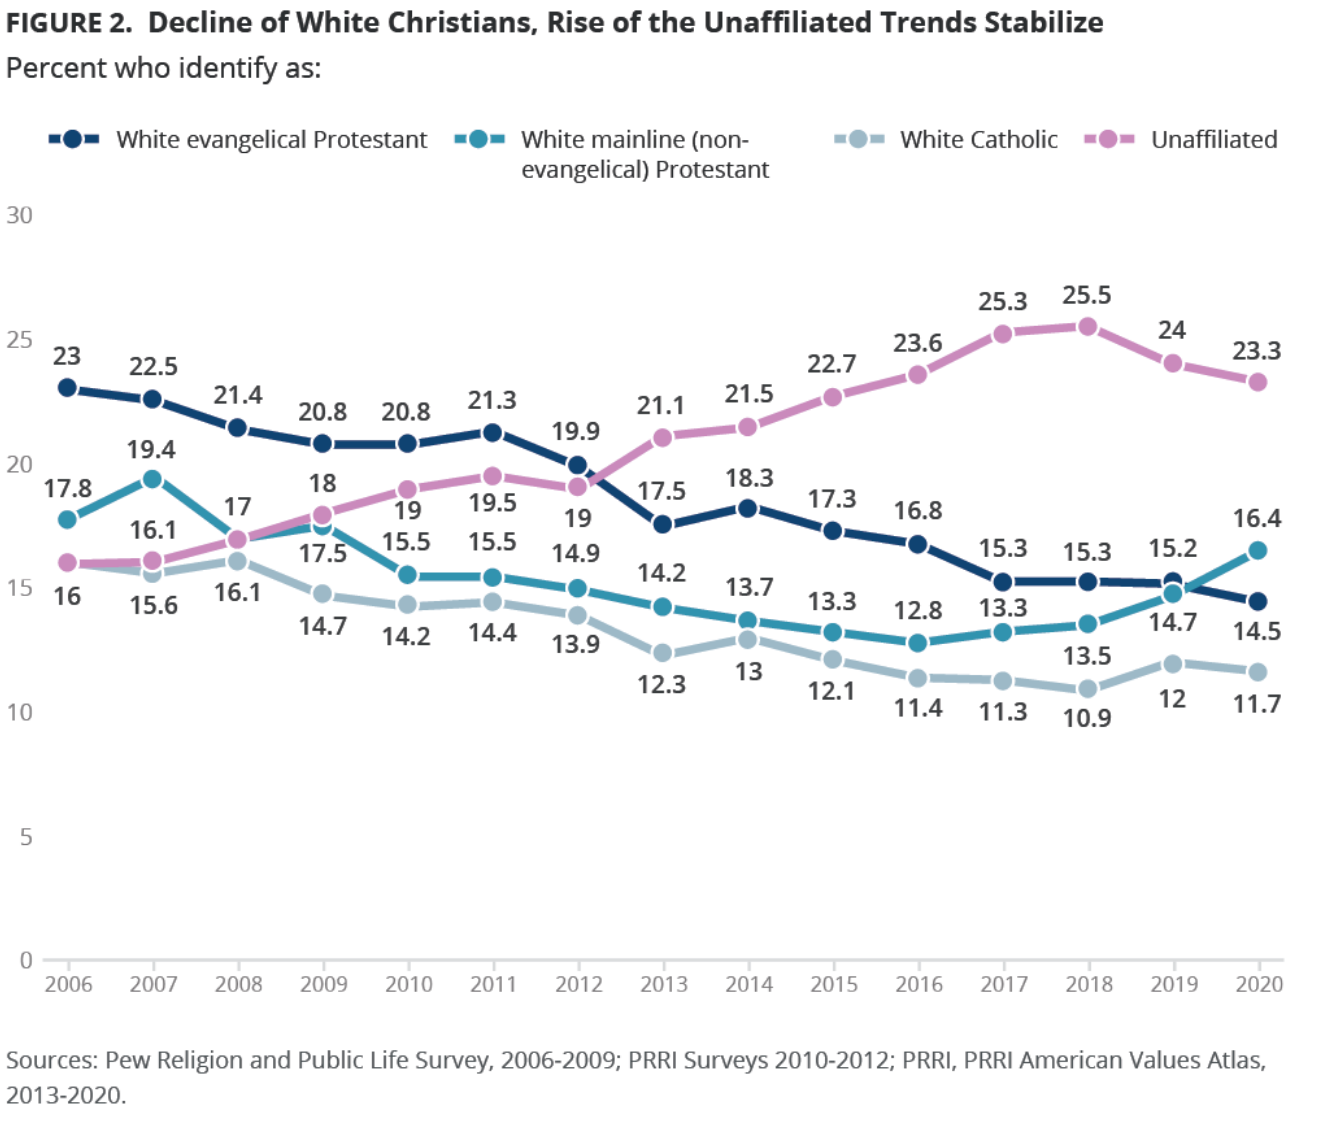
Mainstream Protestants Fell, Bottomed, Recovered


From 28% to 12%, or from 18% to 13%.
Evangelicals Grew, Then Declined
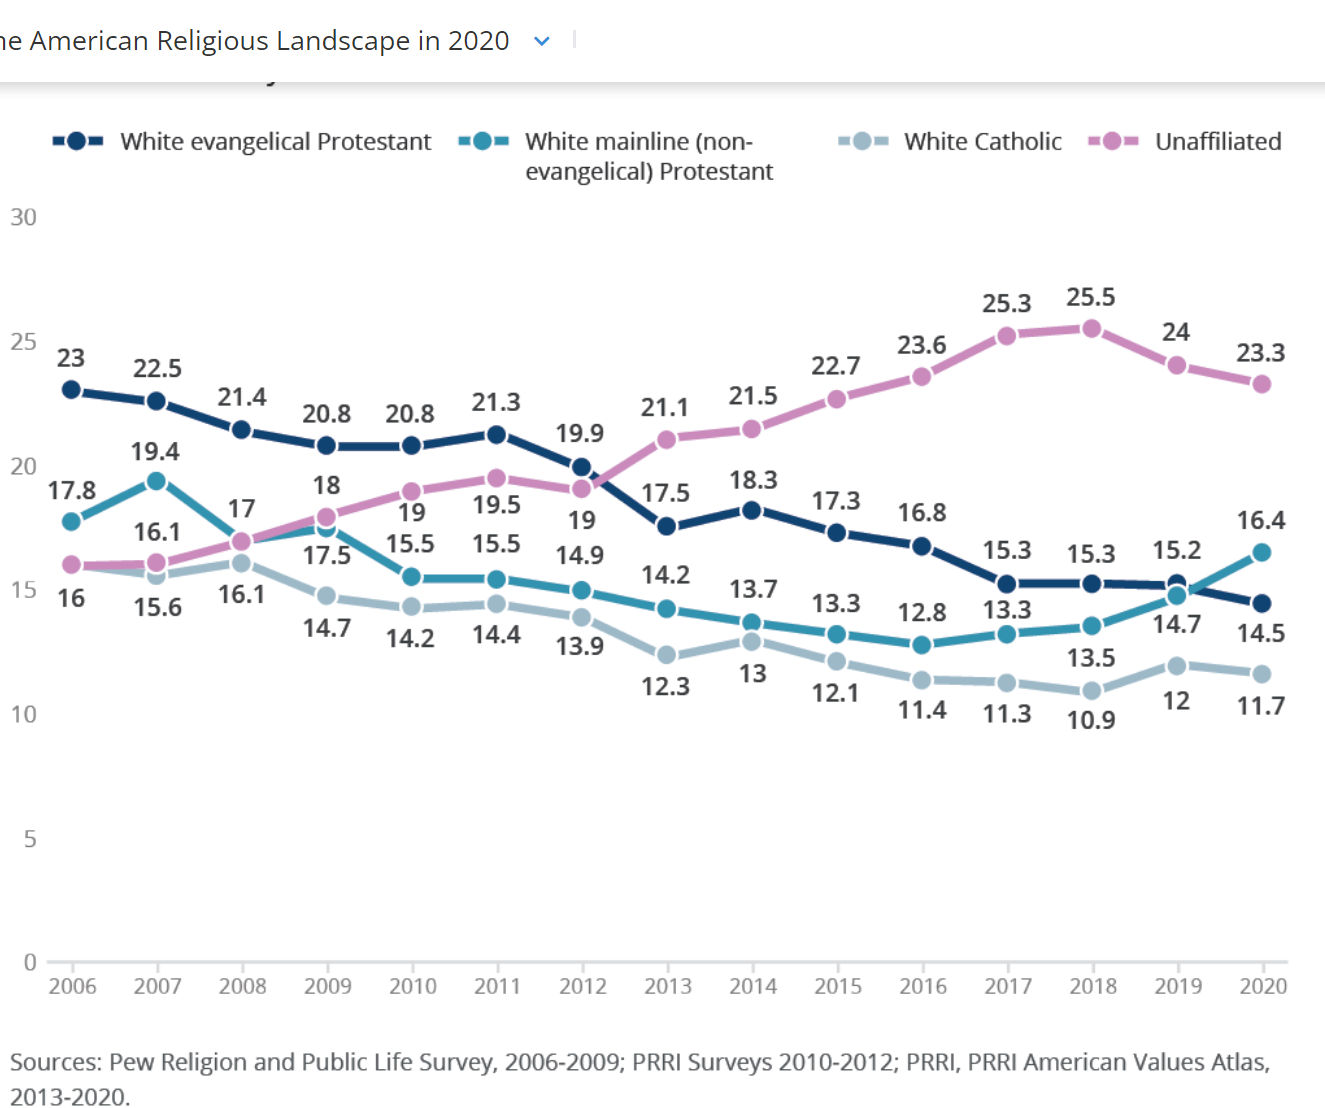


About Three-in-Ten U.S. Adults Are Now Religiously Unaffiliated
Based on a “born again” definition, evangelicals have declined by 6%.
https://www.cnn.com/2021/07/10/opinions/american-evangelicals-protestantism-butler-bass/index.html
Evangelicals Increasingly Overlap With Republican Party Identification

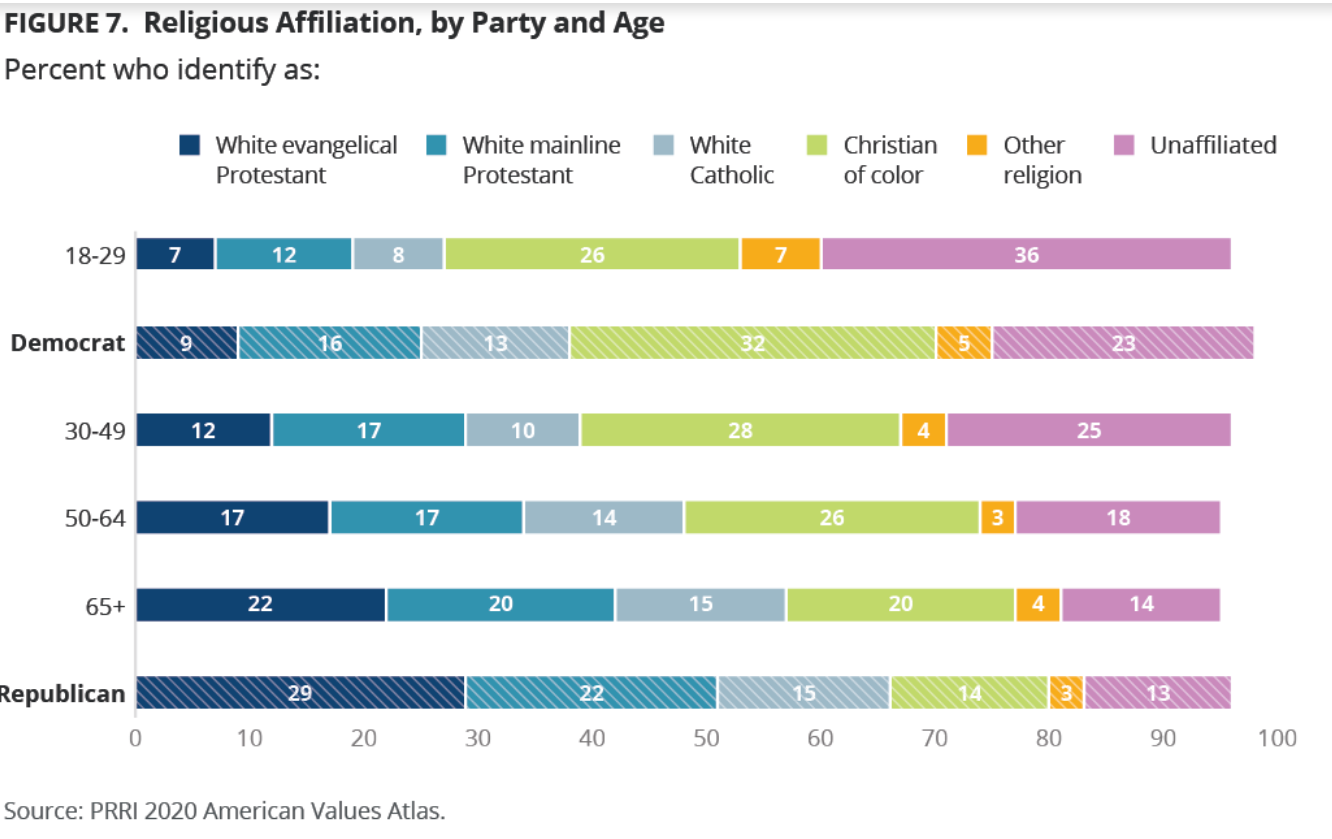
https://www.sltrib.com/opinion/commentary/2021/10/27/ryan-burge-why/
Summary
US citizens belief in God remains strong, between 80-90%. Church affiliation has declined to 70%. Mainline (liberal-centrist) Protestant believers have declined dramatically, but recently stabilized. Evangelical Protestant believers increased in the 1980’s and 1990’s, but have declined somewhat since then. Catholic membership has remained roughly constant, with Hispanics replacing Whites.
The decline in Whites as a percentage of the US population, combined with the increase in non/other believers has lead to headlines proclaiming the end of a majority White Christian America. This is true statistically, with politicians attempting to take advantage of the situation.
https://www.nbcnews.com/think/opinion/2010s-spelled-end-white-christian-america-ncna1106936