
https://fred.stlouisfed.org/series/CWUR0000SA0#0


| Category | 97-20% | 97-22% | %Share |
|---|---|---|---|
| All | 59 | 75 | 100.0 |
| Food/Beverage | 64 | 82 | 15.1 |
| Transportation | 45 | 45 | 21.9 |
| Housing | 72 | 85 | 39.9 |
| Apparel | -5 | -5 | 2.6 |
| Recreation | 17 | 22 | 4.4 |
| Educn/Communicn | 27 | 31 | 6.2 |
| >Communication | -25 | -23 | |
| >Tuition, Fees, Child Care | 165 | 171 | |
| >>College Tuition | 191 | 196 | |
| Other Goods/Services | 122 | 139 | 2.8 |
| >Tobacco/Smoking | 362 | 424 | |
| Medical Care | 116 | 125 | 7.1 |
Analysis
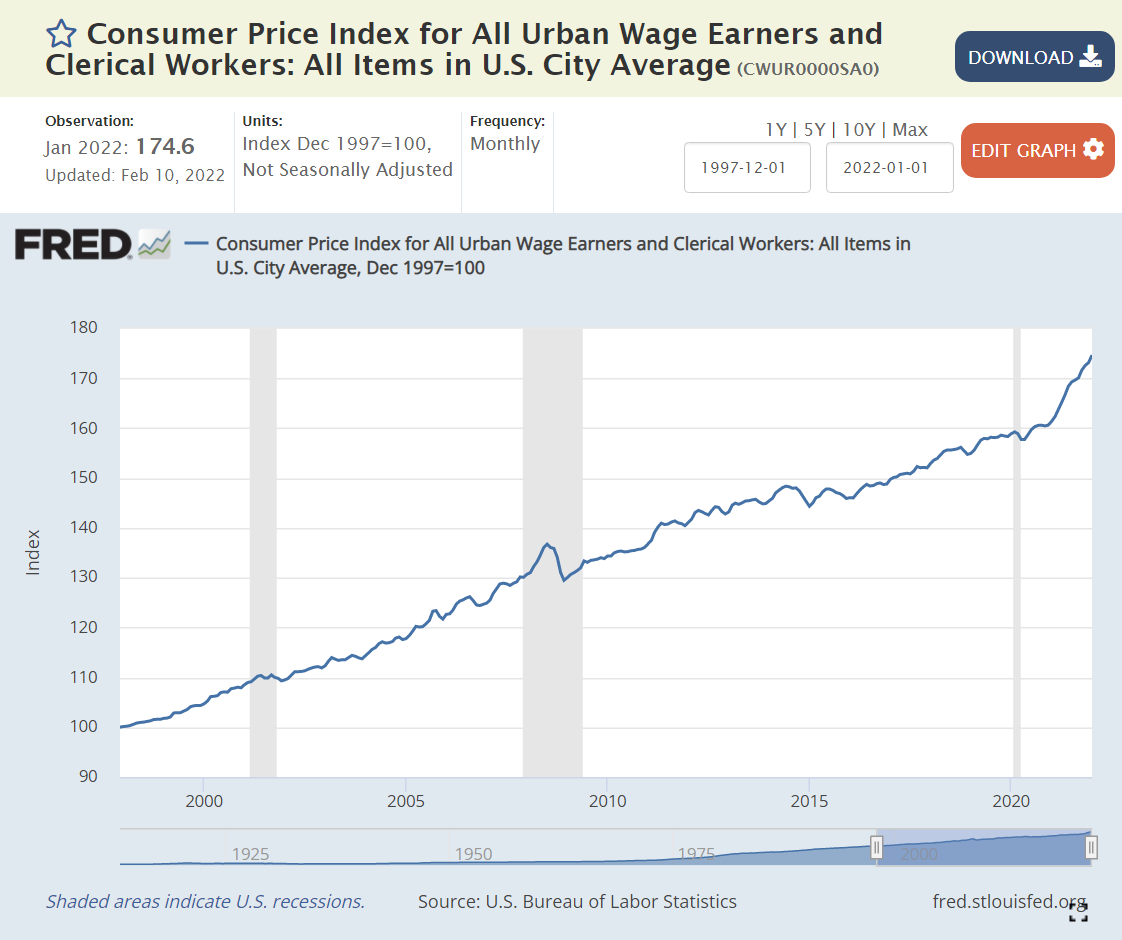
Inflation is back in the news after several quiet decades. The components of the All Urban Wage Earners and Clerical Workers are listed above, comparing Feb 2020 with a 1997 base of 100, and then Jan 2022 with the same base. The most recent weighting of categories is in the rightmost column.
Overall, consumer prices have risen by a modest 2-2.5% annually, just 59% through Feb 2020 and 75% through Jan 2022. Yes, that is a 10% price increase in the last 2 years: 175/159.
The 3 largest components have shown price rises close to the overall average. The biggest sector, Housing (39%), displays slightly higher inflation, at 72% and 85%, closer to 3% annually, with a possibility of higher rises for the next few years. Transportation (22%) reveals lower than 2% annual inflation with a 45% increase across the full period. Food and Beverage (15%) is close to the average with 64% and 82% growth.
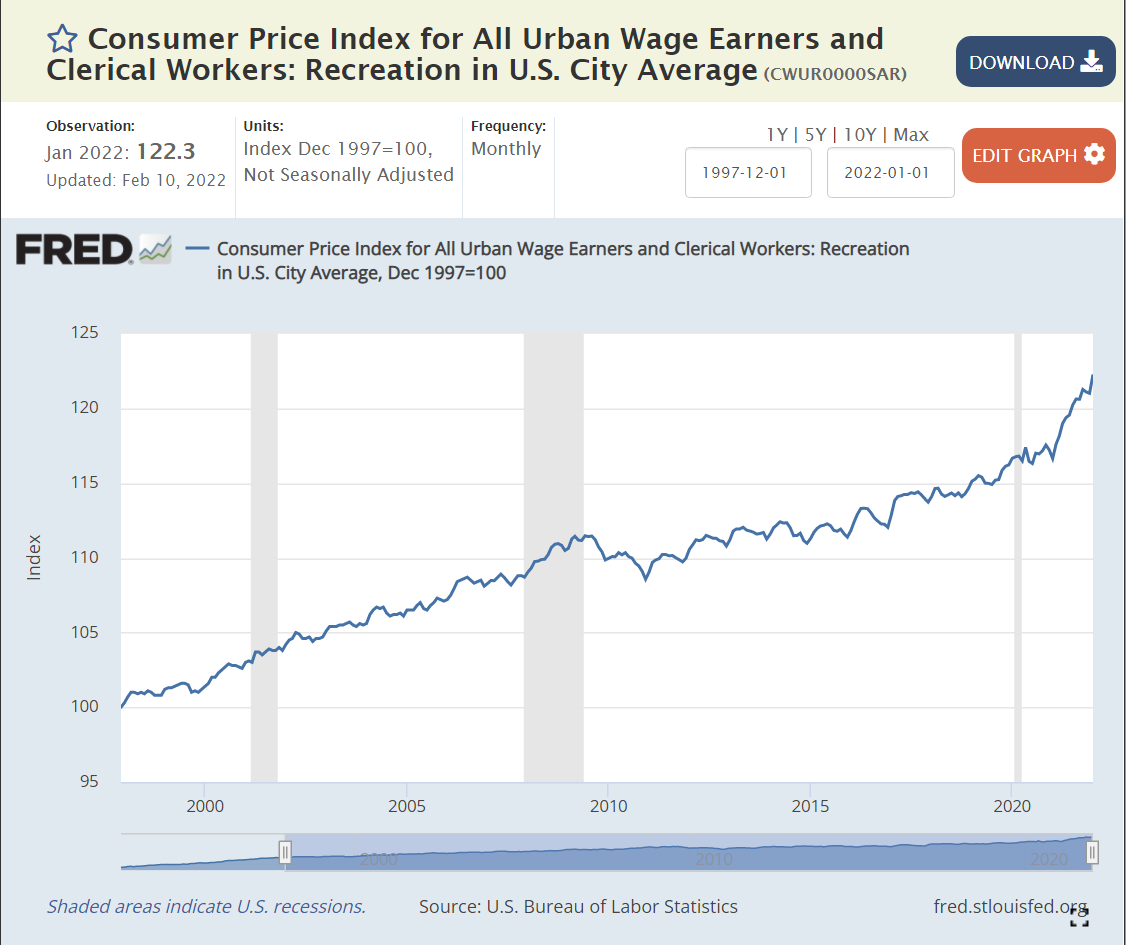
Some smaller areas have seen slow price growth. Apparel (3%) has declined in actual prices during this period. Recreation prices (4%) have grown by less than 1% annually.
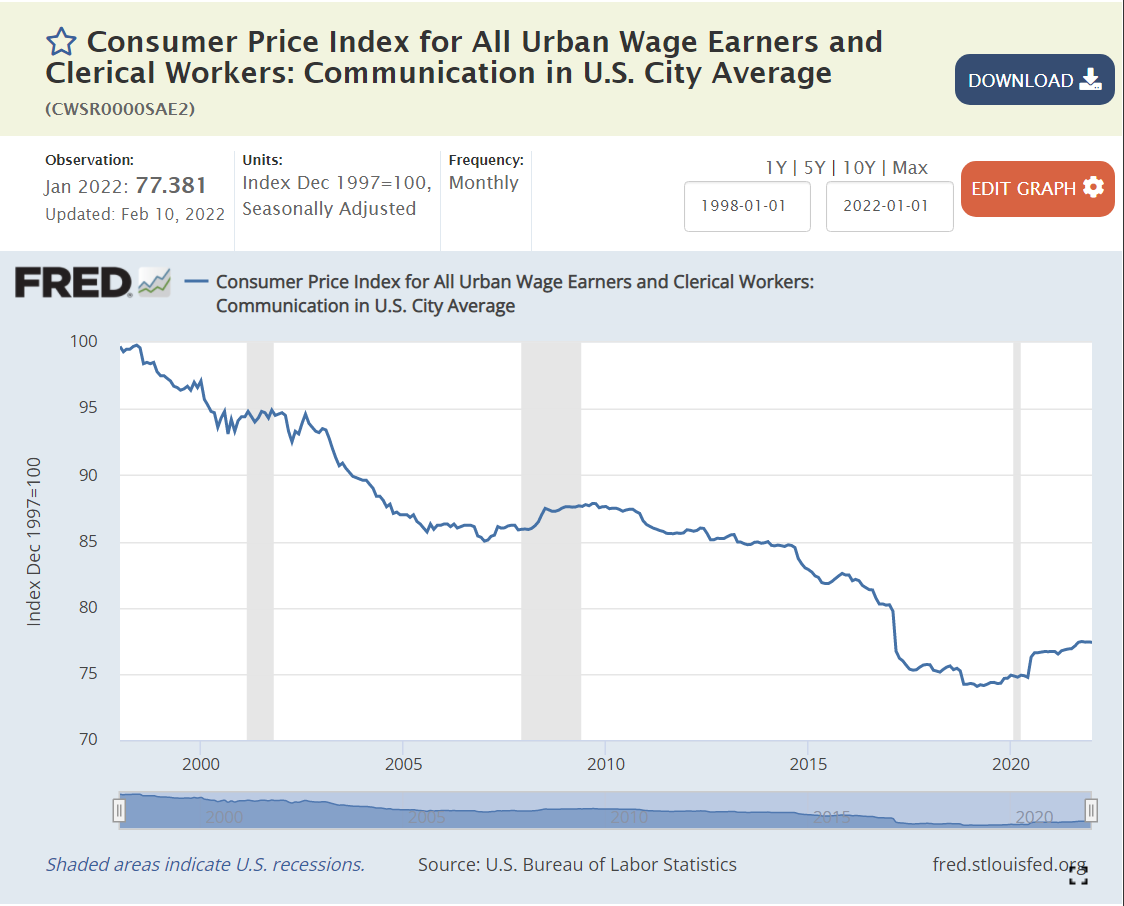
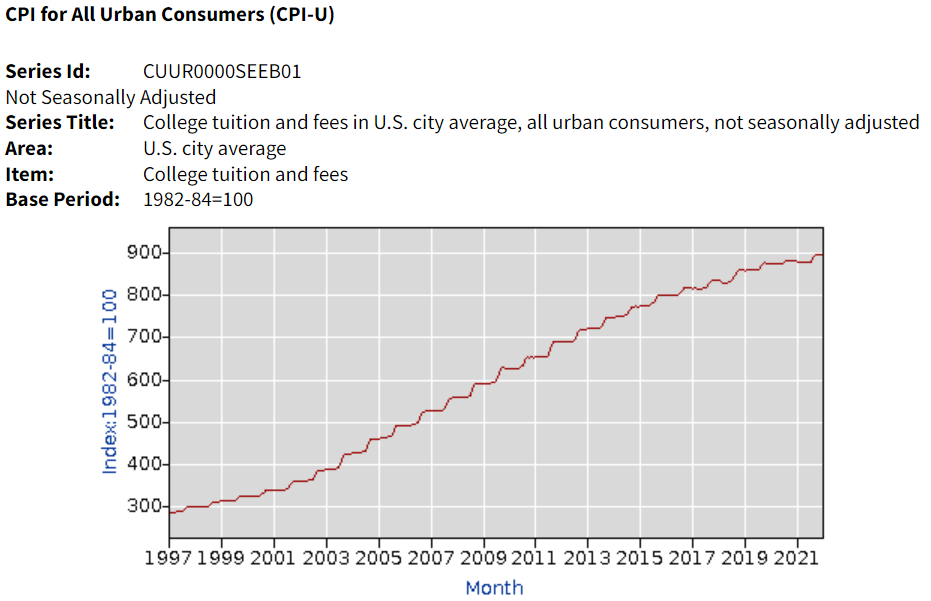
Education and Information (6%) prices have grown by 1% annually, but this category includes 3 very different subsectors. Information Technology prices have declined throughout the period. No simple 25- year summary is available. Communications prices have dropped by an average of 1% annually. Education prices have grown much faster, more than offsetting the decline in IT and communications prices. The Tuition, Fees and Child Care measure of prices increased by 165% and 171%, more than twice as fast as overall inflation, roughly 4% annually. College tuition (data not in Fred database) increased by 191% and 196%, about 4.5% per year.
The Other Goods and Services (3%) category mostly contains miscellaneous items that don’t fit cleanly in Housing or Food/Beverage. The category displays faster price increases (3.5%) on average due to the very sharp increase in Tobacco prices (taxes) which have grown 4-fold in 25 years (7%/year). Note that alcoholic beverage prices increased by a little more than 2% annually
Finally, Medical Care (7%) has grown by 116% – 125% during these 25 years, about 3.5% annually.
Overall goods prices have grown slowly and service prices more rapidly. Medical care and college prices stand out for their increases, while the price of housing/rentals is flashing warning signs.

[…] 25 Years of Inflation by Category […]