
Many states have legislatures and governors from the same party and voted for this party in both the 2016 and 2020 presidential elections. These states have adopted quite different Covid management strategies. There are 14 solidly Democratic states and 21 solidly Republican states, leaving 15 states with some level of “mixed” political control and influence.

https://www.ncsl.org/research/about-state-legislatures/partisan-composition.aspx#
https://www.cnn.com/election/2020/results/president
https://www.politico.com/2016-election/results/map/president/
https://en.wikipedia.org/wiki/List_of_U.S._states_and_territories_by_population
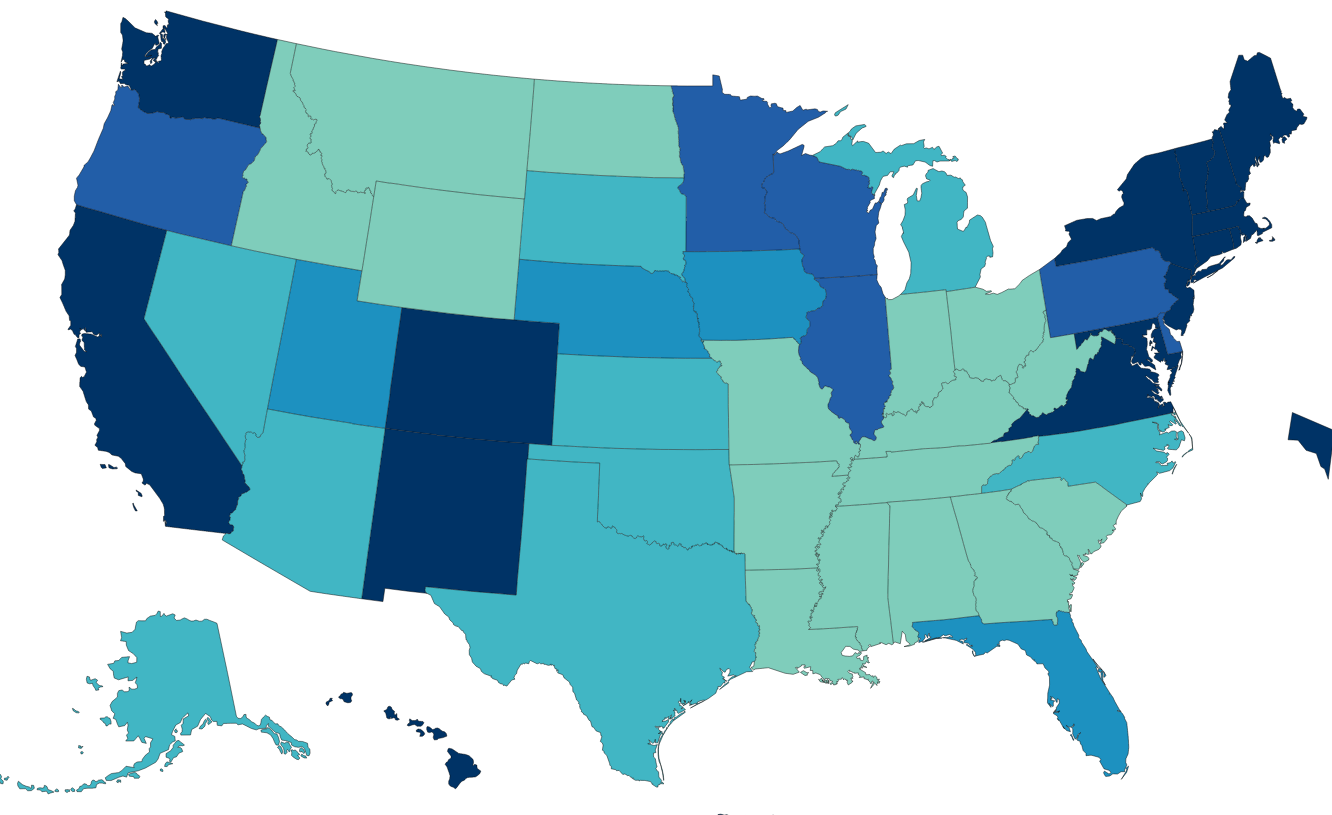
Fully Vaccinated, Age 18+
Democratic states average 80%, Republican states 66% and Mixed states 73%. The national average is 72%. Nevada (69%) is the only Blue state below 75%. Alabama, Wyoming and Mississippi have the lowest scores for the GOP at 59-60%. Florida has the highest rate at 75%. The split in world views is confirmed by this measure. The mixed group ranges from Louisiana and Georgia at 63% to Massachusetts (85%) and Vermont (86%).
https://covid.cdc.gov/covid-data-tracker/#vaccinations_vacc-total-admin-rate-pop18
Cumulative Death Rate / 100,000 Population
The overall death rate for the country is 256. The mixed states are similar at 265. The Democratic states average 221 deaths per 100K people. The Republican states average 282 deaths per 100K people. If the Republican states had the same rate as the Democratic states, they would have 59 fewer deaths per 100K people, for a cumulative total of 70,000. Economists use $10M as the value of a life in many cost-benefit calculations, so one measure of the difference is $700B.
California (196) and New York (227) drive the lower D result, but the Dems include higher fatality states such as Rhode Island (305) and New Jersey (344). The mixed states include some relatively high death rates in Michigan (315), Louisiana (329) and Arizona (350). The Republican group includes 3 states below the D average in Utah, Alaska and Nebraska, but 7 states at 300 or higher: Oklahoma, Indiana, West Virginia, Arkansas, Tennessee, Alabama and Mississippi.

https://covid.cdc.gov/covid-data-tracker/#cases_deathsper100k
As the median age for Covid deaths is 75, an argument could be made that the $10M economic value of a human life is too high in this analysis.
https://www.cdc.gov/nchs/nvss/vsrr/covid_weekly/index.htm#SexAndAge
Population density and the percentage of population aged 65+ did not have statistically material impacts on the pattern by political party control.
https://www.census.gov/data/tables/time-series/dec/density-data-text.html
Nonfarm Employment Recovery: Nov 2021 vs. Feb 2020
Overall employment is within 2% of the February, 2020 peak for the country as a whole. The “mixed” states have recovered to within 2.3% of the peak. The Democratic states are only at 96.4% of the peak, while the Republican states, on average, are just below breakeven at 99.9%. If the D states had the same level of recovery, there would be 1.8M jobs added in the recovery to date. At the recent median $1,000 per week wage, this would generate $94 billion of income annually.
https://www.bls.gov/news.release/laus.t03.htm#
I used the Feb 2015 to Feb 2020 period to generate a pre-Covid trend growth rate. This was 6.4% for the country, 5.4% for the mixed states, 7.0% for the D states and 6.7% for the R states. This indicates that the Republican faster recovery is not due to prior momentum. I used the 2020/2015 growth rate to create a solid estimate of the 2021/2020 recovery rate for each state (r = 0.63). It confirmed the 3%+ gap between the 2 parties was not due to prior trends. I also checked the percentage of 2019 employment in the leisure and hospitality sector, to see if this was driving the difference, but it did not have a material effect.
Mixed Political Control States
| State | % Vaccinated 18+ | Deaths/100K | Job Recovery |
|---|---|---|---|
| AZ | 69 | 350 | 103 |
| GA | 63 | 304 | 100 |
| KS | 70 | 251 | 98 |
| KY | 66 | 283 | 98 |
| LA | 63 | 329 | 93 |
| MD | 82 | 215 | 97 |
| MA | 85 | 310 | 97 |
| MI | 67 | 315 | 96 |
| MN | 77 | 200 | 97 |
| NH | 77 | 157 | 97 |
| NC | 68 | 192 | 100 |
| PA | 75 | 307 | 96 |
| VT | 86 | 78 | 93 |
| VA | 80 | 186 | 98 |
| WI | 73 | 205 | 97 |
Democratic Party States
| State | % Vaccinated 18+ | Deaths/100K | Job Recovery |
|---|---|---|---|
| CA | 79 | 196 | 97 |
| CO | 78 | 187 | 100 |
| CT | 86 | 274 | 96 |
| DE | 76 | 252 | 97 |
| HA | 86 | 79 | 88 |
| IL | 75 | 263 | 96 |
| ME | 86 | 126 | 96 |
| NV | 69 | 283 | 97 |
| NJ | 83 | 344 | 97 |
| NM | 79 | 298 | 96 |
| NY | 84 | 227 | 93 |
| OR | 77 | 140 | 98 |
| RI | 87 | 305 | 96 |
| WA | 80 | 136 | 101 |
Republican States
| State | % Vaccinated 18+ | Deaths/100K | Job Recovery |
|---|---|---|---|
| AL | 59 | 343 | 99 |
| AK | 70 | 139 | 94 |
| AR | 62 | 314 | 100 |
| FL | 75 | 296 | 101 |
| ID | 63 | 241 | 105 |
| IN | 64 | 308 | 98 |
| IA | 71 | 263 | 97 |
| MS | 60 | 360 | 99 |
| MO | 64 | 277 | 99 |
| MT | 64 | 278 | 101 |
| NE | 73 | 184 | 100 |
| ND | 65 | 271 | 96 |
| OH | 66 | 273 | 96 |
| OK | 66 | 300 | 97 |
| SC | 65 | 293 | 99 |
| SD | 71 | 294 | 99 |
| TN | 63 | 322 | 100 |
| TX | 70 | 264 | 102 |
| UT | 74 | 125 | 106 |
| WV | 65 | 312 | 96 |
| WY | 60 | 276 | 95 |
