
At the height of the cold war, in the year on my birth (1956), Soviet First Secretary Nikita Khrushchev warned the US that “we will bury you”. Agriculture was still a very large share of the USSR and US economies. He couldn’t have been more wrong.
https://en.wikipedia.org/wiki/We_will_bury_you
US statisticians have long separated the farm and nonfarm economies. A “census of agriculture” is conducted every 5 years to complement other economic statistics collected. The USDA Economic Research Service (ERS) does a great job of compiling statistics for the narrow (farming), moderate (fishing, timber) and broad (ag based production) agriculture industries.
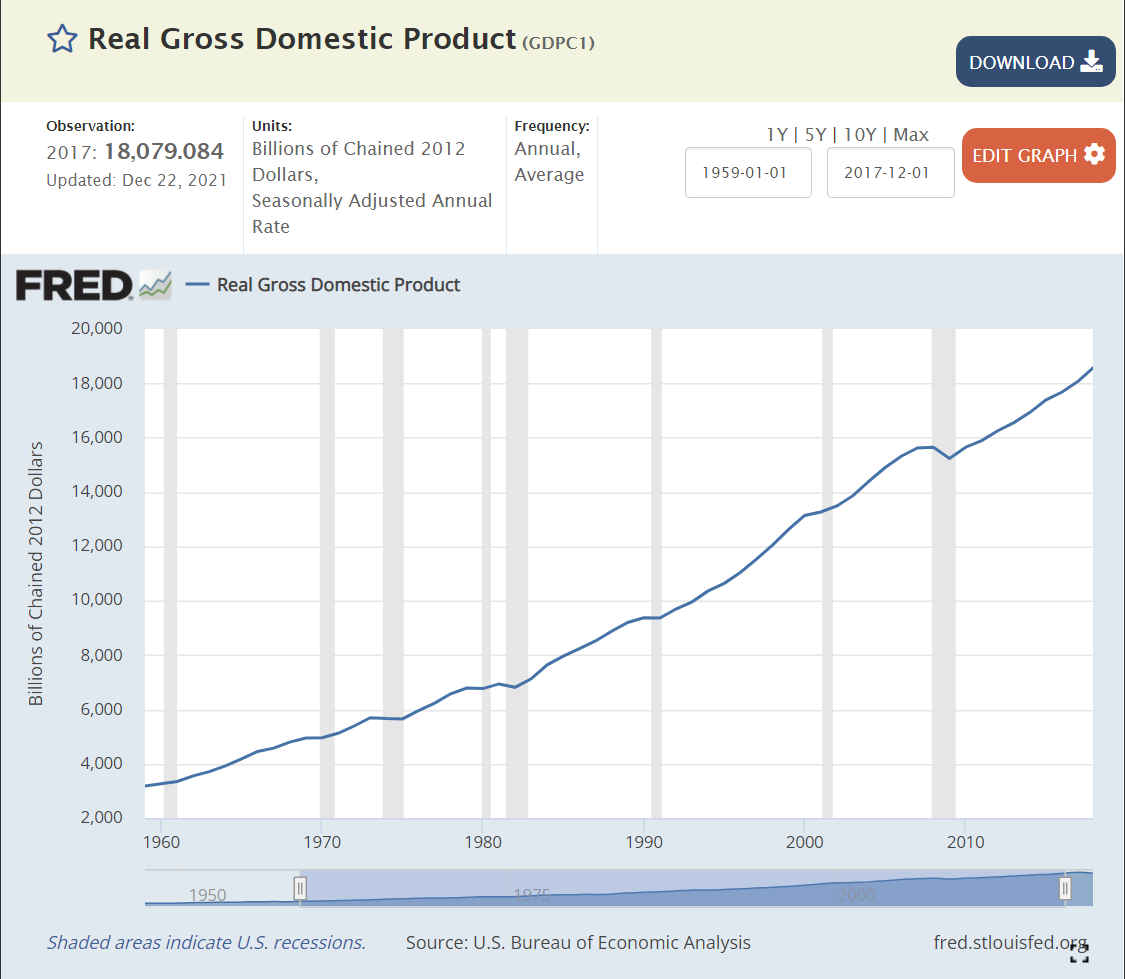
I’ve chosen to examine the near 60-year period from 1959-2017 covered by the censuses of agriculture. During this time, Real (inflation adjusted) US Gross Domestic Product (GDP), the value of all goods and services produced, increased from $3 to $18 trillion dollars, a near 6-fold increase, or 3% annually, year after year after year.
We don’t have an economic series that tracks wage and salary income back before 1979, but real disposable income per capita exists for this whole time period. This indicator or labor costs increased 3.4 times, from $12,600 to $42,900, or 2.1% annually. Given the strong growth of the US economy and its many new opportunities AND the increase in labor costs facing the oldest industry, one might have agreed with the Soviet premier back in 1956, at least regarding US agriculture. But, that prediction was wrong.

Index of Unit Outputs

The US agricultural economy grew to more than 2.5 times its 1959 base by 2017. It grew by 75% in the first 30 years and an additional 50% on top of that new base. The consistent pattern of growth is striking.
Real Market Value Produced
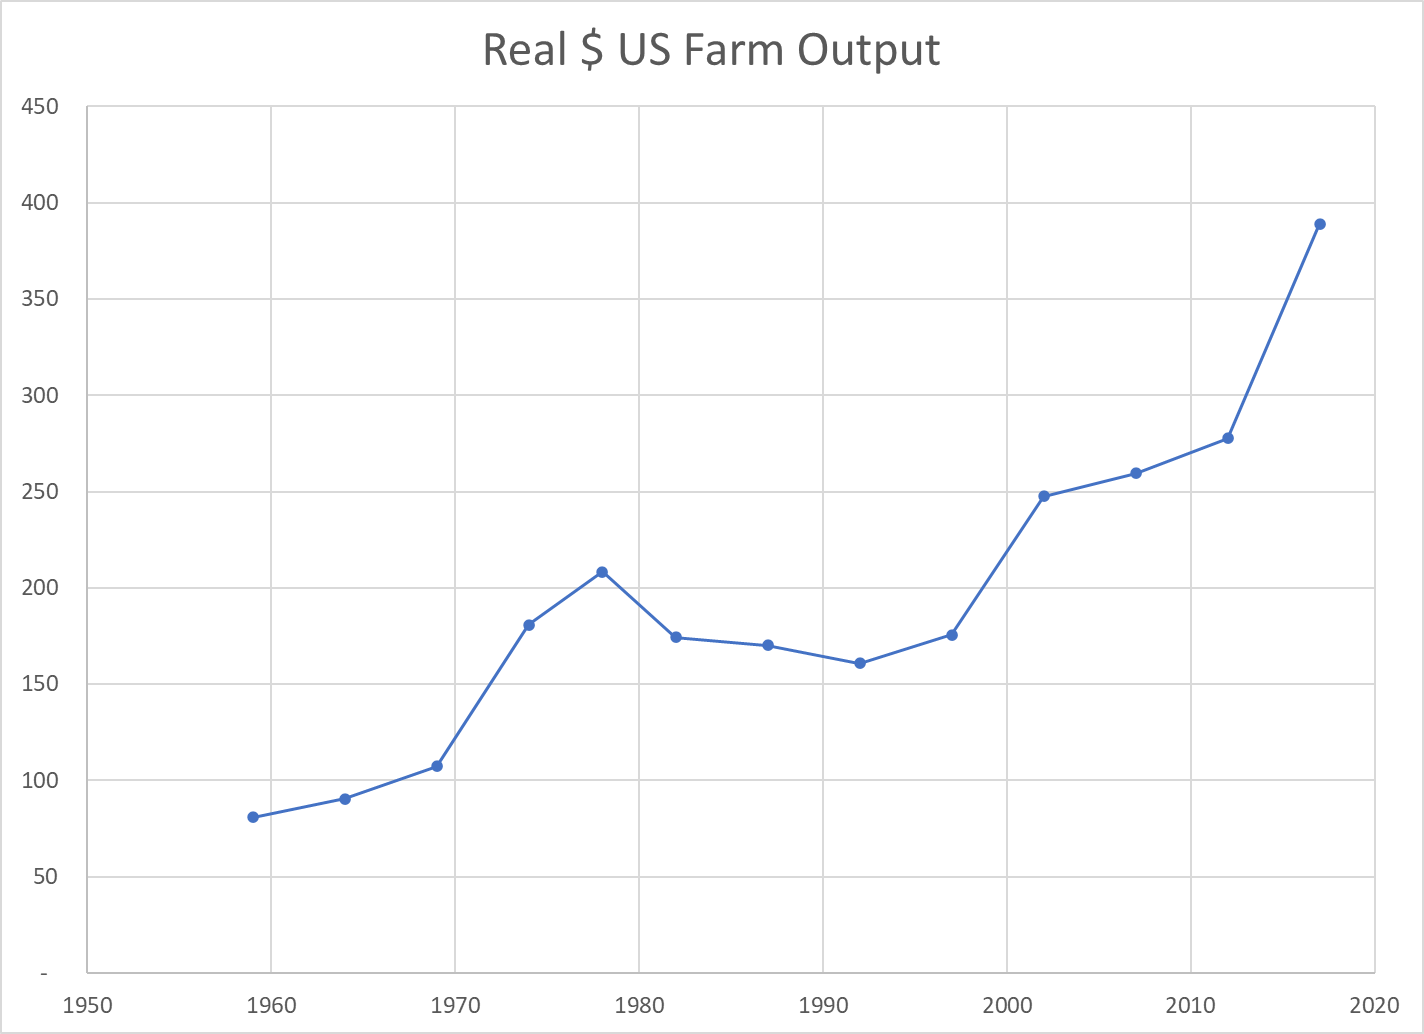
The Ag economy grew (based on variable market prices) 5-fold from $80B to $390B during these six decades, increasing by 110% in the first 30 years and a compounded 130% in the most recent 30 years.
Land Input (Acres)

The amount of land dedicated to production agriculture has decreased by 20% during our period of focus, from 1.1B to 0.9B. The decline was faster in the first 30 years (14%) than the second 30 years (7%). Despite this reduced demand for agricultural land, the value of such land has increased in real terms as its productivity has grown.


Labor Inputs FTE

The full-time equivalent labor force in the ag industry, as best as the USDA can measure it, dropped by nearly two-thirds in our six decades, from 2 million to about 700,000. It fell more rapidly in the first 30 years (50%), but a solid 25% in the most recent 30 years.
Total Factor Productivity
Economists try to measure land, labor and capital as inputs to the agricultural production process. As noted above, land and labor have declined. Capital – equipment, improvements, patents, inventory, etc. has increased. Overall, the total inputs have remained roughly flat for 60 years. Hence, almost ALL of the increased unit output is due to increases in productivity. Better crops, better labor skills, better processes, better methods, better irrigation, better crop rotation and selection, etc. Economists call this “total factor productivity”. After accounting for measurable increased inputs, the remaining improvement is called “productivity”.

The oldest industry in the world, increased its productivity in the US by 150% in these six decades; by two-thirds in the first 30 years and by one-half on the higher base in the second 30 years.

Output per Labor Unit (Labor Productivity)
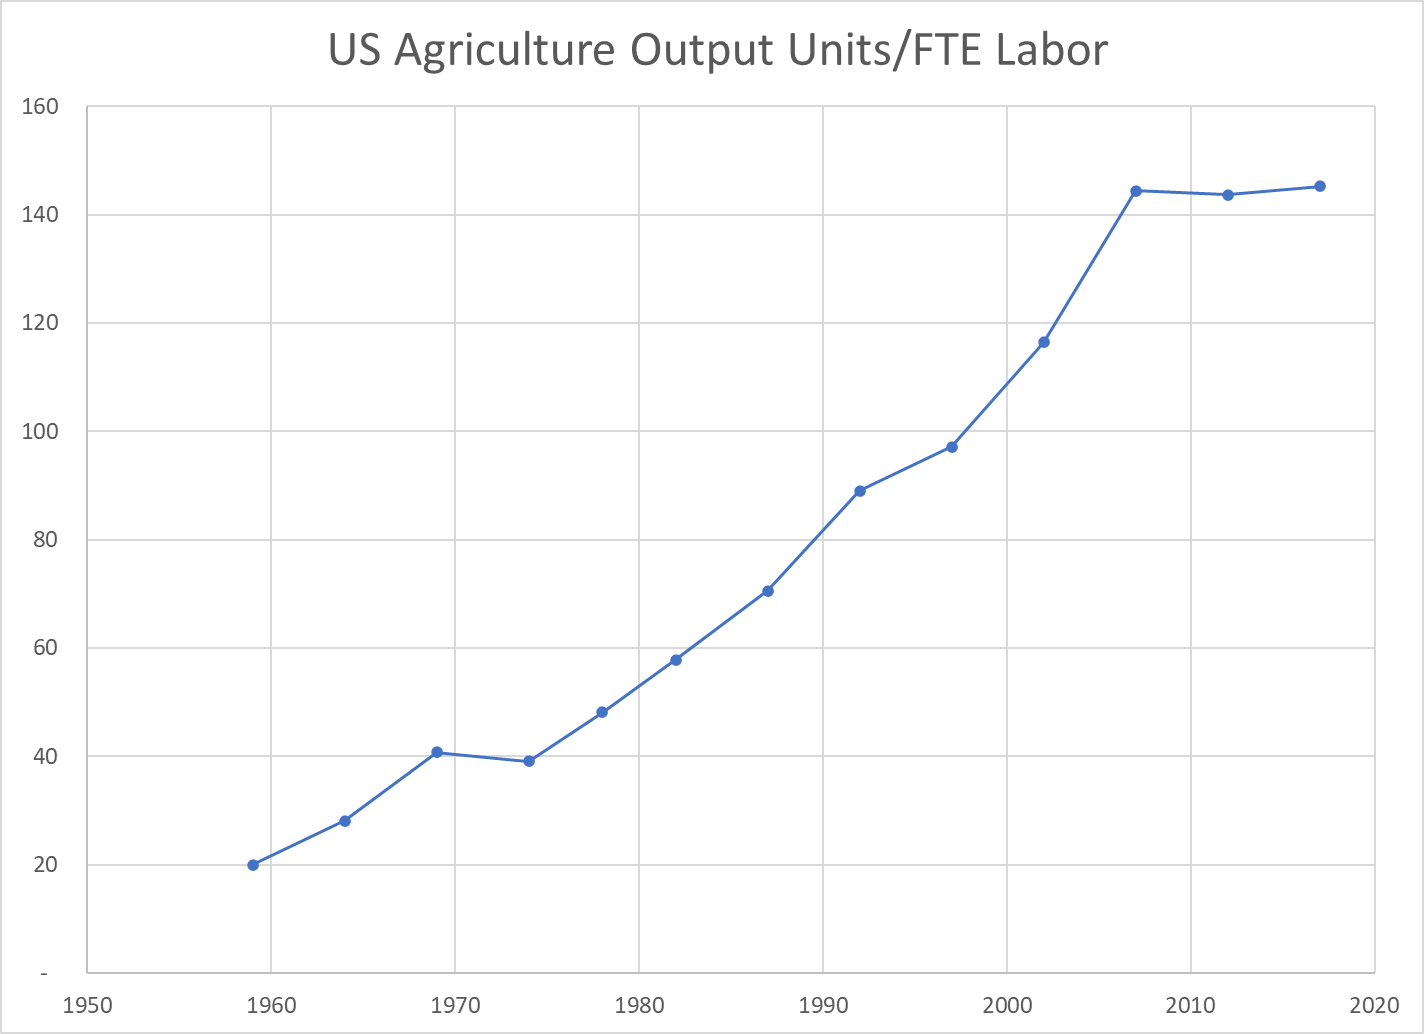
The strong increase in production combined with the two-thirds reduction in FTE labor required resulted in a 7-fold measure of improved labor productivity. The land input was down by 20% and the capital input increased significantly, but in simple terms, each hour of labor in 2017 delivered 7 times as much output as the labor in 1959. The increase was 2.5x in the first 30 years and a solid 2x in the more recent 30 years.
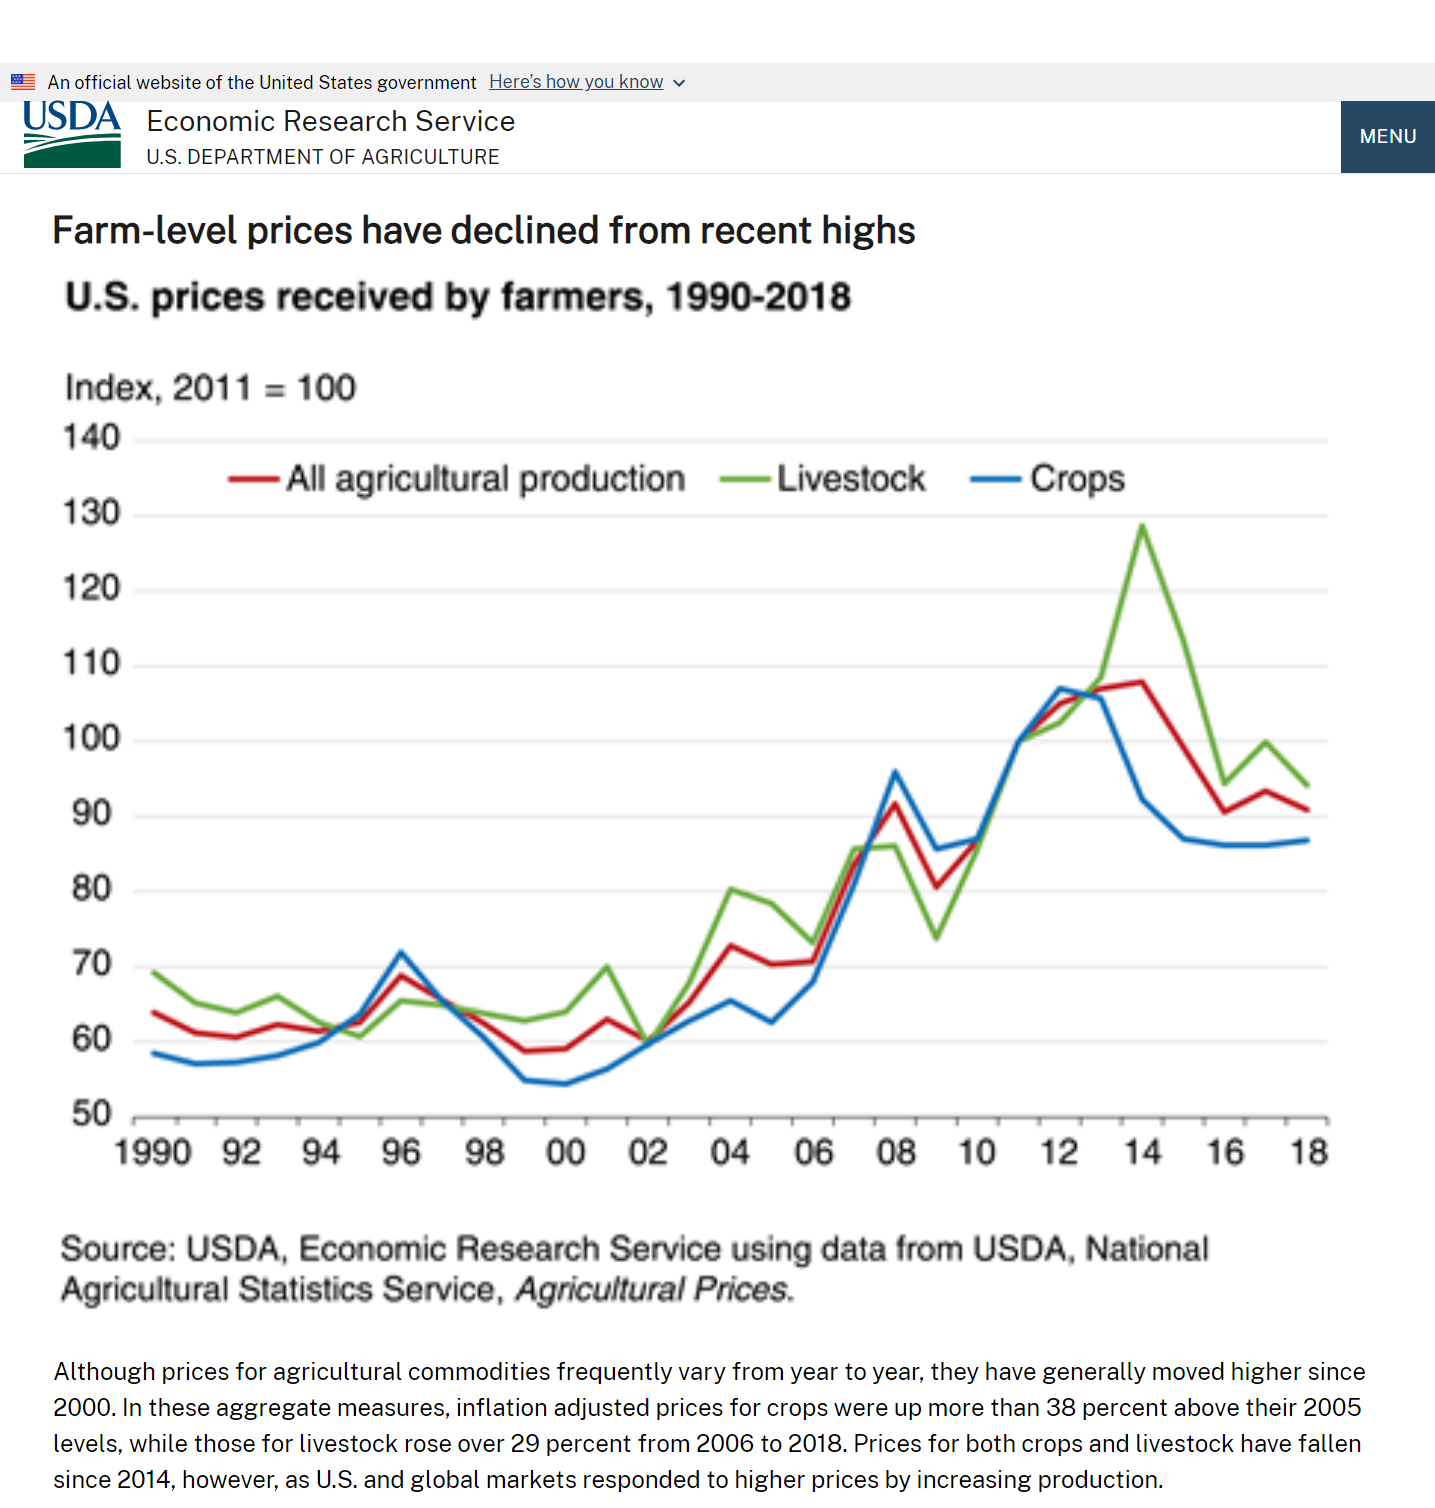
US Agriculture Output Price Index

The index of agricultural industry output prices has increased by 3-4x versus 8x for the consumer price index or GDP price index.
Real Market Value Produced Per Acre
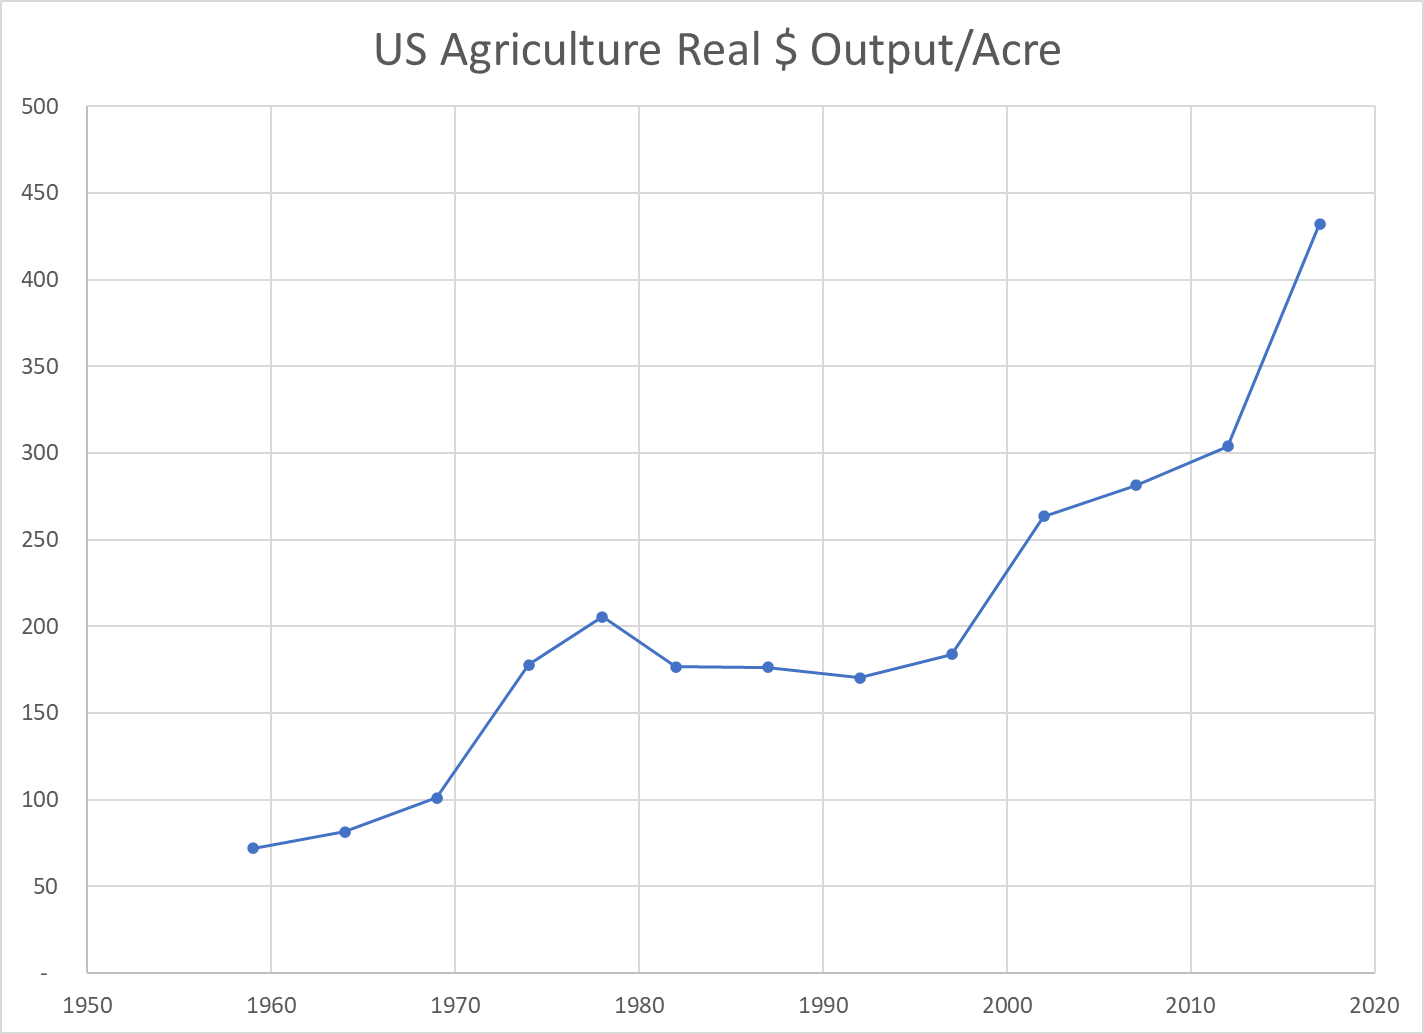
The real market value of ag goods produced increased 5-fold. The land acres required declined by 20%. The output value per acre figure improved 6-fold. Again, labor inputs declined and capital inputs increased. This measure of land productivity improved by 150% in both of the first and second 30-year periods.
Real Agricultural Exports

Real ag exports increased 4-fold in these 6 decades, doubling in the first and second 30-year periods.

Summary
Less land and labor. More capital (equipment). Much better R&D and processes. Total factor productivity up by 150% across 6 decades, an average of 1.6% year after year after year.
The US ag industry faces many challenges today. Environmental issues and climate change. Water shortages. Lower public and private R&D investment. Brain drain. Political polarization. Concentration of key property rights. Low wage labor access. Changing trade rules. Nonetheless, the last 60 years indicates that this industry is capable of delivering further increases in production and productivity for the next 60 years.
Sources
https://fred.stlouisfed.org/series/B359RC1A027NBEA
https://www.ers.usda.gov/data-products/agricultural-productivity-in-the-u-s/
https://data.ers.usda.gov/reports.aspx?ID=17835
https://www.ers.usda.gov/topics/farm-economy/land-use-land-value-tenure/farmland-value/
https://fred.stlouisfed.org/series/B181RC1Q027SBEA#0
https://www.govinfo.gov/app/collection/ERP/2005
https://www.ers.usda.gov/topics/farm-economy/land-use-land-value-tenure/farmland-value/
https://fred.stlouisfed.org/series/B181RC1Q027SBEA#0

[…] Good News: US Agriculture […]
[…] We’re (Almost) All On-line Good News: Real Airfares are 43% Less than in 1995 Good News: US Agriculture Good News: US Remains the Gold Standard for $GDP/Capita Good News: US Economy is 29 Times […]