
“Typical welfare family”, a single parent and 2 children (cue the video), receives $35,000 of welfare benefits annually claims the Wisconsin congressman in 2014. That number has stuck in our minds, just like the “welfare queen” and escaped prisoner “Willie Horton”.
https://www.washingtonpost.com/news/fact-checker/wp/2014/12/05/grothman-single-parents-welfare/

Fact checkers debunked this claim, but it’s important to work through the details to get back to a reasonable “order of magnitude” estimate of “welfare benefits”.
If a family has ZERO income, they may receive maximum benefits. The Clinton “welfare reforms” limited the primary benefits to a total of 60 months. Families cannot receive benefits “forever”. Most household heads do work and have some income during the year. The maximum benefit number is an inappropriate “anchor”.
Temporary Assistance for Needy Families (TANF) (welfare) participation rates have fallen from 80% of those eligible to less than 25% since “reform” was implemented. The reform has had it’s intended effect. Two-thirds of those previously participating no longer do so. Some have become more productive and income earning members of society. Others “make do”.
Click to access what_was_the_tanf_participation_rate_in_2016_0.pdf
The percentage of families “in poverty” receiving welfare benefits has fallen from 68% to 23%.
Current average TANF benefits in my home state of Indiana are $346/month or $4,152. That’s a long way from $35,000 of cash benefits, which is the “anchor” that needs to be removed. $4,000 per year of cash is the typical Indiana welfare benefit. The maximum is $700/month or $8,400/year, twice as high. More kids, no income, still eligible. This is possible, but it’s not a useful reference point. The normal received benefit is just one-half of the maximum.
https://www.needhelppayingbills.com/html/indiana_cash_assistance.html
Supplemental Nutritional Assistance Program (SNAP of food stamps) is the next welfare program. For an Indiana family of 3, current benefit value is $6,240 per year. A family of 3 can earn up to $25,000 annually before benefits start to decline. The national ratio of SNAP to TANF recipients is 82%. In Indiana, just 75% of those eligible receive ANY SNAP benefits.
https://www.fns.usda.gov/usamap/2018#
https://www.in.gov/fssa/dfr/snap-food-assistance/about-snap/income/
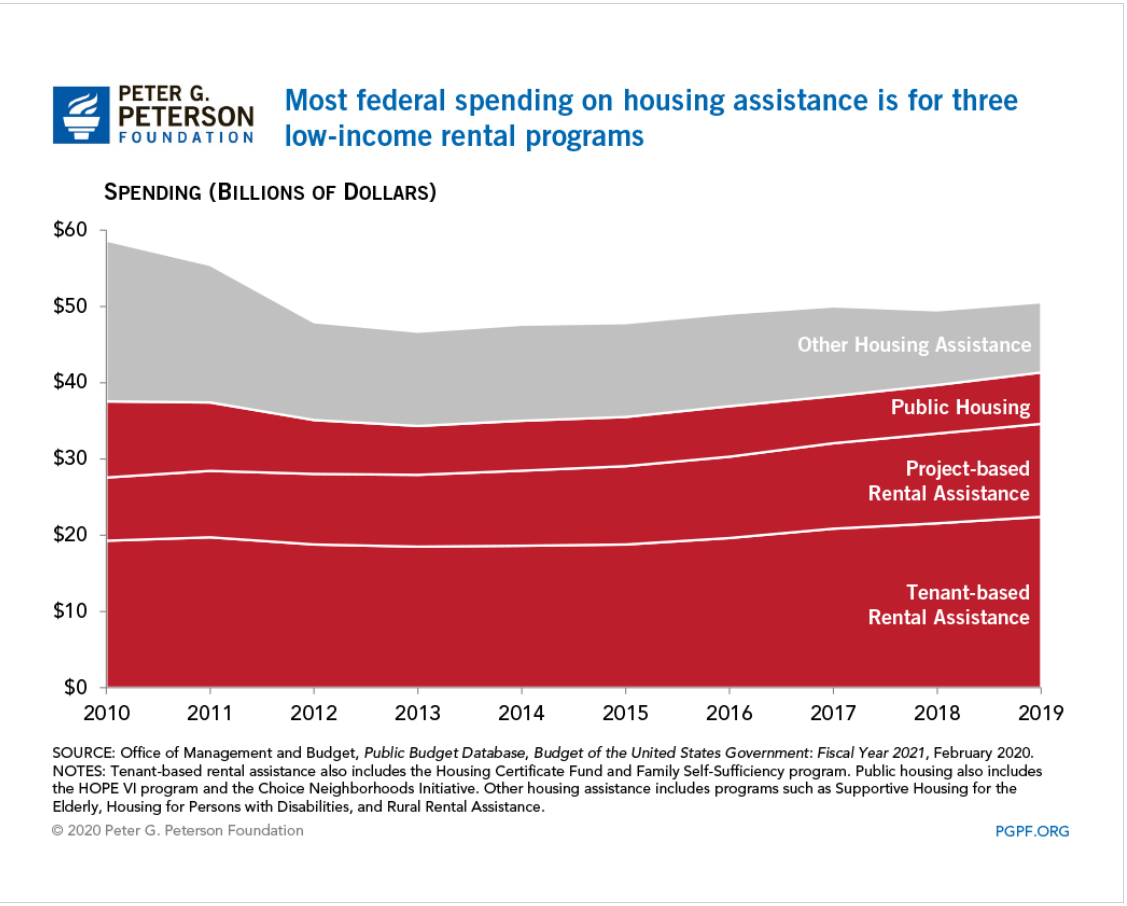
Housing assistance is listed at $9,000. There are various federal and state programs. This is like “winning the lottery” for low income families. In Indiana, 1 in 8 eligible families (12%) receive housing subsidies. These average $736/month or $8,832 per year. On an “expected value” basis, this is only $1,060 per year. From a public policy point of view, this is the relevant number.
See pages 23-24.
Support has not increased materially since 2013.
In the Wisconsin representative’s model, there is $7,000 of higher education benefits. This is clearly irrelevant to public policy. Individuals do not make ongoing annual work choices based on education benefits.
The Cato Institute started this “conversation” about “welfare versus work” in 1995 and updated their analysis in 2013.
Like the congressman, they note that the “welfare benefits” received are in “after-tax” dollars, so they “should” be translated back into pre-tax dollars to be “fair”. Since the marginal tax rate for low-income wage earners is often just 10%, this is immaterial. More importantly, the emotional, political currency is cash. “how much do THEY receive?” is THE question. This is an after-tax amount. No “grossing up” is required.
The Cato folks also include the full value of Medicaid benefits received by those below the eligible income transition. The value paid per child ($2,145) and per adult ($4,211) yields an $8,501 annual “benefit” currently. Is this a “welfare” benefit or a “citizen” benefit? The US health care system is primarily funded through tax-deductible employer plans. Medical plan subsidies are now available up to 400% of the federal poverty level. From a federal budget perspective, lowest income families receive more value. From an “incentive” perspective, low income families are generally indifferent between federal and employer sponsored plans. This $9,000 does not belong in “the cost of welfare”.
The Cato analysis includes the cost of the “earned income tax credit” (EITC) as a welfare benefit. The EITC was created and enhanced as an incentive for unemployed persons to work and earn some income, thereby providing themselves with short-term and long-term benefits and reducing the cash level welfare benefits. It grows quickly with earned income up to about $18,000 and then falls back down nearly as quickly as income grows to $40,000 per year. This is not what most people think of as a “welfare benefit”.
https://en.wikipedia.org/wiki/Earned_income_tax_credit
The Cato analysis also focuses on welfare benefits versus the minimum wage, emphasizing that overly generous welfare benefits provide a disincentive for recipients to seek paid employment (ignoring the 60 month TANF benefits limit). As the effective minimum wage in 2021 approaches $15/hour and $31,200/year, we won’t be hearing this comparison again.
As a professional “cost accountant” since 1978, I was often asked to provide the “exact cost” of various products or services. College courses, residence hall rooms, food service meals, buildings for rent, account managers, computer hardware, installed cables, telephone services, computer maintenance, software development, dresses, tops, retail stores, extension cords, surge protectors, imported goods, cell phones, returned cell phones, etc. The answer is always “it depends”. This is never a popular answer. It depends on what decision you are making. Short-term, medium-term or long-term timeframe. Do we include opportunity costs? Which externalities should we consider, if any? Do we include strategic, brand or cultural consistency as factors?
For the “welfare benefits” question, I think that the relevant public policy/budget and personal incentive numbers are largely the same. Welfare/TANF and food stamps/SNAP matter. EITC, medicaid, education benefits, housing assistance, and income taxes don’t matter.
Welfare/TANF for an Indiana family of 3 is worth $4,152 annually. The complementary food stamp/SNAP benefits are worth $6,240. The total quasi-cash welfare payment is $10,392 per year of eligibility. Maximum of 5 years. This is the right “anchoring” number: $10,000 per year for a family of 3. They will be going to the local food pantry every week. They will be seeking family and private charity. They will be leaning on friends, relatives and neighbors for “subsidized” child care. They will be working and seeking to advance themselves.
There are disincentive challenges remaining in our current systems.
https://www.washingtonpost.com/news/fact-checker/wp/2014/12/05/grothman-single-parents-welfare/
But, these technical, marginal, incremental, opportunity rates are not the heart of the matter. Lower income families are not “optimizing” their benefits. I volunteered to provide low income/elderly federal income tax services for several years. The benefit and tax rules are complex beyond comprehension.
The core public policy question is “Is $10,000 of annual benefits a reasonable amount for our state to pay to a family of 3 with no income?”. I would argue that it is too low, half what it ought to be.
Support for a universal basic income (UBI) has grown in recent years, as the economy, productivity and equity returns have grown by 3% annually but wages have remained flat for 40-50 years in the US.
https://www.investopedia.com/news/history-of-universal-basic-income/
Typical welfare benefits at $10,000 are now irrelevant compared with $30,000 effective minimum wage.
